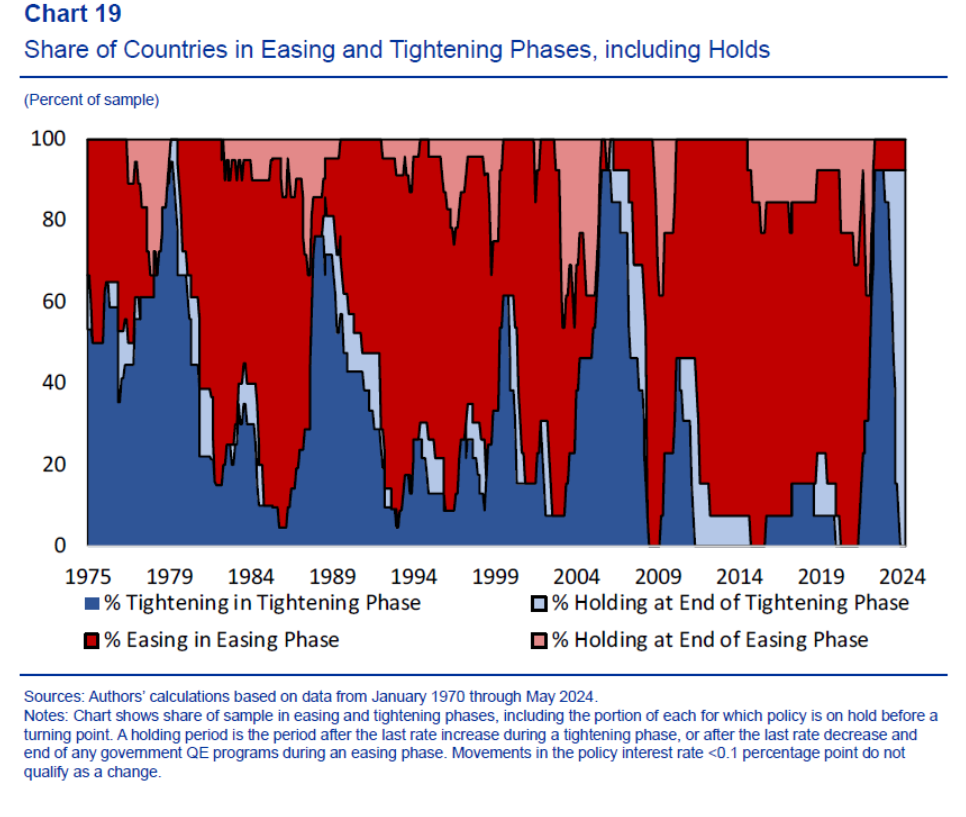
I’ve been remiss in reporting on this important work by Kristin Forbes, Jongrim Ha and Ayhan Kose, documenting periods of monetary policy tightening ad loosening, and characteristics of those episodes. From the paper:
Source: Forbes, Ha and Kose (ungated version, 2024).
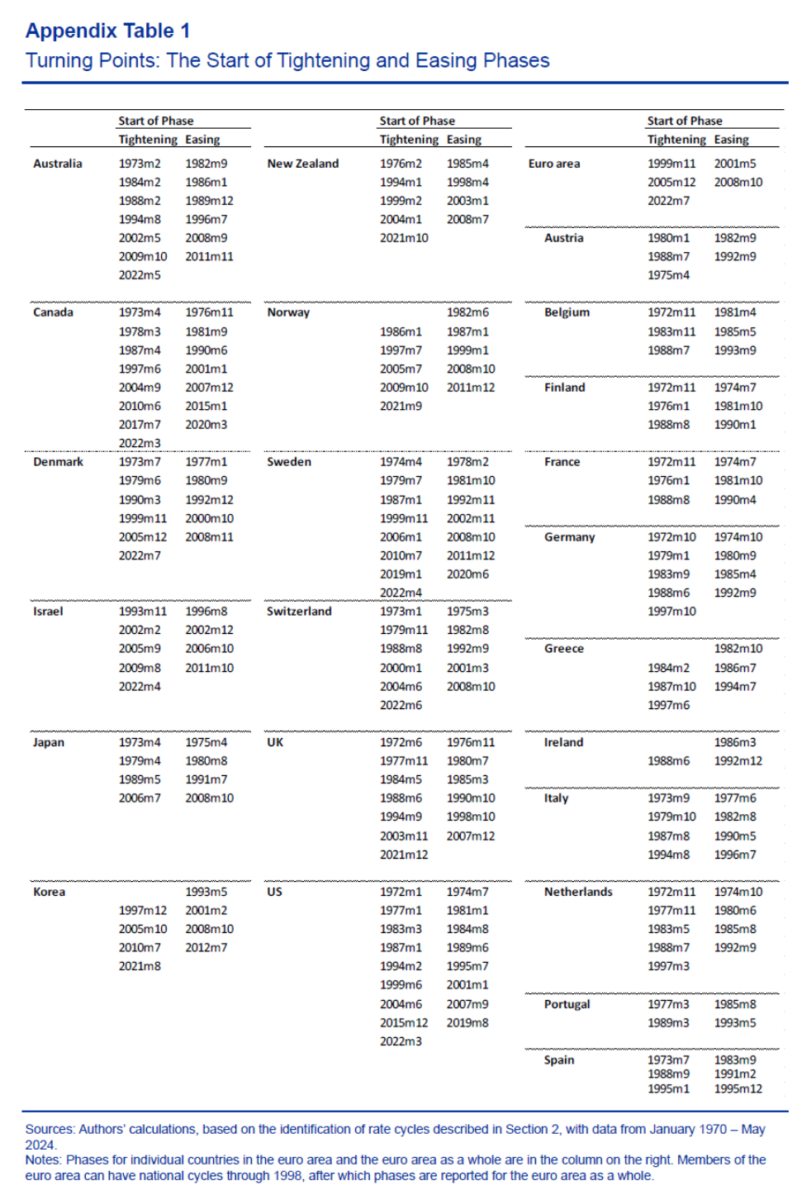
The methodology of identifying the cycles will look familiar to those familiar with business cycle dating. The chronology is here:
Source: Forbes, Ha and Kose (ungated version, 2024).
From the abstract:
We analyse cycles in policy interest rates in 24 advanced economies over 19702024, combining a new application of business cycle methodology with rich timeseries decompositions of the shocks driving rate movements. “Rate cycles” have gradually evolved over time, with less frequent cyclical turning points, more moderate tightening phases, and a larger role for global shocks. Against this backdrop, the 2020-24 rate cycle has been unprecedented in many dimensions: it features the fastest pivot from active easing to a tightening phase, followed by the most globally synchronized tightening, and an unusually long period of holding rates constant. It also exhibits the largest role for global shocks— with global demand shocks still dominant, but an increased role for global supply shocks. Inflation and the growth in output and employment have, on average, largely returned to historical norms for this stage in a tightening phase. Any recalibration of interest rates going forward should be gradual, however, taking into account the interactions between increasingly important global factors and domestic circumstances, combined with uncertainty as to whether rate cycles have reverted to pre-2008 patterns.
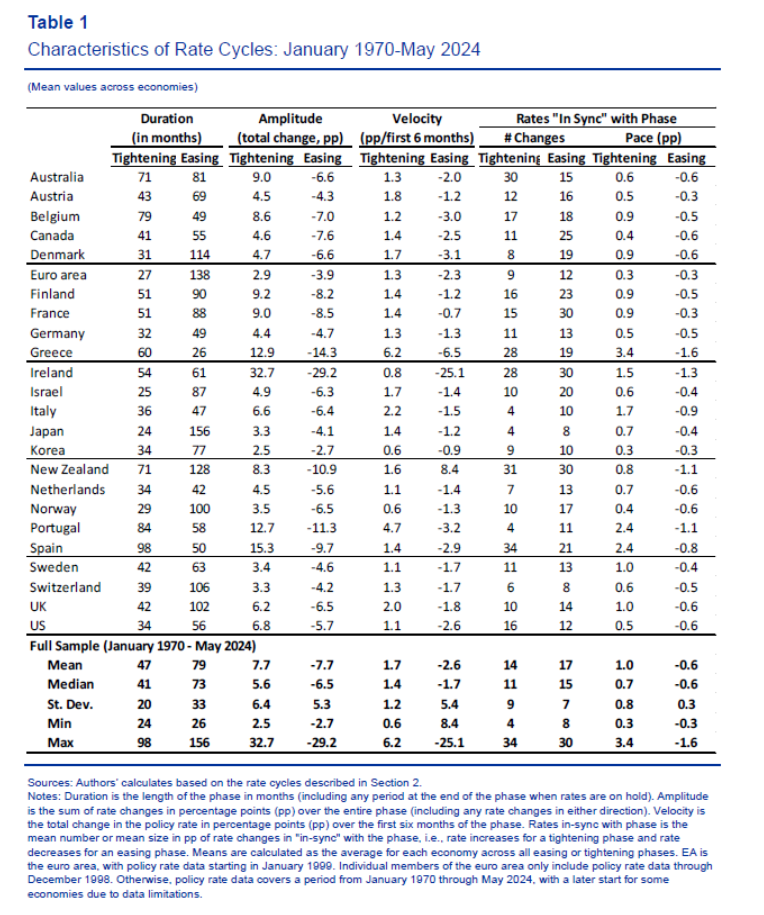
Table 1 presents a plethora of stylized facts about such rate cycles and synchronization with other rates.
Source: Forbes, Ha and Kose (ungated version, 2024).
In another paper “Tradeoffs over Rate Cycles”, the authors trace out the macro implications:
Central banks often face tradeoffs in how their monetary policy decisions impact economic activity (including employment), inflation and the price level. This paper assesses how these tradeoffs have evolved over time and varied across countries, with a focus on understanding the post-pandemic adjustment. To make these comparisons, we compile a cross-country, historical database of “rate cycles” (i.e., easing and tightening phases for monetary policy) for 24 advanced economies from 1970 through 2024. This allows us to quantify the characteristics of interest rate adjustments and corresponding macroeconomic outcomes and tradeoffs. We also calculate Sacrifice Ratios (output losses per inflation reduction) and document a historically low “sacrifice” during the post-pandemic tightening. This popular measure, however, ignores adjustments in the price level—which increased by more after the pandemic than over the past four decades. A series of regressions and simulations suggest monetary policy (and particularly the timing and aggressiveness of rate hikes) play a meaningful role in explaining these tradeoffs and how adjustments occur during tightening phases. Central bank credibility is the one measure we assess that corresponds to only positive outcomes and no difficult tradeoffs.
Back to the question of where are we now? CFR’s Monetary Policy Tracker gives a hint on the diffusion of tightening/loosening:
![]()
However, in terms of peak vs. trough for major central banks, this picture might be of more use:
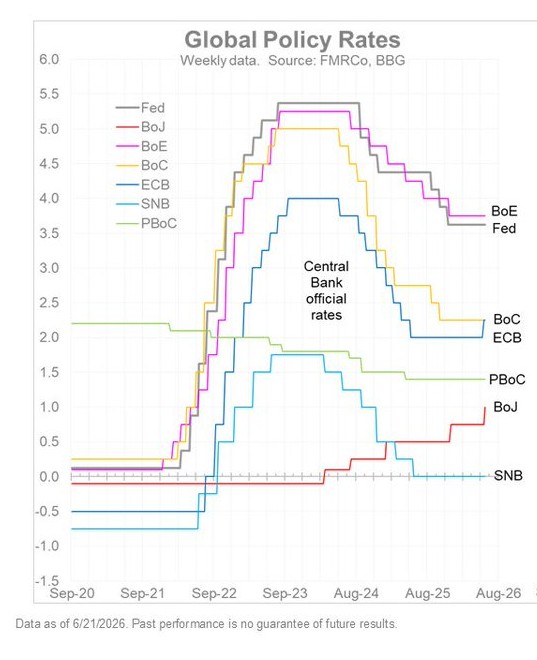
Source: Fidelity via Timmer.
That is, it’s too early to say…
This post got me looking at something I had not checked on in a very long time (as in maybe a decade): ECRI’s future inflation gauge:
https://www.linkedin.com/pulse/inflation-three-layer-cycle-story-xvi9e?trk=public_post
The included graph shows that the gauge started to turn up late last year, and was only accelerated by the Iran war. In fact they say the trend is in play even without the war.
Of course, their methods are proprietary, I.e., in a black box. But if they are right, more tightening looks likely.
http://www.nytimes.com/2026/06/28/world/europe/trump-lutnick-sons-kazakhstan.html
Tungsten deal and corruption in Kazakhstan ala Trump and his sons.
Yeah, and Lutnick’s family, too. The mining deal started last year:
https://www.rawstory.com/trump-family-2677121620/
The felon-in-chief’s association with corruption in Kazakhstan goes back at least to 2008:
https://en.wikipedia.org/wiki/The_Ritz-Carlton_Baku_Hotel
Off topic – Liberty Street Economics has just published a look at the latest decline in labor’s share of national income, entitled “The Post‑COVID Decline in the Labor Share”.* The article notes a change in patterns of labor share in recent business cycles:
“Most pre-2000 periods follow a similar pattern: the labor share increases during a recession, declines through recovery, and then rises again later in the expansion.”
“This behavior changes in the 2000s. Following both the dotcom recession and the GFC, the decline in the labor share during expansion is steeper than in earlier cycles. Moreover, unlike in pre-2000 episodes, the labor share does not meaningfully rebound later in the expansion.”
https://libertystreeteconomics.newyorkfed.org/2026/06/the-post-covid-decline-in-the-labor-share/
And, of course, labor’s share has reached a new low since the Covid recession.
I’ve been wondering whether the greater share going to owners of capital doesn’t account for the rise in price/earnings ratios to a level which in the past has proven unsustainable. The timing is pretty similar, though somewhat obscured by the Nasdaq bubble popping:
https://www.multpl.com/shiller-pe
Given the endless effort to discover causal relations in financial, I doubt I’m the only one to notice this, but I haven’t seen it published anywhere. I do recall a study indicating that stock valuations historically are more responsive to labor costs than any other factor, which seems kinda the same idea.
Also, the divergence between the misery index and consumer sentiment measures also lines up pretty well with the Covid-era decline in labor’s share.
* We aren’t “post-Covid”. Covid is alive and well. As a culture, we’ve decided to pretend, that’s all.