Chicago Fed letter, by Brave, Henken, and Jolley:
…we show how related daily measures of consumer sentiment can be used to correct for potential biases in the University of Michigan’s Index of Consumer Sentiment and construct a composite index—called the Composite Consumer Sentiment Index, or C-CSI—that correlates more closely with consumer spending.
The key graph:
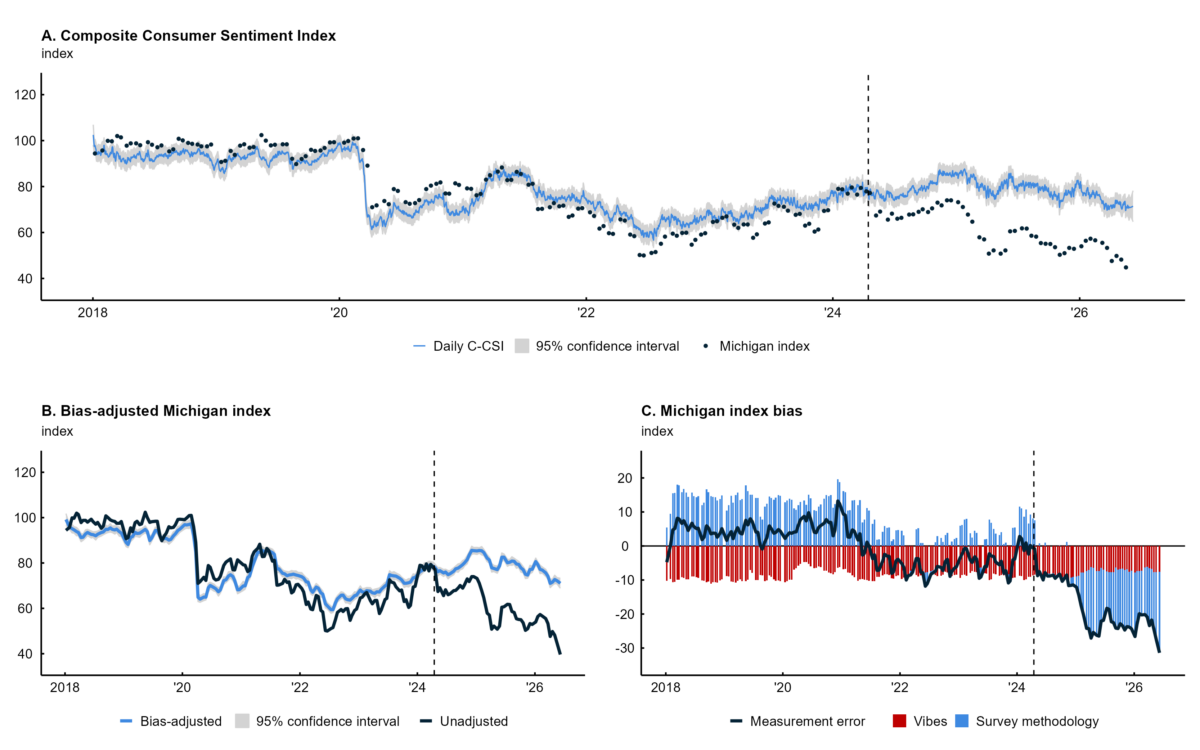
Source: Brave, Henken and Jolley (2026).
Using this measure, consumer sentiment is actually fairly high, not much lower than early 2024.
As I understand it, sentiment measures historically have mostly just told us what we already know about spending. Expectations indices, to the extent they diverge from current sentiment measures, might offer a bit of predictive power. Otherwise, the only predictive capacity of consumer surveys is that they are released with a shorter lag than retail sales data.
Consumer sentiment measures also historically tracked the “misery index” – the jobless rate + the inflation rate, as well as consumption. That, too, has broken down.
Something has changed, and there are a couple of ways to deal with that. One is to jigger the data to erase the divergence. That’s what Brave, Henken, and Jolley are doing. They find a “bias” in the data, but that’s really just more math about the divergence. Their new index simply erases the divergence. Nothing to see here, so move along. Jared Bernstein has done pretty much the same thing by including price level (inflation over a longer period) into the misery index. Sure, Jared, but WHY do we need price level now when we didn’t before?
There is another way; we could look for an actual explanation for the divergence. For instance, there is a widespread guess that economic inequality – winners and losers – explains the disconnect between sentiment on the one hand, consumption and the misery index on the other. Here’s Thorsten Slok:
https://www.apollo.com/wealth/the-daily-spark/consumer-confidence-diverging-for-low–and-high-income-households
Slok finds an historically large difference in sentiment readings between households with incomes above $100k and those with incomes below $50k.
The finding that consumer sentiment diverges across income groups isn’t novel. Here’s the ECB from a year ago:
https://www.ecb.europa.eu/press/economic-bulletin/focus/2025/html/ecb.ebbox202505_01~304c94491d.en.html
Now, let’s imagine that we weighted sentiment by spending – big spenders get a heavier weight in the sentiment index than little spenders. We know that the top 20% or so of households have driven pretty much all the rise in household spending in recent quarters. So we know that a spending-weighted sentiment index is likely to show a smaller gap with spending than conventional indices do. This is a re-jiggering of the data, but this re-jiggering is driven by economic reasoning. It doesn’t make information disappear.
There are other possible explanations. We might look at policy shocks, policy approval, the everyday price index instead of CPI or the PCE deflator, or “softer” measures of societal division or discontent.
Knowing why sentiment indices are behaving differently gives us more information about likely behavior than does a re-jiggering of the data to make the divergence go away. We know, for instance, that rich people are more likely to vote than poor people. We know that the rich save more, and can adjust spending more easily to offset wealth or income losses. We know that rich people buy more houses, and that this is more true than usual in the current market. We know that tax, spending and social policy since January, 2025 has favored the rich and actively disfavored the poor.
Re-jiggering sentiment data may be an interesting exercise, but what does it explain? Perhaps also important, what does it assume? Does it assume that there is no reason for consumers to be unhappy, so we’ll simply adjust away their unhappiness? Seems a bit disconnected from reality a bit “fresh water”.
The misogynist-in-chief has nominated Bill Pulte to replace Tulsi Gabbard as Director of National Security:
https://www.yahoo.com/news/politics/articles/trump-replaces-tulsi-gabbard-bill-175930435.html
Pulte already has two administration jobs, as FHFA director and chairman of Fannie and Freddie. The plan is for him to keep those job and run eighteen intelligence agencies. His degree is in broadcast journalism, his wealth is inherited, and his experience is in private equity and home building.
Roger Stone, convicted felon with ties to Russia, reportedly urged the misogynist to choose Pulte for the DNI role, not because of his intelligence expertise – he has none – but because he likes to cripple bureaucracies:
https://www.semafor.com/article/06/02/2026/stone-helped-trump-choose-an-unorthodox-new-intel-adviser
The goal, apparently, is to treat secret documents the way DOGE treated government employees; chuck ’em out without review or much thought. Hmmm… Why would Russia-buddy Roger want wholesale declassification of secret government documents?
Pulte has accused Lisa Cooke, Letitia James and Adam Schiff of mortgage fraud, with no apparent factual basis in any of these cases. He based his accusations on misrepresentation of confidential documents, in pursuit of political gain.
It’s up to the Senate now to decide whether U.S. national intelligence should be in the hands of a part-timer rookie who breaks things and uses power against political “enemies”, after having been recommended for the job by a guy who’s in bed with the real enemy.
More about the “inequality” explanation for low consumer sentiment –
If the divergence between consumer sentiment measures and consumer spending reflects the high level of spending among the well-off, then a downturn among the well-off could help narrow that divergence by lowerin spending.
Well, the earnings yield on the S&P500 is now at 1.03%, by this estimate:
https://us500.com/tools/data/sp500-dividend-yield
That’s the lowest yield on record, with the previous low at 1.17 in 1999 (ruh roh!). This is a new low even for the high-flying, “this time is different” post-Covid-recession period.
So maybe big spenders are gonna wanna rethink their spending soon?
Off topic – tidbits from the latest USDA crop reports. The news is mostly bad, and inflationary, even when it’s good:
U.S. Wheat Stocks Down with Crop at 54-Year Low
“USDA, National Agricultural Statistics Service forecast winter wheat production to be the smallest since 1965/66…”
“With acreage for Durum and Other Spring wheat also down this year, U.S. all-wheat production is forecast at the lowest level since 1972/73. U.S. wheat exports are forecast down 135 million bushels year to year to 775 million…”
https://www.ers.usda.gov/topics/crops/wheat/market-outlook
Global Coarse Grains To See Lower Supply, Higher Use in 2026/27
“On net, 2026/27 global coarse grains production is expected to fall 18 million MT to 1,589 million MT. Global coarse grains use, meanwhile, is expected to increase marginally (up 7 million MT) to 1,608 million MT.”
https://www.ers.usda.gov/topics/crops/corn-and-other-feed-grains/market-outlook
Some good news for soy farmers, but not for you:
U.S. Soybean Crush Is Forecast to Reach a Record High
“U.S. soybean production for the 2026/27 marketing year (MY) is projected to climb by 4 percent to 4.4 billion bushels, based on higher planted area and trend yield. The yield forecast of 53.0 bushels per acre is based on a weather-adjusted trend model and assumes normal weather.”
This better news is – what do you know? – due to the Iran war:
“U.S. soybean crush is forecast to reach a record 2.75 billion bushels, on favorable crush margins and strong demand for soybean oil as a feedstock in biomass-based diesel production.”
Favorable crush margins? That’s high prices, in plain English. Why? Because diesel is so expensive that biofuel demand is way up.