Catching up with the news overseas, China downside surprise:
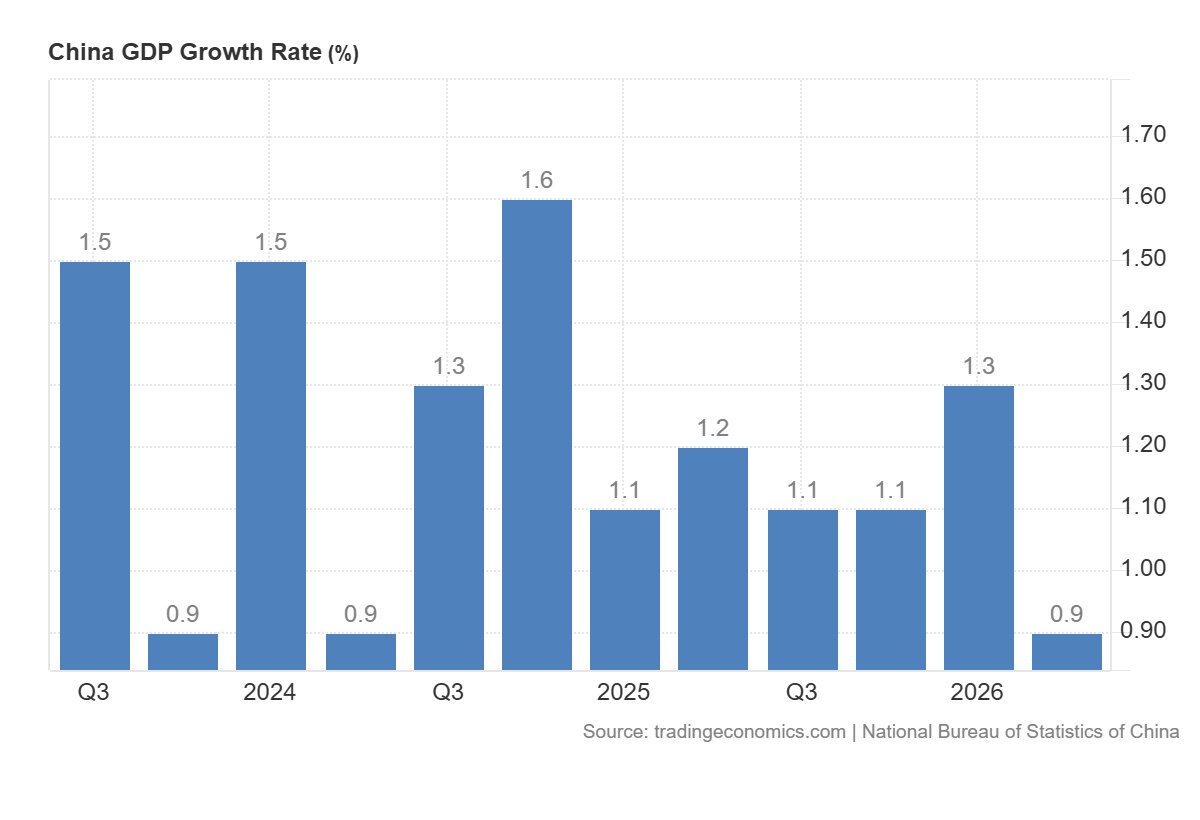
Goldman Sachs on the official statistics:
China’s real GDP growth slowed to a weaker-than-expected 4.3% yoy in Q2 from 5.0% yoy in Q1, below market consensus and our forecast (4.5% yoy). Although Q2 real GDP growth fell below the lower bound of this year’s growth target (4.5-5.0%), average growth in H1 was 4.7% yoy. In sequential terms, NBS estimated that real GDP growth moderated to 0.9% qoq sa non-annualized in Q2 from 1.3% qoq sa non-annualized in Q1, consistent with market consensus and our forecast (0.9% qoq sa non-annualized). We believe the combination of weaker-than-expected year-on-year growth and in-line sequential growth stems from the NBS revisions to historical sequential growth estimates.
This drop in growth occurred despite high levels of exports. From WSJ:
The weak GDP figure reflects the vulnerability of China’s two-speed economic model, which increasingly relies on exports to drive growth. Though exports surged 27% in June, it couldn’t make up for a 5.7% decline in fixed-asset investment in the first half of the year and stagnant retail sales growth.
Looming over the economy is a real estate slump that has erased household wealth and weighed on consumer and business sentiment. Property investment alone declined 18% in the first half of the year compared with the same period in 2025.
Weak domestic demand means that many of China’s manufacturers have to look outside the country for growth. China’s monthly car exports, for example, surged past 1 million in June for the first time, while domestic car sales sank 23%, falling for a ninth straight month.
See also NPR.
There’s a question out there whether growth is actually lower than reported (see oped here; Scissors at AEI wonders about the H1 deflator). The seeming ease with which China dealt with a shortfall in oil imports is consistent with a view of substantially slower growth; however, I’d await a more systematic assessment before declaring a catastrophic decline in economic growth. The SF Fed’s China CAT — which relies upon Chinese import data — show slower growth than official, at least through 2025Q4 (accessed 7/17).
In its July WEO, the IMF projected 2.9% q4/q4 growth for 2026, with 4% for China, 2.3% for the US. Using nominal GDP weights in USD, 2% Chinese would imply a reduction to 2.57% world growth (in an accounting sense).
Annualized 0.9% growth is 4.1% annualized, give or take. If net exports are up sharply, then domestic demand can’t be far from flat.
Investment fell despite all China’s AI hubbub? Seems odd given that AI hububb is what’s keeping U.S. output growing. To some extent, China’s ivestmwnt problem is that residential construction continues its long collapse. Seems like the falling knife phenomenon is keeping households and investors away; nobody wants to buy an asset with declining financial value. A question I haven’t seen addresses is whether China is under-housed. At some point, the financial value of housing stock becomes a side issue, if people want more homes than are available.
Of course, a major problem with housing demand is low household formation. Few young people, few jobs, few children => few new households. Could be the housing sector has problems other than the bubble, though Japan and the U.S. have both shown that recovery from construction bubbles takes forever.
Seems like, if there is any scarcity of housing, it’s in China’s “first-tier” cities, because so much of the speculative boom was in “second-tier” cities:
https://www.uschina.org/articles/understanding-chinas-housing-downturn-and-the-path-ahead/