The Bureau of Economic Analysis announced today that seasonally adjusted U.S. real GDP grew at a 1.5% annual rate in the second quarter. That is about half of the historical average growth of 3.1% and continues a record of slow growth over the last three quarters.
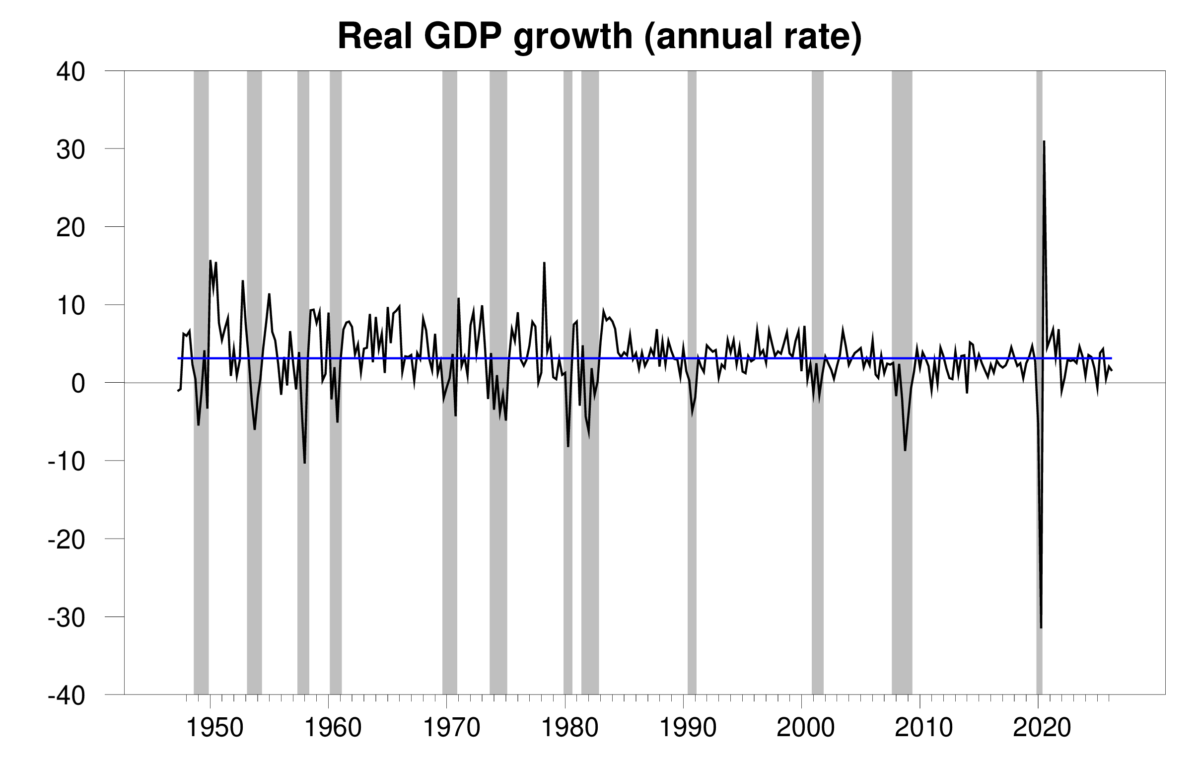
Quarterly real GDP growth at an annual rate, 1947:Q2-2026:Q2, with the historical average since 1947 (3.1%) in blue. Calculated as 400 times the difference in the natural log of real GDP from the previous quarter.
The new numbers put the Econbrowser recession indicator index at 7.0%, about where it was last quarter.
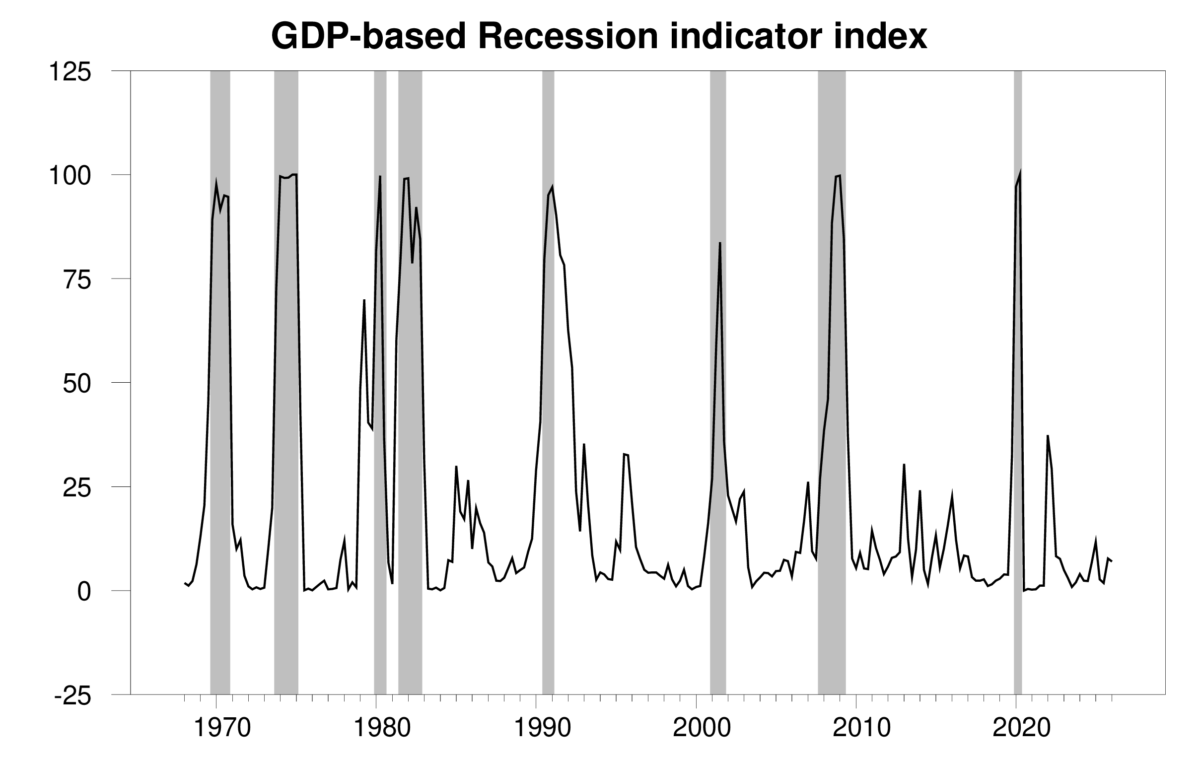
GDP-based recession indicator index. The plotted value for each date is based solely on the GDP numbers that were publicly available as of one quarter after the indicated date, with 2026:Q1 the last date shown on the graph. Shaded regions represent the NBER’s dates for recessions, which dates were not used in any way in constructing the index.
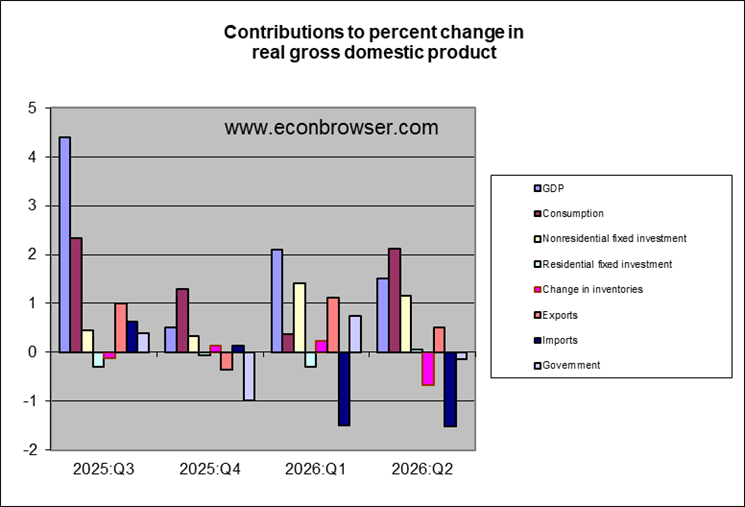
Some patterns from the previous quarter were repeated. Nonresidential fixed investment, in part propelled by spending for AI infrastructure, contributed significantly to the Q2 growth. But many of these components were imported, so the net contribution to U.S. GDP — which measures production of new goods in the United States — was more muted. Consumption spending was strong, with some sales being met by inventory drawdown.
I continue to be concerned about events in the Strait of Hormuz, and confess to being a little mystified by the big daily jumps up and down in oil prices in response to rumors of a settlement. I see conflict in the Middle East as an ongoing unfavorable factor for U.S. real GDP growth and inflation.
I’m so old I can remember when Kevin Hassett was projecting GDP growth “north of 6%” — all the way back in ancient May, 2026. Maybe he was holding his compass upside down.
Kevin in 1999 told us the DOW would hit 36000 in a couple of years. How did that work out?
If AI bubble bursts, Kevin could be right.
I suspect low inventories amplify petroleum price swings. I’d also hazard that algorithmic trading has become a bigger share of overall trade volume because headlines are now so important, and algorithmic trading can boost volatility – just a guess. However, if Professor Hamilton is mystified, then I’ll go for mystified.
Slice another million barrels per day off of oil exports:
https://oilprice.com/Latest-Energy-News/World-News/Caspian-Oil-Pipeline-Shuts-Down-Again-After-Black-Sea-Drone-Attack.html
Kazakhstan’s export terminal is back off line, cutting exports from an average of 2.1 million bpd to around 1 million. Looks like this terminal will now be a regular target of Ukrainian drone strikes.
All I hear from Bloomberg commentators is that the “economy” is “GREAT!”….1.5% annual is great?
Agree with your last statement. even more importantly, I am quite surprised that oil is remaining sub $100 for the most part. considering the straight will be closed for going on half a year, I would have expected oil to be stubbornly above $100 by now. but the world around me is operating as though there is absolutely no physical scarcity now or on the horizon. something is not right, but I don’t know if it is me or them!
Is it possible that the scarcity is in final refined products – not the crude oil to make it. The only ones to purchase crude are those who have the free refining capacity to turn it into refined products. And refineries are from my understanding notable to just take any crude from anywhere.
If refining capacity is limiting the rise in oil prices, the the crack spread should be wide – too little refined product relative to crude oil. And what do you know? The crack spread is massive, even higher than during Russia’s 2022 attack on Ukraine:
https://rbnenergy.com/market-data/3-2-1-crack-spread.
As Krugman recently pointed out, gasoline prices now are consistent with oil at around $140 per barrel, at a normal crack spread.
Also worth noting is that crack spreads differ across regions, though all are elevated:
https://en.macromicro.me/charts/54240/ue-eu-asia-gasoline-gasoil-diesel-jet-fuel-crack-spreads
I need to do some thinking about the differences.
Politico has an interesting article about the fact that we are operating all refineries at full capacity:
https://www.politico.com/news/2026/07/31/oil-refining-limits-prices-high-01020385
They note that: “high operating rate leaves little room for operational disruptions, even as refiners have delayed scheduled maintenance and hurricane season looms”. I guess hope and pray – or maybe Trump can get his magic marker out and change the directions of the hurricanes
What is meant by full capacity?
“Woods said he had “never seen” the world’s available refining capacity as low as it is today relative to demand. Iran’s closure of the Strait of Hormuz has removed 3 million barrels per day of refining capacity, while China and Russia have limited product exports, the latter because of a sustained Ukrainian bombing campaign on its refineries. In all, at least 5 million barrels a day of capacity was offline, Woods said.”
If both wars ended today, capacity would increase.
China had a sanction evading scheme going where they purchased crude from Iran and refined it in China – then sold refined products in south east Asia. That capacity is currently idle (because it’s calibrated to crude that is not available) – it could be switched on as soon as Hormuz opens.
Russia is a different story. Their refining capacity will not recover until many months after Ukraine stops hitting them.
Recovery will come if Trump declares victory and run away – but it will be a slow and bumpy ride.
I think the crude market is very jittery because they realize that if Hormuz opens there may be an over supply of crude – particularly relative to refining capacity in the short term.
I would not invest in new refining capacity. This whole mess has made a lot of countries aware of why they need to accelerate the switch to EV transportation and renewable energy.
Both things can be true. Crack spreads are high but so are oil prices. Of course Bruce Hall is happy that gasoline only costs $2 per liter.
Eh…..its been around 100$$ for days now, clearly a foundation. The releases in March will keep up enough to mid August then that runs out at that point prices will surge and gas lines will start forming around the world by September. Its a very fast process frankly. I think long term damage to production is looking likely.