Michigan final sentiment and Conference Board confidence near pre War levels. But still 2.2 to 2.4 standard deviations below pre Trump. Gallup confidence 1.1 standard deviations below.
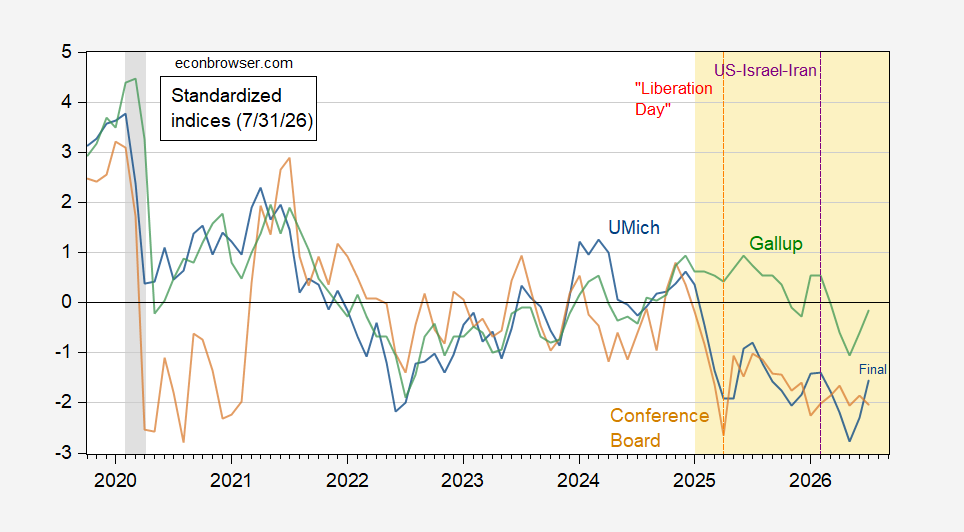
Figure 1: U.Michigan Economic Sentiment (blue), Conference Board Confidence Index (brown), Gallup Confidence level (green), all demeaned and divided by standard deviation 2021M01-2025m02. Orange dashed line at “Liberation Day”, purple dashed line at US Iran war start. Source: UMichigan, Gallup, Conference Board, and author’s calculations.
The rebound is — visually at least — seemingly driven by gas prices.
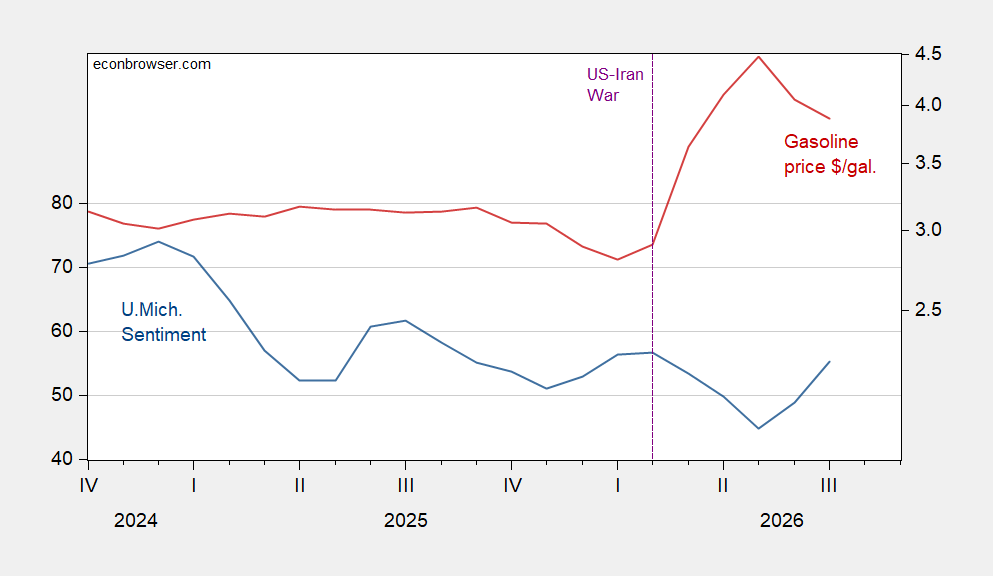
Figure 2: U.Michigan Consumer Sentiment (blue, left scale), price of gasoline, $/gallon (red, right log scale). Source: U.Michigan, EIA, and author’s calculations.
Ohio Rep. Max Miller’s reelection bid faces questions after domestic abuse allegation
http://www.yahoo.com/news/politics/articles/ohio-rep-max-millers-reelection-125202172.html?bcmt=1
Isn’t JD Vance also a Republican from Ohio? Miller sounds like a MAGA kind of man. I wonder if he also eats the neighbor’s cats for dinner.
Off topic – AI sentiment and interest rates. Here’s a picture of the Philadelphia Semiconductor total return index, along with the 10-year yield:
https://fred.stlouisfed.org/graph/?g=1XMVv
There are plenty of reasons for the AI stock boom to have stumbled. And the Philly index is not just AI, but it’s as close as FRED can get us.
The question I think this picture may answer is why the AI boom stumbled when it did. Most of the reasons for AI stocks to pull back have been known for some time; the puzzle for sceptics is why the boom persisted for so long. As the picture shows, long-end yields began to climb in March, and there was a stall in the Semiconductor index. More recently, 10-year yields began to climb in late June, at which point a rather decisive slide in the index began.
I’m not saying that letting some of the air out of the AI boom is a good thing or a bad one, just trying to figure out the mechanisms at work. If the AI boom had to stumble, then getting the stumble underway sooner rather than later is probably a good thing for the economy as a whole.
Deflating bubbles do tend to be destabilizing, so we’re probably in for some spill-over. The wars, with their widening suppression of oil and gas supplies, are the bigger problem. The AI slump comes on top of that, and is pretty clearly spill-over from the inflationary hit from oil.
Off topic – mortgage rates
Bill McBride’s latest email reviews the latest monthly data on GDE portfolios, with helpfrom Tom Lawler. Here’s something I found interesting”
“The combined Agency MBS holdings of Fannie Mae and Freddie Mac declined by $505 million in the three months ending in June, after increasing by $45.118 billion in the three months ending in March of this year.
“The increases in the GSEs’ MBS holdings so far this year are a far cry from the $200 billion of GSE MBS purchases implied by President Trump’s January 8th post…”
So, interesting from a housing market perspective, but also from the broken promises perspective. The felon-in-chief does this all the time. He briefly takes an interest in some issue the public cares about, pulls some gigantic number out of his backside in promosing to “do something”, and then does nothing.
A $200 billion purchase of MBS might not do much to lower mortgage rates, but it would do more than nothing.
Here’s the 30-year mortgage rate since January:
https://fred.stlouisfed.org/graph/?g=1XMY2
Up about 60 basis points from the low in March. Suspiciously, March.
Purchasing that does nothing because the market is fundamentally out of whack. Prices and sales will have to fall. Builders pushed too hard and stockpiles will be late 2000’s bad by next year. Financial manipulation rather than financial stability vs the new deal era is the key difference most people do not get. The latter is a system of stability with little debt. The GSE model is driving mortgage debt sky high. Its why when the GSE’s came in 1970, the bubbles began.
“Purchasing that does nothing …”
Nothing? That’s a ridiculous claim. Your own assertion that GSEs cause bubbles is an admission that GSE purchases matter. Can’t both matter and not matter. Pick one.
Now, about that “late 2000’s bad” claim – based on what? Got any data? Some ratio we can look at? Anything? Eager to be enlightened.
“Builders pushed too hard:” https://www.macrotrends.net/1314/housing-starts-historical-chart doesn’t look much like it from this graph. “stockpiles will be late 2000s bad…” FRED (https://fred.stlouisfed.org/series/ACTLISCOUUS) doesn’t show that houses on the market have been high relative to the last 10 years, and going back farther – https://ycharts.com/indicators/us_existing_home_inventory – it would appear home inventory is relatively low compared to most of the last 30 or so years despite the population having grown, and is less than half of the “late 2000s bad” levels.
In general i dont see an oversupply. Maybe some people overspent recently. But it does not seem to be a boom/bust like a couple decades ago. At least not in texas. Prices may fall from interest rates or recession though.