In 2025, about half of observed consumption, according to Bigot and Espic (BdF):
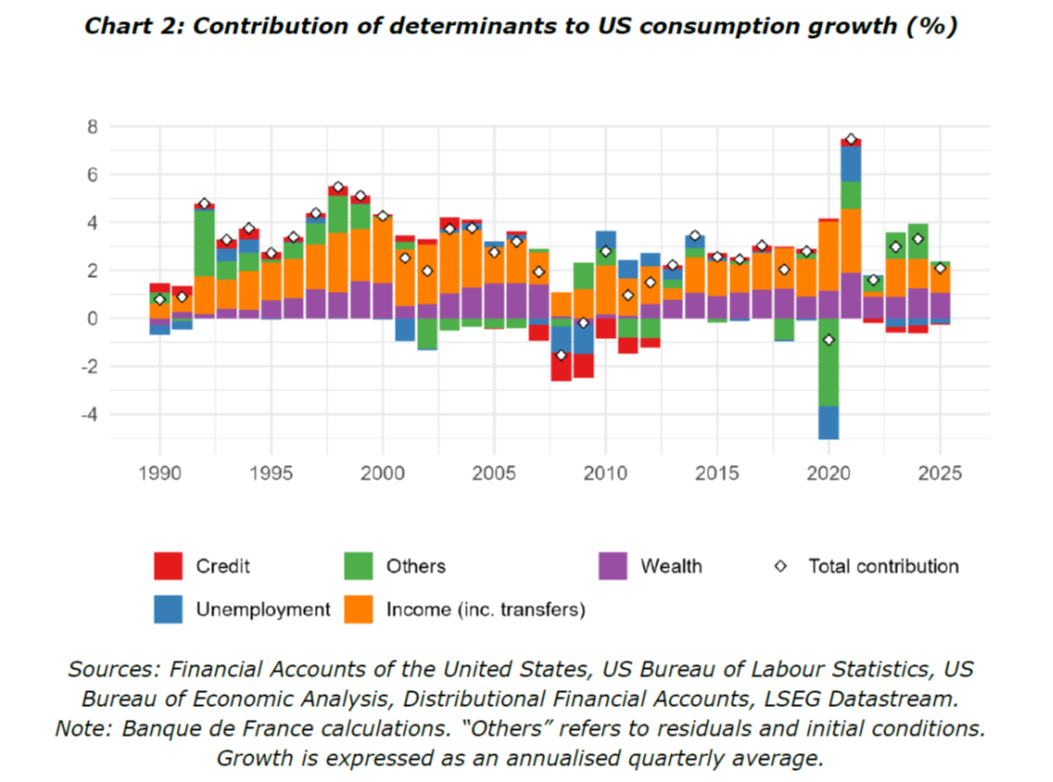
Source: Bigot and Espic (2026).
The estimates rely upon work by Beach, Gamber and Moran (2025) at the Federal Reserve Board, disaggregating by income groups.
Hence, in order to predict consumption, follow wealth — in particular equity wealth.
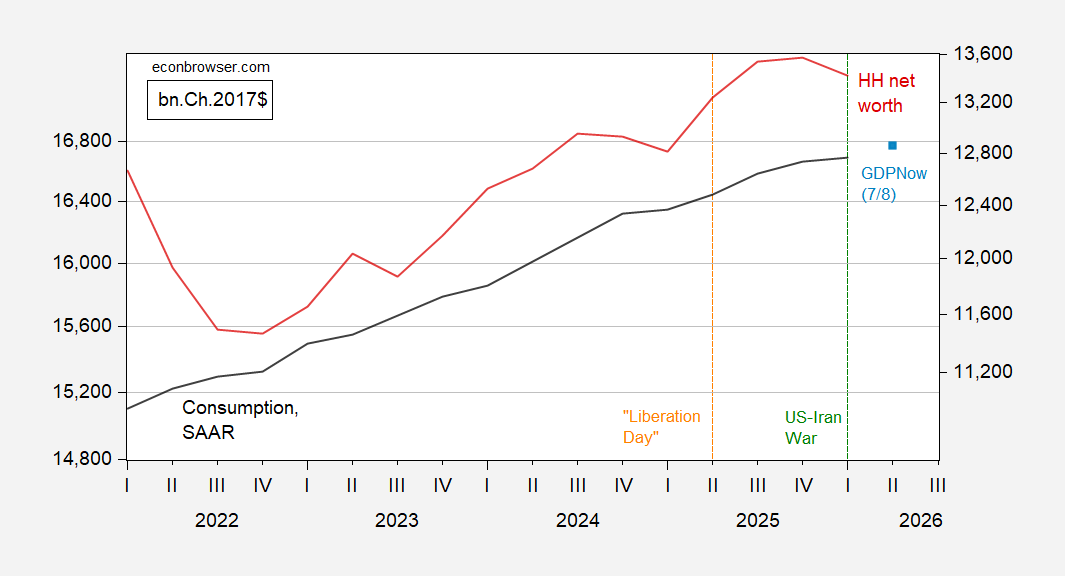
Figure 1: Consumption (bold black, left log scale), GDPNow estimate of 7/8 (light blue square), both in bn.Ch.2017$ SAAR; household net worth in bn.Ch.2017$ (red, right log scale). Both series deflated by PCE deflator. Source: BEA, Atlanta Fed, Federal Reserve Board Flow of Funds, and author’s calculations.
The nowcast indicates 2% q/q AR growth in consumption in Q2; we don’t have net worth in Q2, but based on the rise in the SP500, I’d guess 2.1% growth in net worth. Q1 PCE deflator inflation was around 0.8% , suggesting a 1.3% increase in net worth (q/q not AR).
For now, consumption growth seems intact, albeit slowing.
Off topic – felons gotta felon:
https://www.bbc.com/news/live/cwy30p89rlgt
The felon-in-chief has announced that the U.S. will begin collecting protection money on cargo through the Strait of Hormuz (all cargo, as far as I can tell). His demand is 20%, maybe something he picked up from mobster movies? Iran was demanding a particular amount per tanker (only petroleum to be taxed, as far as I can tell), which at $60/bbl on a supermax would run to under 2%.
This is, of course, a violation of “freedom of the seas”, which has been a central tenet of the post-WWII “Pax American” system. The felon isn’t one of us. He’s the thing that the U.S. and the West has worked to banish from the world since 1945, at the very latest. We elected him, knowing what he was. That’s who we are.
And on a related front, tanker traffic through Hormuz has only been averaging about 50% of “normal” over the last few weeks and much less the last few days. On 8 July, only 5 outbound ships were tankers; pre-war the number was more like 15-20. Yesterday it was 1. Total outbound been bouncing around 15, very roughly, with a high of 35 on July 7, compared to a pre-war of 30-40. So we are looking at a perhaps 50% open strait, mcuh less so since the bombing started – pushing off the end times from late July to mid-August, I suppose.
https://insights.windward.ai/
https://hormuzstraitmonitor.com/
AI stuff:
Pre-War Daily Tanker Distribution:
The daily outbound energy fleet was broadly split into three distinct vessel types to move the region’s 19.45 million barrels of oil and extensive gas supplies:
Crude Oil Tankers (15 to 20 daily transits): This segment was heavily dominated by Very Large Crude Carriers (VLCCs) and Suezmax vessels. Because a single VLCC can carry roughly 2 million barrels of crude oil, it took fewer individual ships to transport the majority of the region’s raw crude exports.
Product and Chemical Tankers (15 to 20 daily transits): These smaller, more numerous vessels carried refined petroleum products like gasoline, diesel, jet fuel, and naphtha from Gulf refineries.
Liquefied Gas Carriers (5 to 10 daily transits): This included highly specialized Liquefied Natural Gas (LNG) and Liquefied Petroleum Gas (LPG) carriers, primarily servicing Qatari and UAE gas fields.
Krugman points out an interesting thing about crude and gasoline prices today. There is a crunch on refining capacity because of Ukraines targeting of Russia’s infrastructure. Russia used to export refined products; now they are importing. Yesterday ISW pointed to the potential for such shortages that Russian farmers cannot get fuel to harvest their crops. Adding fuel to that fire, Russia has been targeting Ukraines agricultural exports (not sure Putin can think more than one step ahead).
OK, so now the felon-in-chief isn’t going to demand a 20% vig for using Hormuz:
https://www.aljazeera.com/news/liveblog/2026/7/14/iran-war-live-us-launches-more-attacks-trump-orders-blockade-in-hormuz
Apparently, somebody (bin Salman?) explained to him how that wouldn’t be good. Now, he plans to grab a microphone on Thursday and tell us…something. Probably that he won the 2020 presidential election big time and that Iran is full of big dummies and about how he can flatten Iran with a wave of his big, big hand. Maybe how he’s not at all reminded of his own mortality by Lindsey and Mitch.
Brent is up 10% from a week ago.
Off topic -Crack spreads:
https://fred.stlouisfed.org/graph/?g=1X3rz
The picture isn’t exactly of crack spread, but rather of gasoline vs WTI. Crack spreafs are more complicated, but the picture gives a rough idea. How is it that, when input prices have suddenly jumped because of policy mistakes, margins on finished goods are near a record level? Well, monopoly pricing onviously. Oil majors simply pass the risk of future high input prices along to consumers, while boosting their own short-term profits. In a competition market, this would not be possible. In a monopolistic market, it’s easy as pie.
By the way, oil majors were among the biggest contributors to the felon-in-chief’s re-election campaign. In case you were wondering.
Consumption tends to be persistent. Consider “figure 1”, which is the second figure in this post. It shows consumption to be more smooth than household net worth. Household net worth drives consumption, but so do planned spending and income, so consumption is smoother than net worth. With net worth falling as a result of bad policy, consumption may also fall, but only if net worth continues to fall – that is, if policy errors continue.