On Monday, Justin Ho on Marketplace had a piece on producer prices. He covered several interesting questions, including the implications of a PPI rising faster than the CPI:
That added pressure [from higher input prices] puts businesses in a tough spot, according to Matthew Miskin, co-chief investment strategist with Manulife John Hancock Investments.
“They either get lower profit margins, or they have to pass this on to consumers,” Miskin said. “And the question becomes, ‘Can consumers take on that higher price point?’”
That’s why inflation at the producer level can eventually hit consumers — especially for groceries, toothpaste, and other consumer staples.
“These are very low-margin businesses, so they don’t have that much wiggle room to not pass the price on,” Miskin said.
The PPI is less well understood than the CPI, so it bears repeating that there are many PPIs — for different commodities and for different stages of production. The most commonly reported is the PPI for final demand (PPIFIS, PPIFES for total, core). BLS provides a primer on some misconceptions regarding the PPI. Even looking at final demand PPI, the coverage and weights differ. Shelter is one big component of CPI not in PPI.
Here’s a plot of the time series for core CPI ex-shelter and core PPI, which should in some sense be similar in coverage.
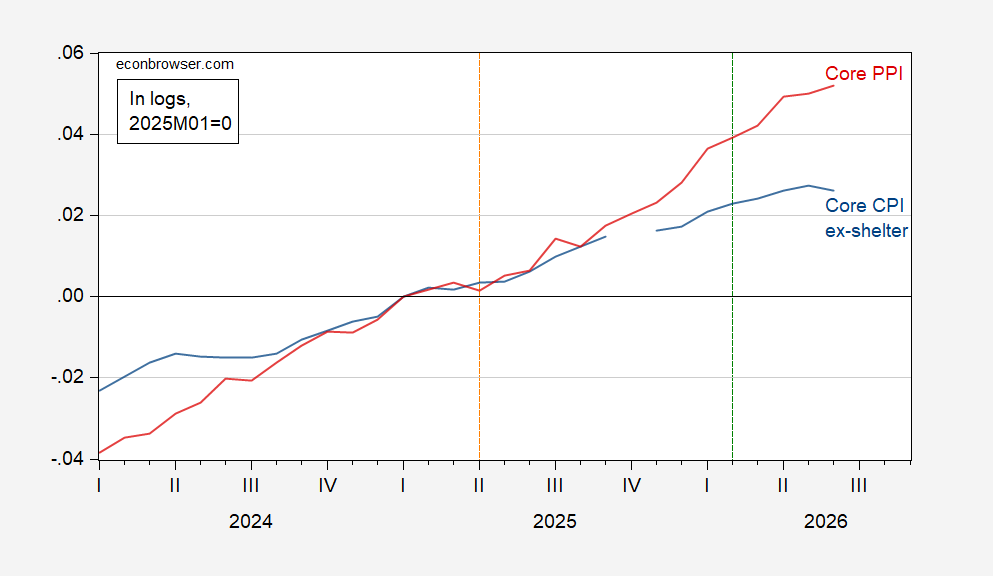
Figure 1: Core CPI ex-shelter (blue), for core PPI (red), in logs 2025M01=0. Source: BLS via FRED.
PPI has been trending upwards faster than CPI for a long time (i.e., PPI inflation exceeds CPI inflation). This would seem to have implications for firms’ price-cost margins over the long term, except for the fact that coverage still differs at this level — in particular import prices are not included in the PPI (which measures prices received by domestic firms). This point is hghlighted in a recent Royal Bank of Canada memo:
If PPI is rising faster than CPI, this suggests that producers’ prices are rising faster than consumer prices. For example, a commercial baker may charge more for bread if wheat prices rise, but a neighborhood café that purchases bread from the bakery may not adjust menus reflect higher prices.
If we see PPI exceed CPI for a prolonged period of time, then end-stage sellers are likely to raise prices; otherwise it could spell trouble for corporate profit margins.
Clearly, because of compositional issues, that logic doesn’t work for levels, but might work for changes in PPI and CPI inflation rates.
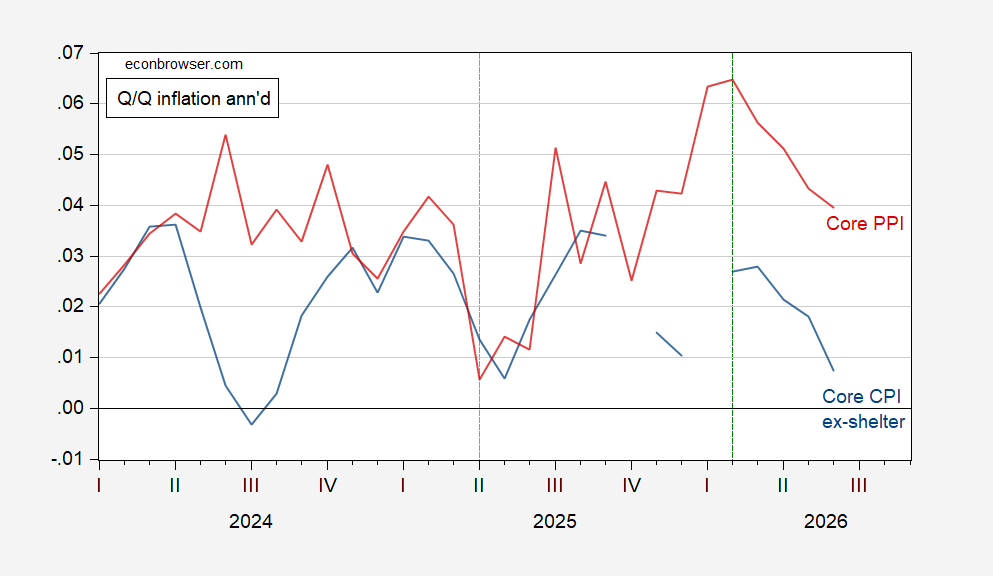
Figure 2: Three month annualized inflation rates for core CPI ex-shelter (blue), for core PPI (red). Source: BLS via FRED.
Core PPI is rising faster than core CPI ex-shelter on Q/Q — so this suggest compression of price-cost margins — excepting the role of imports… and labor costs.
There is a direction of corporate profits measure that comes from the PPI — final demand trade services (compares retailer selling and acquisition prices, for domestic producer prices):
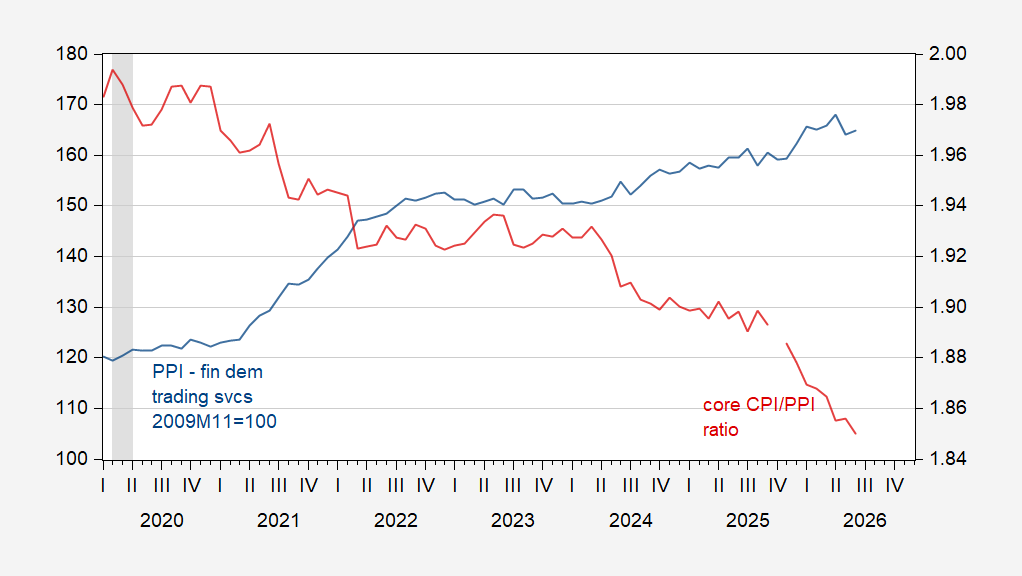
Figure 3: PPI – final demand trading services (blue, left scale), ratio of core CPI ex-shelter to core PPI (red, right scale). NBER defined to peak-to-trough recession dates shaded gray. Source: BLS, NBER, and author’s calculations.
There is a rough (inverse) correlation, but it’s not tight, particularly over the past year.
To the extent that some PPI is predictive of the future trend of some CPI, then the downward divergence of core CPI/core PPI in figure 3 points to upward pressure on CPI.
We are still engaged in an experiment to see whether tariffs represent a one-time lift to prices, or a presistent lift to inflation due to reduced efficiency. Petroleum, fertilizer, LNG, aluminun and other products are again bottled up in the Persian Gulf. Fed’s gonna raise rates.
Off topic on the oil markets. ISW reports (https://understandingwar.org/research/russia-ukraine/russian-offensive-campaign-assessment-july-15-2026/) that the attacks on Russian refineries have cut their refining capacity in half. Interestingly, they may have slightly increased their exports of crude oil even as their export of refined products has been drastically reduced (or banned).
Further strains on world markets for refined products comes from the reduction in China’s sanction evading trade with Iran. China purchased crude from Iran, refined it, and sold the refined products to other countries in Asia. China has plenty of refined products for their domestic markets (without dipping into their reserves), but their former customers are in bad shape.
So the price of crude oil may not truly reflect the strains on world markets and supply of refined products.
Off topic – How China hopes to tackle low returns to AI investment:
https://chinapolicy.substack.com/p/beijing-pulls-capital-back-toward
The article is about much more than that – Marxism with Chinese characteristics and 5-year plans and the like; interesting, but not new. What is new is what it says about a change in thinking among China’s economic planners. After 2 years of AI-for -AI’s sake, which has gone pretty well, planners now want to bend AI spending toward industrial uses. The same for finance – bend it toward service to industry.
My naive impression is that Chinese planners are asking the same basic question as users in the U.S. – how’s this AI stuff gonna pay for itself? (Unlike China, we are not asking whether finance has become a drain on society.) Instead of just build, build, build, and hope to find uses, practical integration of AI into business processes is increasingly the focus.
Success in harnessing AI to Chinese industry – assuming “industry” means goods production – will mean more exports and more disinflation. Seems like any policy Chinese planners setrle on means more exports and disinflation.
Speaking of inflation, in response to renewed U.S. bombing, Iran is again threatening closure of Bab el Mandeb, the southern exit from the Red Sea:
https://www.reuters.com/world/middle-east/after-hormuz-iran-turns-red-sea-gateway-new-pressure-point-2026-07-14/
There is also a suggestion that Iran may target the port at Yanbu, which exports 2.0 to 2.5 million bpd of Saudi oil via the Red Sea.
Since 2022, Saudi Arabia and Yemen’s Houthis have been in a ceasefire, violated recently when the Saudis bombed the airport in Sanaa. Odds are, Saudi (U.S.?) bombing would resume if Houthis shut down Bab el Mandeb. Could be, that’s why the Houthis didn’t get involved in the earlier closure of shipping.
So Kudlow’s thesis that US wholesale distributors will bear 100% of the tariffs has new life?