Industrial production below consensus (+0.2% m/m vs. +0.3% Bloomberg), manufacturing at consensus, although previous month’s revised up. Output measures continue to outpace employment.
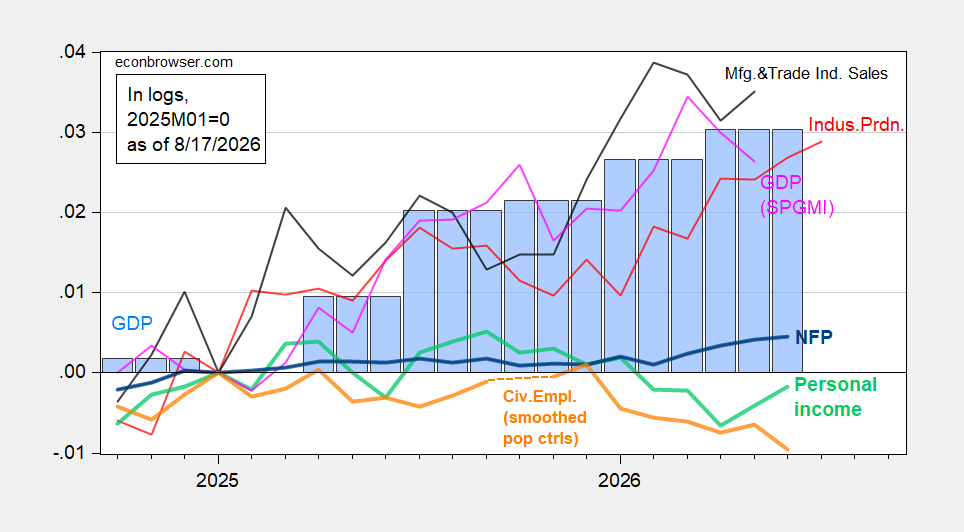
Figure 1: NFP employment (bold blue), civilian employment with smoothed population controls (bold orange), industrial production (red), personal income excluding current transfers in Ch.2017$ (bold light green), manufacturing and trade sales in Ch.2017$ (black), and monthly GDP in Ch.2017$ (pink), GDP (blue bars), GDPNow nowcast of 7/10 (light blue box), all log normalized to 2025M01=0. Source: BLS via FRED, BLS, Federal Reserve, BEA 2026Q1 advance release, S&P Global Market Insights (nee Macroeconomic Advisers, IHS Markit) (7/1/2026 release), and author’s calculations.
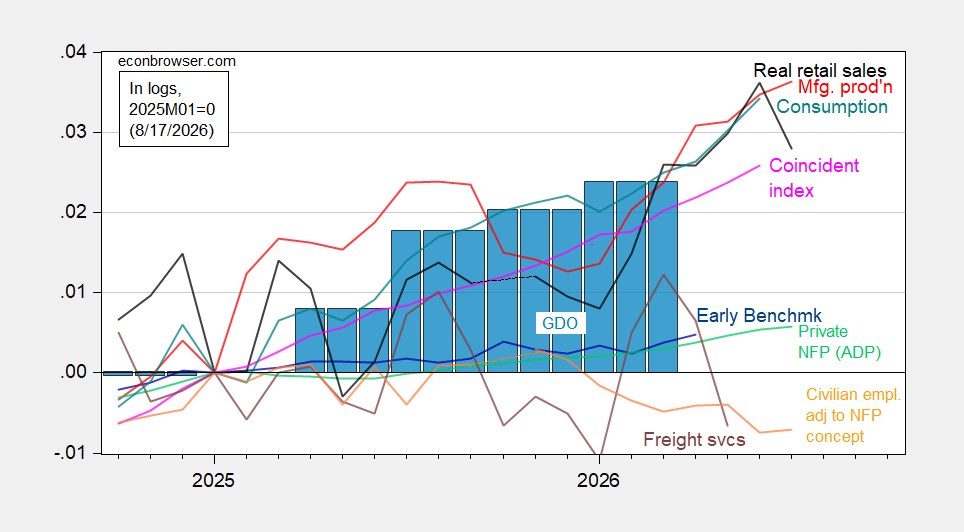
Figure 2: Civilian employment adjusted to NFP concept smoothed population controls, using experimental controls for 2025 (bold orange), manufacturing production (red), ADP private nonfarm payroll employment (light green), real retail sales, CPI deflated (black), freight services indexes (brown), and coincident index in Ch.2017$ (pink), GDO (blue bars), all log normalized to 2025M01=0. Source: BLS, ADP via FRED, Philadelphia Fed, Bureau of Transportation Statistics, Federal Reserve via FRED, BEA 2026Q1 3rd release, and author’s calculations.
GDPNow is currently nowcasting 4% q/q AR growth (2.3% for GS), but “core GDP” (final sales to private domestic purchasers) is tracking much slower growth, 2.6% growth q/q AR (compared to 3.9% in Q2 (prelim.)).
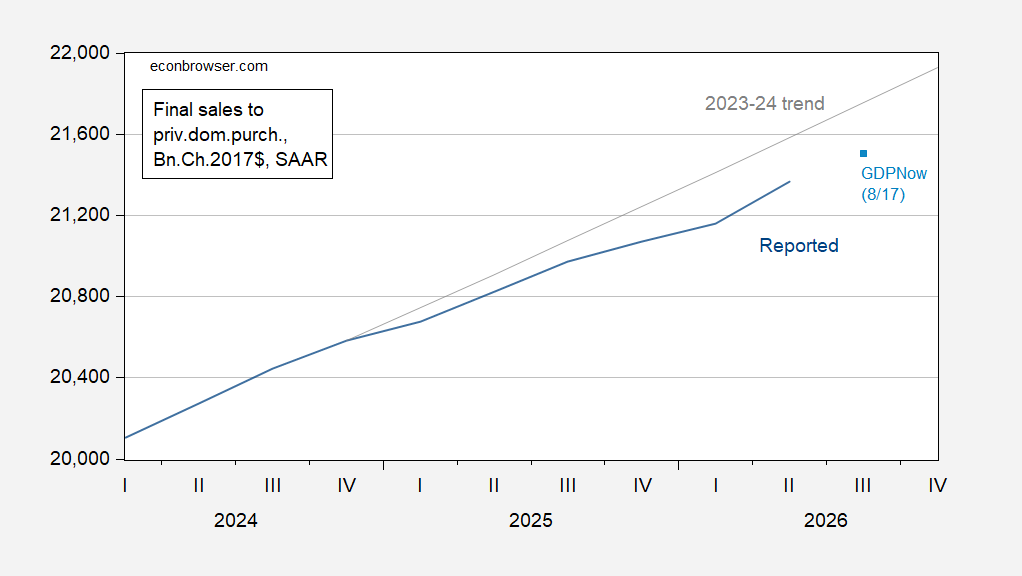
Figure 3: Final sales to private domestic purchasers (blue), GDPNow implied (light blue square), and 2023-24 stochastic trend (gray), all in bn.Ch.2017$ SAAR. Source: BEA, Atlanta Fed, and author’s calculations.
I don’t wanna say this smells of panic, but…
https://home.treasury.gov/news/press-releases/sb0607
Treasury has announced an increase in buybacks of long-end debt, buying at least $4 billion in each round, rather than the $2 billion announced just 16 days ago. Tens are down about 5 basis points from yesterday’s close, bonds down 9 bps.
Note, however, that the 2-year yield is up 2 bps, fives up 1 bp. No free lunch. This is a curve flattening effort, not lower yields across the curve. Treasury funds every buyback with increased sales at some other maturity.
The buyback is a tacit admission of bad policy. Long-term yields had reached a 2-decade high because of tariffs, the Iran war and tax cuts – all policies if the felon-in-chief and Congressional Republucans. Twisting the curve may lower long-term rates a bit, but probably won’t lower overall Treasury borrowing costs. Roll-over risk is increased by shoving more debt into the short end; I guess that’s some other guy’s problem. Mortgage rates will come down, and maybe that’s the idea.
Wonder when johnny will tell us interest rates don’t matter?
This is why they want control of the Fed. As you say Treasury can only bend the yield curve, and to a fairly limited extent. The Fed is currently buying $10 billion per month of treasuries. If they doubled their purchases and shifted it towards the longer end, that could really bring down mortgage rates – or create a financial panic.
Sorry, but no. The Fed can’t lower long term rates just buy useless “buying”. That would cause even a greater flight as seen in the past. Macro needs to learn how trading works in a ” pad” era. People bet on the trades. Its why temporary moves are made like that.
The Fed demonstrably lowered long-term rates by buying Treasuries during the period of portfolio expansion. There’s no real doubt about that. You got that bit wrong.
However, Fed buying and Treasury buying are two different things, and the issue now is Treasury buying. You got that bit wrong, too.
There is apparently an inflationary impact from Treasury’s announcement of more long-end buybacks – the dollar is weaker. The inflationary impact won’t be large, but the irony is pretty good – a bunch of inflationary policies drive up long-end yields, so Treasury tries to pull down long-end yields and causes more inflation.
By the way intervention to boost the yen, to the extent it’s successful, is also inflationary for the U.S.
Just a reminder – it’s not just U.S. long-term yields that have risen:
https://fred.stlouisfed.org/graph/?g=1XTJH
It’s mostly U.S. policies that have caused the rise, but the rise in yields is general.
OK, one more. Investors are herd animals. If AI is in favor, that’s all many investors need to know; investing is a Keynesian beauty contest, after all. Treasury’s decision to intervene in its own debt only draws more attention to the effect of rising interest rates on highly indebted countries’ finances. Here’s a list of countries by debt-to-GDP ratio, as a guide to which countries are under most pressure:
https://en.wikipedia.org/wiki/List_of_countries_by_government_debt
Remember, U.S. policy is the biggest cause of rising interest rates right now. We’re making friends left and right these days.
I lied. Here’s yet another comment related to Treasury’s announcement of increased long-end buybacks.
Krugman is out with a piece on the rise in U.S. interest rates, with the message that the U.S. is unlikely to suffer a debt crisis. He offers two bits of evidence. One is that the U.S. issues debt in dollars, so never has to default. The other is that the 30-year inflation breakeven is quite stable despite the recent pick-up in inflation:
https://paulkrugman.substack.com/p/what-are-bond-markets-telling-us
A comparison of 5-year and 30-year inflation breakevens tells a pretty clear story. The 5-year inflation breakeven rate jumped around the time of the grifter-in-chief’s inauguration and has been above the 30-year breakeven most of the time since then. That’s a pretty clear indication that market participants see inflation risk as elevated now and for a while longer, but then receding:
https://fred.stlouisfed.org/graph/?g=1XTP4
So, breakevens do support the notion that we aren’t facing a debt crisis, and also that current policy is more inflationary than is likely to be the case in the longer term.
Recently, the 5-year rate has fallen back to near the 30-year rate, for which I have no explanation.
One more comparison which kinda supports Krugman’s claim that we aren’t facing a crisis – at least, that crisis isn’t what’s suddenly being priced in. Here’s instantaneous term premium 10 years hence minus ten-year term premium:
https://fred.stlouisfed.org/graph/?g=1XTPw
The spread between what priced in on the day ten years from now and on average over the next ten years has widened considerably since the Fed’s rate-hike blast in 2022, but hasn’t widened recently. In fact, it has recently narrowed. If market participants were suddenly expecting a crisis sometime in the medium term, that spread would have widened.
CNN has caught wind of the latest turn in our dealing with Iran. It has been reported for some time that our war-criminal-in-chief was disengaging from the war. Now, he has ordered his minions to disengage:
https://edition.cnn.com/2026/08/18/politics/iran-war-trump-halt-talks
He has also been trying to get other countries to put more pressure on Iran, with at least one notable success:
https://www.yahoo.com/news/world/articles/uae-suspends-trade-iran-lifting-175044090.html
The odds of reopening Hormuz by any fixed date continue to fall, but the latest news hasn’t accelerated the pace. Gasoline futures are actually down pretty sharply today, but other than a modest build in weekly inventories, I can’t see why.
The line about output outpacing employment runs the other way on the construction side. We run a job board for traveling trades workers, and construction payrolls are up about a percent this year even though the volume of work, once you back out inflation, is down. Contractors are paying to hold crews instead of letting them go, which shows up as cost rather than output. A journeyman traveling electrician is running about $35 to $45 an hour plus $100 to $125 a day per diem right now. We publish hourly pay by trade and state, updated monthly if anyone wants the numbers under that.
Like that link.