Instead of +0.1% increase, 0.6% drop.
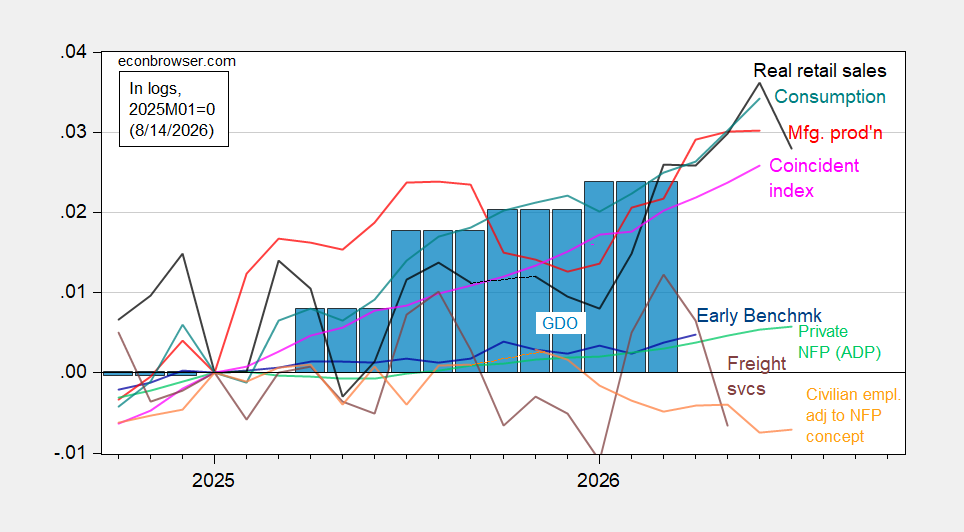
Figure 1: Implied Nonfarm Payroll early benchmark (NFP) (bold blue), civilian employment adjusted to NFP concept, smoothed population controls (bold orange), manufacturing production (red), personal income excluding current transfers in Ch.2017$ (bold green), real retail sales (black), freight services index (brown), and coincident index in Ch.2017$ (pink), GDO (blue bars), all log normalized to 2021M11=0. Source: Philadelphia Fed [1], Philadelphia Fed [2], Federal Reserve, BTS via FRED, BEA 2026Q2 advance release, and author’s calculations.
Off topic – a risk premium speculation:
https://fred.stlouisfed.org/graph/?g=1XSsD
Term premium for Treasury debt is rising. Corporate spreads, meanwhile, are very low and trending lower.
Is the U.S. becoming a more emerging-market kind of place, in which private debt is seen as maybe, someday, safer than sovereign debt? Not whole hog, of course, but just a little bit?
Treasury credit default swaps, though not high, are also trending higher while corporate credit spreads are low and narrowing.
https://en.macromicro.me/charts/68239/us-5year-cds
This isn’t a surprise, but it seems ever so slightly shameful.
Well, our President has been bankrupt a bunch of times. Paying bills is not what he has ever done.
Corporate spreads are trash. Not only is private debt double population size like 2007, but its far more spread around. Making it hard to contain. Just because they run huge deficits means little.
Like I said last time, johnny has only one thought: This doesn’t matter, that doesn’t matter. He said it about GDP. He said it about immigration. Now, he says it about credit spreads. If we we’re discussing biology, he’d say respiration doesn’t matter.
Sales excluding gasoline and motor vehicles fell 0.2%. With core CPI up 0.2%, the sloppy guess is that real sales ex-gas and autos fell about 0.4%.
Could be the end of soccer. Could be revised away.
GDPNow’s real PCE estimate for Q3 is down to 2.5% from 4.1% on today’s retail sales data, taking the GDP estimate down to 4.3% from 5.8%.
Yes, world cup hangover.
Navarro in today’s NYT. I see him waving the naughty finger. I see little to zero punitive action on the exact work-around he discusses. The same on zero punishment of large employers of illegal immigrants. They never go after the employers, (of whom, Donald Trump is one) as he has employed THOUSANDS of illegals at casinos, golf courses, and construction sites. He loves employing thousands of illegals at poverty wage as he pretends to be offended by them.