IP flat, below +0.3% m/m Bloomberg consensus, manufacturing -0.3% below +0.3%. Capacity utilization drops.
Adding in monthly GDP, early benchmark NFP as well.
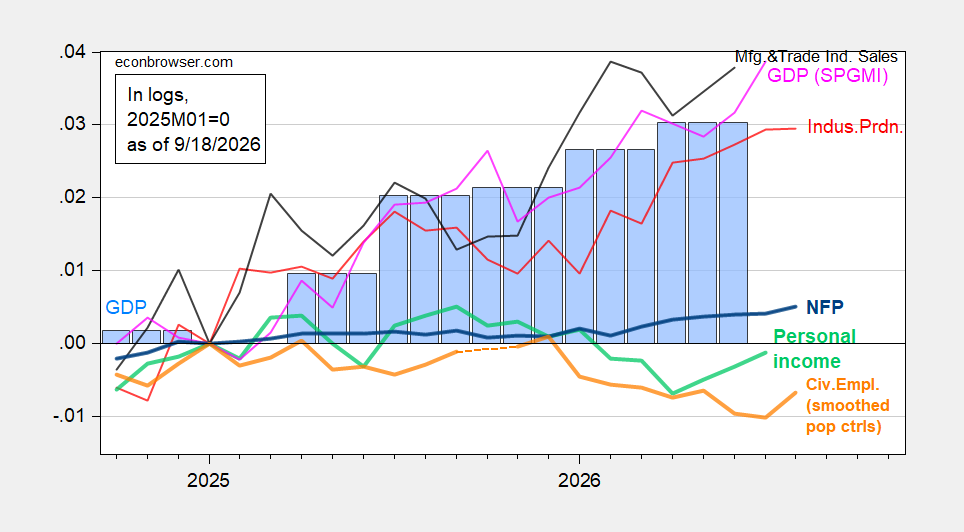
Figure 1: NFP employment (bold blue), civilian employment with smoothed population controls (bold orange), industrial production (red), personal income excluding current transfers in Ch.2017$ (bold light green), manufacturing and trade sales in Ch.2017$ (black), and monthly GDP in Ch.2017$ (pink), GDP (blue bars), all log normalized to 2025M01=0. Source: BLS via FRED, BLS, Federal Reserve, BEA 2026Q2 2nd release, S&P Global Market Insights (nee Macroeconomic Advisers, IHS Markit) (9/2/2026 release), and author’s calculations.
While industrial production was flat, manufacturing fell noticeably.
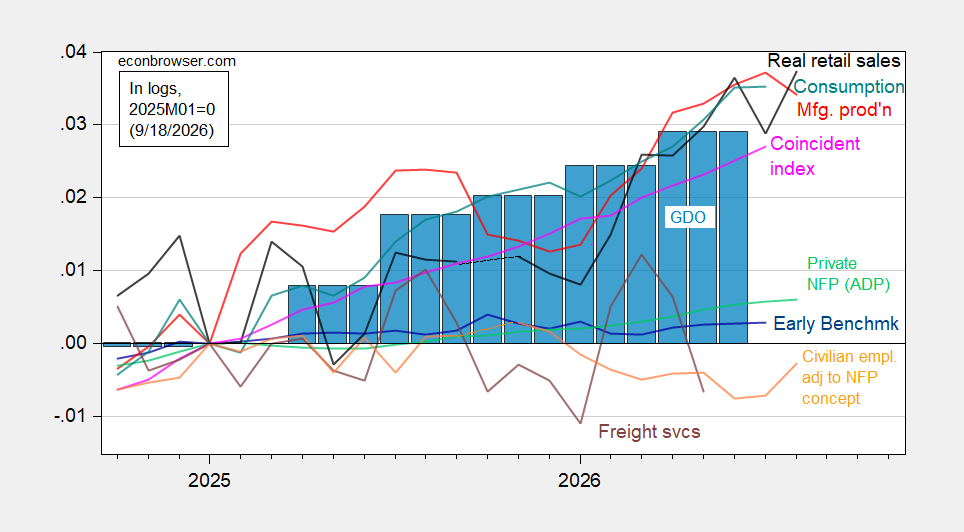
Figure 2: Civilian employment adjusted to NFP concept smoothed population controls, using experimental controls for 2025 (bold orange), manufacturing production (red), ADP private nonfarm payroll employment (light green), real retail sales, CPI deflated (black), freight services indexes (brown), and coincident index in Ch.2017$ (pink), GDO (blue bars), all log normalized to 2025M01=0. Source: BLS, ADP via FRED, Philadelphia Fed, Bureau of Transportation Statistics, Federal Reserve via FRED, BEA 2026Q2 2nd release, and author’s calculations.
Manufacturing production in late 2025 as well. so caution in suggesting a slowdown is warranted. After all, output and trade measures continued to rise through July. Output nowcasts for Q3 range from 2.3% (NY Fed today) to 5.1% (Atlanta Fed yesterday).