Employment downside surprise, +29K vs +89, with cumulative 81K downward revisions to previous two months. Taking into account early benchmark, it’s not changing the picture too much.
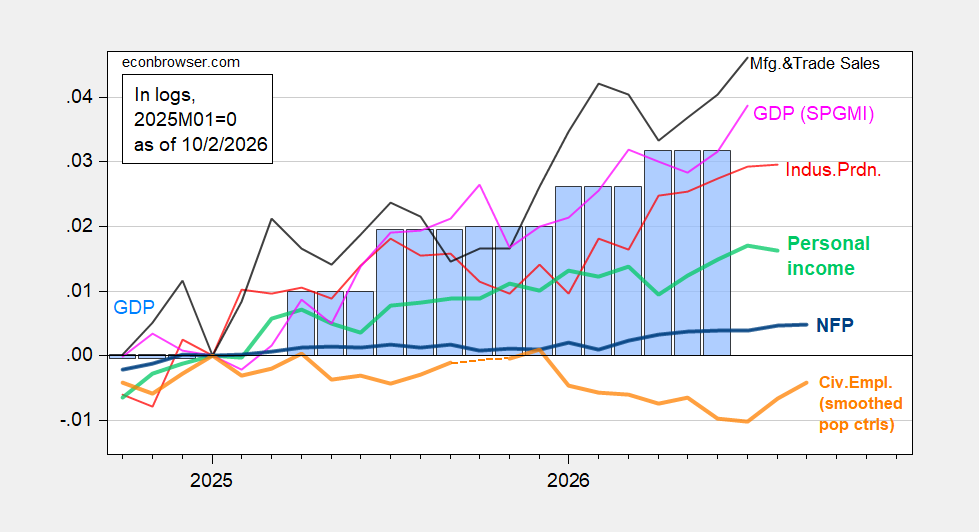
Figure 1: NFP employment (bold blue), civilian employment with smoothed population controls (bold orange), industrial production (red), personal income excluding current transfers in Ch.2017$ (bold light green), manufacturing and trade sales in Ch.2017$ (black), and monthly GDP in Ch.2017$ (pink), GDP (blue bars), all log normalized to 2025M01=0. Source: BLS via FRED, BLS, Federal Reserve, BEA 2026Q2 3rd release, S&P Global Market Insights (nee Macroeconomic Advisers, IHS Markit) (9/2/2026 release), and author’s calculations.
Note that employment from the household survey (CPS) continued to rise, but has not reattained January 2025 levels. This measure is subject to wider standard errors, but the trend is subject to less revision within the year (i.e., for same population controls).
Notice that the household employment series adjusted to the NFP concept (a research series) has much slower gradient, and it too remains below January 2025 levels. In addition, early benchmark — which incorporates QCEW data — is growing more slowly than reported NFP.
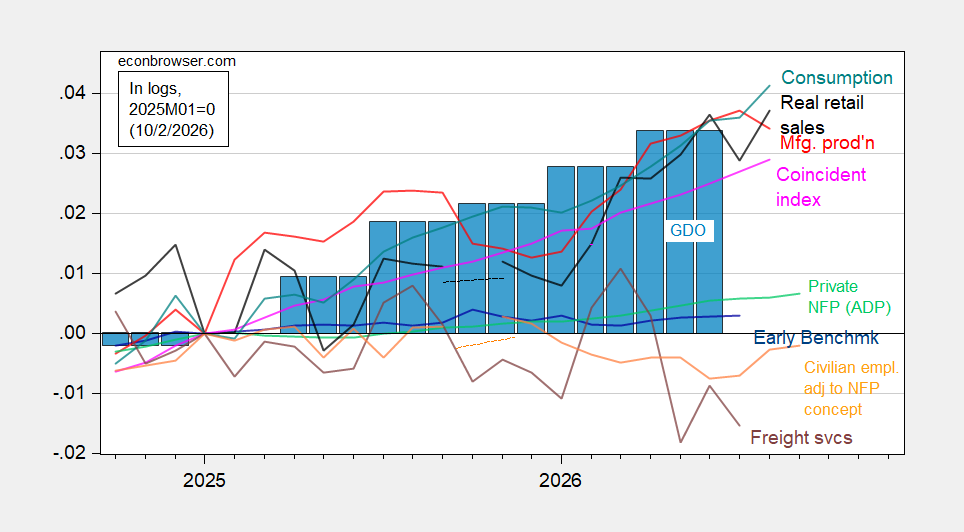
Figure 2: Civilian employment adjusted to NFP concept smoothed population controls, using experimental controls for 2025 (bold orange), manufacturing production (red), ADP private nonfarm payroll employment (light green), real retail sales, CPI deflated (black), freight services indexes (brown), and coincident index in Ch.2017$ (pink), GDO (blue bars), all log normalized to 2025M01=0. Source: BLS, ADP via FRED, Philadelphia Fed, Bureau of Transportation Statistics, Federal Reserve via FRED, BEA 2026Q2 3rd release, and author’s calculations.
Note that the freight services index has taken a dive relative to the last reading that went through May.
The picture of recent private NFP revisions looks like this:
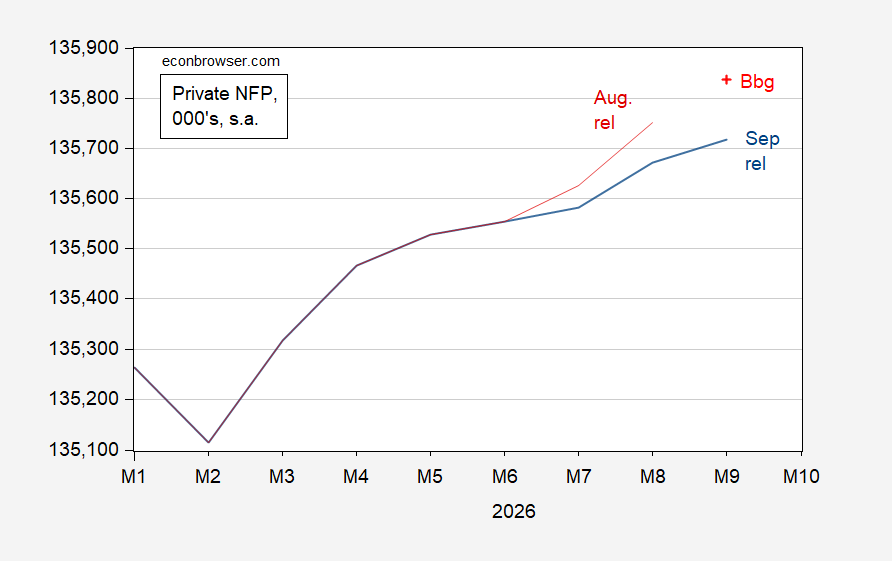
Figure 3: Private NFP from August release (red), from September release (blue), and implied Bloomberg consensus (red +), all in 000’s, s.a., on log scale. Source: BLS, Bloomberg, and author’s calculations.
+29 is still above some estimates of employment breakeven, per Torsten Slok, Ernie Tedeschi. and as recounted by AP via BNNBloomberg.
Initial jobless claims have a 60 year history of leading the unemployment rate. The increase from 4.1% to 4.2% this month is slightly misleading, in that it is a rounding issue. Carried one further decimal place out, the rate increased from 4.14% to 4.17%. Here’s the relationship graphically:
https://fred.stlouisfed.org/graph/fredgraph.png?g=1ZcHG&height=490
The trend, as suggested by the decline in initial claims, remains downward.
Jobless claims are overrated. A post wwii data sample that simply doesn’t cover the population in the % of 1950(industry) or 2000(Boomers, Professional class peak). What you have is AI “hiring” effecting that subgroup driving it lower via data center construction. So many people aren’t eligible for these “benefits” and work in the gig. Add gig economy to official data and unemployment, its over 6%+.
You can see this in the slow growth of tax revenue compared pre financial crisis. Its partly why deficits are so large.
It’s pretty obvious that Lava is just Johnny/Connie/Mary Rosh. If I had embarrassed myself as often as Lava has, I’d change my name, too.
Lava/Johnny/Connie really has only one idea, and that is to dismiss various things as unimportant. Jobs data are unimportant, price increases aren’t a big deal, immigration enforcement isn’t important to the labor market. Very predictable, never supported by evidence.
I have long had a rule of thumb, that if I can predict what some loudmouth will say, there’s no need to listen to the loudmouth. Lava/Johnny/Connie/Mary Rosh has nothing important to say, because he/she/whatever never says anything new. Always just a dismissal of some fact or idea. No substance at all.
For those who are interested in data rather than driven by predetermined ideology, here is the entire 50+ year pre-pandemic hsitory.
The leading/lagging relationship between initial claims and the unemployment is obvious and virtually uncontestable:
https://fred.stlouisfed.org/graph/fredgraph.png?g=1Zd84&height=490
My take is that we are in a non-recession, but we are going through a period of stag-flation that’s going to feel like a recession to a vast number of people. That’s the outhouse economist’s take.
Smells right.
I’m curious, and worried, about the freight services index. Its history isn’t long, nor is it similar from cycle to cycle, but it does seem leading sometimes, certainly coincident with late cycle and recession. It has been pretty lifeless since early 2023, and is now turning negative. Other measures of freight service have been somewhat more vigorous. The construction and equipment boom associated with the AI build-out has relied on freight movement. There are sizable contradictions between AI investment plans and credit market indicators, which make hints about construction and equipment particularly interesting now.
The Cass Index is too negative, while the US Freight Services Index is rather noisy, although I think it is helpful:
https://fred.stlouisfed.org/graph/fredgraph.png?g=1Zd8I&height=490
I would look at these indexes in conjunction with trucking employment. And of course, no one indicator or industry is infallible.
Hope that is helpful.
Thanks. I think this is going to be an important issue to watch. The main driver of the non-consumer economy get a great deal of attention, but that doesn’t mean turning points will be easily recognized.
Here’s a little check on the mindset in the bond market these days. A CNBC headline after Wednesday’s softer than expected inflation report:
“10-year Treasury yield is higher as traders look past inflation data, await jobs report”
A CNBC headline today, after a softer than expected jobs report:
“10-year Treasury yield ticks higher despite weaker-than-expected jobs report”
Weaker than expected infation and jobs followed by rising 10-year yields. Even though expectations for Fed rate hikes are backing off. Less inflation than expected, less costly funds than expected, fewer jobs than expected, and yields rise. Sell, Mortimer.
More bond market stuff:
https://www.bloomberg.com/news/articles/2026-10-01/paramount-s-41-billion-of-m-a-bonds-slump-as-trading-begins
I’m not pointing this out to pick on the Paramount/Warner deal (an abomination) nor because of any dislike of the Ellisons (who are parasites), but because of the bond market symptoms it relates.
Paramount sold $52 billion in debt last Wednesday, and the new owners of thst debt got clobbered. That’s not how investment banking is supposed to work. Not only were there losses out of the gate, but many bidders got all the bonds they asked for – an uncommon occurrence – because some bids were withdrawn at the last minute. So successful bidders lost more than they otherwise would have. Underwriters are also holding more of the new debt than they planned on, and are also sucking up losses.
Why did the bid suddenly dry up? Beats me, but…in the week leading up to the sale, Treasury 10s had added 32 basis points in yield and corporate spreads were widening rather inconveniently. But then $52 billion in a single name coming to market might have had a hand in that widening – I haven’t checked.
Anyhow, corporate debt is showing signs of trouble now, after handling earlier Treasury weakness fairly well. This isn’t the first recent corporate issue to stub its toe. SpaceX was also a dog, but that’s a different story. Corporate spreads weren’t widening in June, and Treasuries weren’t sinking quite so fast. The SpaceX bond flop was mostly a SpaceX thing. The Paramount story looks like a wider bond market problem.
By the way, Treasury credit default swaps, while not ringing alarm bells, have been edging up:
https://www.worldgovernmentbonds.com/cds-historical-data/united-states/5-years/
Uh oh…
S&P has cut its credit rating on French debt to A+ from AA-. This is an unscheduled ratings change, a sign of urgency. That may be because credit markets have already downgraded French debt pretty sharply. French 5-year CDS are priced at 79.84, vs 33.37 at the end of August. For comparison, Greek CDS are at 48.11. France is pretty much always debating pension reform these days, and S&P’s action may motivate actual legislation.
if anyone is wondering how the alternative measure of unemployment, U-6, which includes those “employed part time for economic reasons”, fell from 7.7% in August to 7.6% in September, even though the U-3 unemployment rate rose and the number of the employed who reported they were forced to accept just part time work rose by 111,000 to 4,501,000 in September. it was due to an unprecedented 236,000 drop in “marginally attached” workers, which also expands the denominator of the U6 metric…the rest of the explanation is in the rounding anomalies: U3 barely rose, from 4.14% to 4.17%, as cited by NDD above, while U6 barely fell, from 7.654% to 7.615%…
Texas Governor Abbott has declared a state of emergency in response to high diesel prices:
https://www.newsweek.com/texas-declares-diesel-price-emergency-other-states-paying-more-12499408
In other news, Texas Governor Abbott is polling about even with his Democratic challenger:
https://www.270towin.com/2026-governor-polls/texas
One has nothing to do with the other, I’m sure.
European governments have decided to release 100 million barrels of diesel from reserves. The U.S. felon-in-chief had been threatening to cut diesel exports and will take credit for bullying Europe into releasing diesel.
Diesel prices have come down, not necessarily because of the announced release. One indicator of the tightness of the product market is the crack spread, which is still very close to the high end of its historic range:
https://rbnenergy.com/market-data/3-2-1-crack-spread
Another sign that the announcement isn’t having a great effect is the spread between diesel and gasoline prices, which is still quite wide:
https://fred.stlouisfed.org/graph/?g=1ZezY
Early days, I suppose, but the obvious solution to high petroleum prices is to end the war on Iran.
This is why we need to break up the social media conglomerates and turn them all into non-profit user owned platforms.
https://www.hollywoodreporter.com/business/digital/elon-musk-documentary-trailer-rejected-tiktok-youtube-1236710259/
A documentary about Elon Musk has been banned by all the big social media platforms.
Yikes. The press and social media capitulating to the felon-in-chief was cowardice. Playing dead for every rich guy is just craven. Musk may be the single biggest buyer of propaganda in the U.S., and nobody with an audience wants to poke around in his closet?
Off topic – oil oddities:
The oil market is a mess and reporting is highly politicized, so naturally there will be conflicting headlines. Right now, those conflicts seem extreme. For instance, Oilprice is running a story about loosening of Iran’s control over Persian Gulf exports, but Brent is trading at $102:
https://oilprice.com/Energy/Energy-General/Iran-Is-Losing-Some-of-Its-Leverage-Over-the-Strait-of-Hormuz.html
The “Iran losing control of Persian Guld exports” spin is less important than the statements of fact in the article, which don’t match up well with pricing. Here are a couple of early paragraphs:
“At least 16.5 million barrels per day of crude left the region between September 1 and 28, matching the prewar average when Iran is excluded, according to commodity analytics firm Kpler.
“But while crude levels have risen, the refinery bottleneck that has caused a global spike in diesel prices persists.”
Crude supply back near pre-war levels, but refinery demand reduced, should put downward pressure on crude prices. Perhaps tight crude inventories account for continued high prices?
China has re-imposed restrictions on exports of refined products, suggestive of either a crude shortage for domestic refineries or a shortage of refined-product imports. Russia has also renewed its ban on diesel exports. All if this “oil supply up, diesel supply down” news should mean a widening crack spread. The crack spread is still very wide, but as of yesterday was at its narrowest point since mid-September:
https://rbnenergy.com/market-data/3-2-1-crack-spread
OPEC+ announced yesterday that it will maintain its latest output target, but as the WSJ notes: “Most members also continue to pump below their official production targets.”
If Persian Gulf exports are back to pre-war levels, why are most OPEC members falling short of their quota, missing out on a bonanza? Iran and Russia (Russia is included in the “+”, I believe) should be below quota, but “most members” is more than just those two.
I might guess there’s a tanker shortage, but then how can there be a near-pre-war level of Persian Gulf exports? Gulf exports, even if they travel through pipelines, still mostly end up in tankers.
Something’s fishy.
I agree those are strange things that I also find hard to understand.
The biggest crunch is with refining of crude. The world’s refineries cannot easily change from processing of one type of crude to another. Furthermore, it is way too expensive to have idle refineries – so the system has limited spare capacity.
There has been a reduction in total world refining capacity because of destruction in Russia and the gulf states. But there is also idle capacity in China because they cannot get the crude from Iran that some of their refineries are specifically tuned to process.
I presume that the people buying crude have to predict the availability of refiing capacity several month in advance – and that would be a very difficult thing to do – and subject to all kinds of over/under reactions to daily news.
Spring maintenance at U.S. refineries was largely skipped. Industry folk are now saying autumn maintenance can’t be skipped, so that refineries will have to shut down soon. The refinery CapU rate is down to 92.5% in the latest week, from a hugh of 98.0% in late August, so maybe maintenance has begun.
More off topic stuff – closing down Chinese banks:
https://www.fitchratings.com/research/banks/china-accelerates-small-bank-cleanup-to-preserve-financial-stability-28-09-2026
I don’t know whether the rapid pace of bank closure in China is an indication of a problem being solved in good order or a desperate race to avoid disaster. The numbers in the Fitch report paint an ugly picture, either way.
Are the progression of daily weekly, monthly, yearly composite equity, bond, and commodity prices, the best and most precise indicator (rather than the usual suspects including unemployment trends ) of peak asset-debt macroeconomic performance and tell-tale of imminent macroeconomic private debt-reordering associated recessions?
The composite equity valuation patterns of 1929 and 2026 would suggest so.
It would be nice if you could rewrite this in English. As written, I have no idea what it means.