Reuters – “U.S. consumer prices post largest gain in 13 years; inflation has likely peaked”. Surprises on the upside, put in context. Stripping out volatile components, inflation is up; focusing on sticky prices, inflation is down.
The CPI surprise was 0.4%, while that for Core CPI was 0.43% (relative to Bloomberg consensus as of yesterday). To place these in context, the variability of m/m changes in the (log) CPI and Core CPI is about 0.2%.

Figure 1: CPI all urban (bold blue line), Bloomberg consensus (blue +), 2016-19 stochastic trend (blue gray line), CPI less food and energy (“core”), (bold dark red), Bloomberg consensus (red square), and 2016-19 stochastic trend (red gray line), both on log scale. Source: BLS, Bloomberg, and author’s calculations.
In addition, the price level as of June was above the 2016-19 linear trend, as shown above. Prices have caught up, and more (both are about 1.5% above trend).
On the other hand, while headline m/m inflation is up, a measure that focuses on infrequently changed prices — the sticky price CPI — has declined, suggesting easing pressures. The trimmed CPI — which excises highly volatile components — kept on rising indicating it’s not outliers driving June increases.
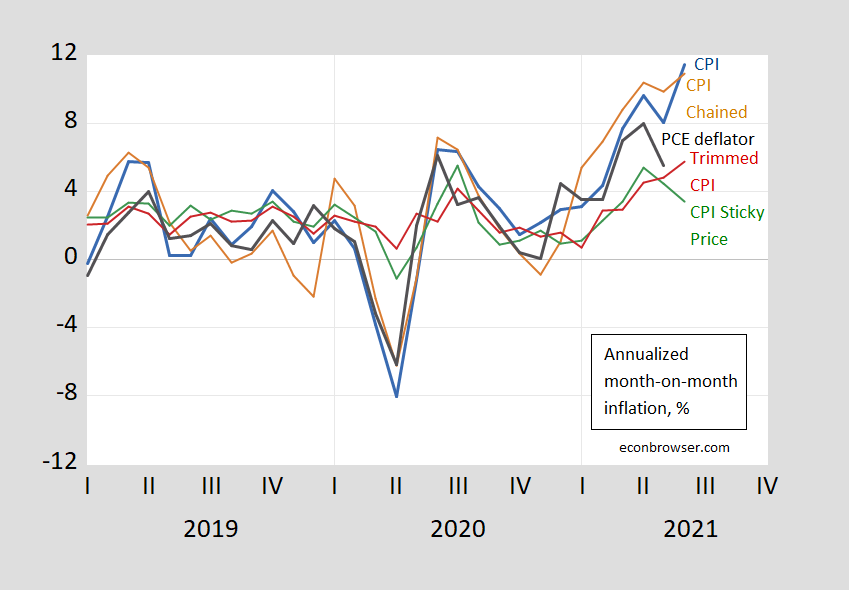
Figure 2: Month-on-month annualized inflation from CPI-all urban (blue), from personal consumption expenditure (PCE) deflator (black), chained CPI, nsa (brown), sticky price CPI (green), and 16% trimmed mean CPI (red). Source: BLS, Atlanta Fed, Cleveland Fed, via FRED, and author’s calculations.
What about core measures? These are shown in Figure 3 (no trimmed core shown).
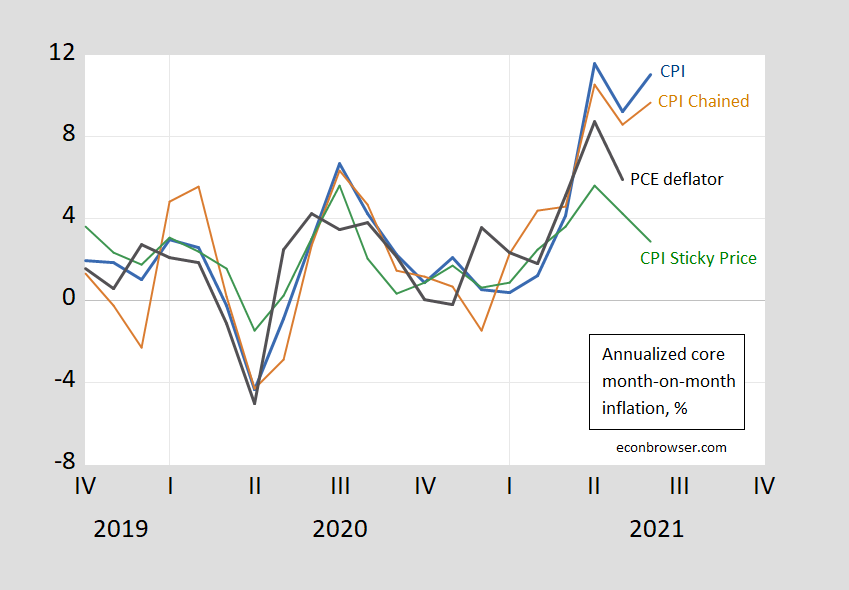
Figure 3: Month-on-month annualized inflation from CPI-all urban (blue), from personal consumption expenditure (PCE) deflator (black), chained CPI, nsa (brown), and sticky price CPI (green). Source: BLS, Atlanta Fed, Cleveland Fed, via FRED, and author’s calculations.
The pandemic has made it more important to examine the role of specific components. CEA notes that excluding “cars and pandemic-affected services, core inflation rose 0.22 percent month-over-month, relative to 0.28 percent in May and 0.31 percent in April”. This is shown in this graph:

Source: CEA (7/13/2021).
Ah but hamburgers are cheaper. Unless you are Princeton Steve who insists on using a bagel for the bun.
higher, but controlled, inflation is exactly what the fed wanted. not sure why so many talking heads are in such shock.
It’s their job to be shocked and outraged. Fortunately, the talking heads are easy to ignore by choosing not to turn on a television set. And to filter the daily hysteria on op-ed pages. Facts and factual analysis are more interesting anyway.
Cleveland Fed’s 10 year expected inflation number is 1.61%.
Apologies for going off topic but I just learned about this sick interview between Maria Bartiromo and Trump on 1/6:
https://www.msn.com/en-us/news/politics/trump-on-jan-6-insurrection-these-were-great-people/ar-AAM1Bod?ocid=uxbndlbing
Trump claims the rioters were all beautiful people just spreading love. Of course the ugly fat b$tch just goes yea, yea. I know Fox News is desperate for ratings but what find of morons watch this garbage?
hate is a poison you give to yourself…..
Inflation alongside falling real wages is a problem. Any idea over what time frame the Fed will correct for the overshoot?
Rates of inflation that are greater than income growth clearly are a troubling issue. However, over any meaningful time measure, wages and inflation rates have a strong correlation.
Now if you want to get granular, that correlation does tend to weaken for lower-income quintile, and in the other direction for the top quintiles, but the Fed is highly macro, and never considers such plebian variences (yes, sarcasm does drip).
Are real wages falling? One needs to factor in whatever increases in nominal wages are occurring. Just saying – one needs to present some sort of reliable data.
MarkLouis: I think real wages as measured by FRED series AHETPI is at trend (i.e., divide AHETPI by CPIAUCSL). Now, for sure, some people have lower real wages than pre-pandemic. And compositional shifts make comparisons difficult – but I think it’s not clear exactly where average wages (or compensation for that matter) are relative to pre-pandemic trend.
There is a good chance they won’t correct. The Fed’s aim is to correct for previous undershoot. Only if policy makers believe inflation will overshoot their own goal, which involves making up for undershoot, will they see a need to correct in the other direction.
Before there is much chance of the Fed correcting for a perceived risk of inflation, it will aim at a return to what policy makers see as “normal” with the nominal funds rate around 2.5%. If inflation runs above target (for the near-term target, see the median estimates here: https://www.federalreserve.gov/monetarypolicy/fomcprojtabl20210616.htm), the Fed will begin normalization earlier.
In terms of sectoral breakdown, that latest one provided here by Menzie highlights how much a role vehicles are still playing in this rising inflation. I would think that would be getting more under a control, but maybe that is still manifesting the chip shortage problem.
large toyota dealer in town, storage lots nearly mt…..
@ paddy Kivlin
You’ll know it’s getting super bad when people start buying low quality American brand names, like Ford, Chevy, and Dodge. You know, the cars where when you shut the door it makes a large unsettling thud like donald trump just tripped on a banana at the edge of a 10 story building and dropped onto 15 thin layers of cardboard in the parking lot below. The better quality cars like Toyota where it sounds like a vacuum seal being made when you tap the door shut is not such a great indicator of economy wide demand. I just thought of that first visual because it gives me pleasure and it can be used as a relaxation technique for self-hypnosis or for people suffering from sleep-deprivation.
Paddy,
Sorry, but I do not know what you mean by “mt”? The only usage I am aware for that particular pair of letters is as an abbreviation for “mountain.” So, are you saying the large toyota dealer in whatever town you happen to be located has a “mountain” of cars in its storage lots? Are they actually piled on top of each other to make a mountain? Really? Or are you using “mt” to mean something else? If you think you are being cute or insightful or witty with this usage, well, looks more like blithering stupidity frankly.
MT is construction knuckle dragger shorthand for empty. It may be used in other industries, but as a construction knuckle dragger, it was clear to me,
@ Willie
This may also be common for semi truck-drivers. I’ve been out of the industry for too long, so can’t really comment. I’ll check in with Cledus and Rubber Duck and see. Last time I checked Cledus had a dedicated route running beer to Texarkana and Rubber Duck was proselytizing out of a bus with some girl named Melissa. Hopefully none of them work for “Prime Inc” or they might die diving off some western America cliff and still be “underwater” on their rig and trailer loan at the moment they are pronounced dead.
“Biffy the Slip-Seater” (my former CB moniker) was always a “company driver” so luckily I left the industry on the plus side of the ledger. Though sometimes I miss my early days when I paid 5 times for a truckstop meal than I would have paid if there was a Denny’s nearby. Sweet memories of rectal pain paying $5million for half a catfish filet, wee-wee-ing out 5 gallons of coffee in 10 hours and repeating “baby booey” innumerable times on the CB at 4am in the morning just to keep other drivers annoyed (and therefor awake).
[ Sigh……. ] Good times……..
Thanks, Willie. Guess it is sort of obvious once pointed out, but I never saw it before and failed to figure it out. You spell out the letters as “em tee” rather than seeing it as the abbreviation, “mount,” as I was doing That does it.
*”Baba Booey”. Excuse me, it’s very important I get that right.
And I thought he meant metric ton! Silly me!
Anyway, it is consistent with the vehicle shortage story, which really should get itself more in balance in a few months. Maybe the rent increases will continue, but this part of the recent inflation surge looks like to go away in the not too distant future, and pretty clearly the financial market see that, even if some talking heads and GOP politicians do not.
https://fred.stlouisfed.org/graph/?g=ro2f
January 15, 2018
Real Average Hourly Earnings, * 2000-2021
* Production and nonsupervisory workers accounting for approximately four-fifths of the total employment on private nonfarm payrolls
(Indexed to 2000)
https://fred.stlouisfed.org/graph/?g=ro3M
January 15, 2018
Real Average Hourly Earnings, * 2007-2021
* Production and nonsupervisory workers accounting for approximately four-fifths of the total employment on private nonfarm payrolls
(Indexed to 2007)
https://fred.stlouisfed.org/graph/?g=twAi
January 15, 2018
Real Average Hourly Earnings of All Private Workers, 2017-2021
(Indexed to 2017)
https://fred.stlouisfed.org/graph/?g=mlWs
January 15, 2018
Real Median Weekly Earnings, 2000-2020
* All full time wage and salary workers
(Indexed to 2000)
https://fred.stlouisfed.org/graph/?g=rAbi
January 15, 2018
Real Median Weekly Earnings for men and women, * 2000-2020
* Full time wage and salary workers
https://fred.stlouisfed.org/graph/?g=lMaX
January 15, 2018
Real Median Weekly Earnings for men and women, * 2000-2020
* Full time wage and salary workers
(Indexed to 2000)
https://fred.stlouisfed.org/graph/?g=muKd
January 15, 2018
Real Median Weekly Earnings for White, Black and Hispanic, * 2001-2020
* Full time wage and salary workers
https://fred.stlouisfed.org/graph/?g=muKc
January 15, 2018
Real Median Weekly Earnings for White, Black and Hispanic, * 2001-2020
* Full time wage and salary workers
(Indexed to 2001)
https://fred.stlouisfed.org/graph/?g=rzk3
January 15, 2018
Real Median Weekly Earnings for White and Asian, * 2001-2020
* Full time wage and salary workers
https://fred.stlouisfed.org/graph/?g=rzkC
January 15, 2018
Real Median Weekly Earnings for White and Asian, * 2001-2020
* Full time wage and salary workers
(Indexed to 2001)