GDP growth was revised down, as expected, in today’s NIPA preliminary GDP release. At 0.6% q/q growth SAAR was below Bloomberg consensus of 0.8%. But even more revealing is the pattern in recent revisions; in addition, trade adjustment looks a bit further off.
First, one interesting aspect of the current and previous quarter’s revisions from advance to preliminary is shown in Figure 1.
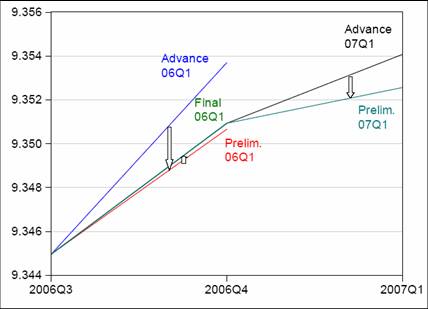
Figure 1: Log Real GDP, 06Q4 advance (blue), preliminary (red), final (green) and 07Q1 advance (black), preliminary (teal). Source: BEA, NIPA, various releases.
The revision was negative in 06Q4 going from advance to preliminary (going from blue to red). In 07Q1, the revision was once again negative going from advance to preliminary (going from black to teal). This is interesting given that on average over the 1983-2003 period, the growth rates were revised upward on average 0.1 percentage points. This reminds me of the fact that around downward turning points, GDP (like many other variables) tends to be revised downward. As a reminder, recall what GDP looked like going into the last recession (from this post on the last recession), and what the 2003 vintage of GDP looked like after the fact. (Also note that forecasters were predicting an acceleration of GDP growth back then, too.)

Figure 2: Log real GDP (1/31/01 release), SPF forecast (2/10/01), and log real GDP (11/25/03 release). NBER recession dates in gray. Sources: BEA via St. Louis Fed ALFRED, Philadelphia Fed and NBER.
A second observation is that the net exports to GDP ratio looks noticeably worse as a function of this revision, even from the perspective of several years, which is pretty amazing to me. This occurs because the trade deficit is revised substantially upward as GDP (in the denominator) is revised downward. Figure 3 shows both the total net exports and net exports ex oil imports ratio, using the advance and preliminary series.
Figure 3: Net exports to GDP ratio, 07Q1 advance (red), preliminary (blue); net exports ex oil imports to GDP ratio, 07Q1 advance (black), preliminary (green). Source: BEA, NIPA, and author’s calculations.
Finally, the preliminary series confirm what I, and Brad Setser, have discussed on several occasions ([1], [2]): namely that the export surge, upon which optimists pin their hopes, is looking a lot less impressive after the revision. Figure 4 shows q/q growth rates of exports and imports.
Figure 4: Growth rates of real exports of goods and services (in log terms, q/q), 07Q1 advance (red), preliminary (blue); imports of goods ex oil, 07Q1 advance (black), preliminary (green). Source: BEA, NIPA, and author’s calculations.
Quarter on quarter growth (in log terms) in real non-oil goods imports is now below that for goods and services exports. While over a 2 quarter horizon, it’s about 2.5 percentage points faster, Given that US imports are about 60% larger than exports, well, you can do the math.
Technorati Tags: imports,
trade deficit,
exports,
oil imports,
GDP,
recession.
.
By the way, both gross and net national income were revised to show contraction in Q1. The Fed guys (along with Ip at the WSJ) thought that income figures matched labor market data better, so might be a better representation of what is going on in the economy than output figures. Oops. Now the match is not so good. If the state labor tax data from Q3 are a harbinger of things to come, weaker income and output data will both match the labor market data better once the next revisions come in.
Professor Chinn, my only true area of expertise is emerging markets equities, but as I have time I also try to follow commodities and the U.S. economy. I can’t argue with what you show above, but I would add that there are also a variety of positive economic signals which is one of the reasons why the U.S. stock markets are higher over the past two days. This article discusses these positive signs:
http://www.bloomberg.com/apps/news?pid=20601087&sid=a83aPUKDc6ZA&refer=home
Note that Ben Bernanke is one of the optimists forecasting higher growth. If I remember correctly, I once read in the New York Times that the Fed has a better history of predicting inflation than the average of private forecasters. Does anyone know if this is true?
It’s interesting to contrast US growth and German growth in the first quarter.
Personal consumption expenditures in Germany were strongly negative (mostly due to a VAT tax rise, but PCE wouldn’t exactly be strongly rising otherwise) while investment activity is brisk. In fact, German machine tools and plant equipment makers think this might be their best year since the late 60s! Capacity utilization is at 93%.
Meanwhile, in the USA, personal consumption expenditure is what kept the USA from recession territory while investment was pretty modest.
And all this despite what can only be called a pretty strong euro.
I guess my question is why have US manufacturers not benefited (much) more from strong global demand?
Charlie, a paper by Christina and David Romer in the American Economic Review in 2000 found strong evidence that the Fed can forecast inflation better than the private sector.
JDH wrote:
Charlie, a paper by Christina and David Romer in the American Economic Review in 2000 found strong evidence that the Fed can forecast inflation better than the private sector.
Why is this a surprise? Who controls the money supply? Who has advanced notice on what the FED is thinking and doing? This seems like a DUH?! to me. I think I can forecast my spending better than any economist in the state.
Thanks for the info, JDH, and here is something that may interest you: Energy expert Andrew Weissman says that we may lose 10% of our future natural gas supplies:
http://www.marketwatch.com/news/story/major-loss-gas-reserves-seen/story.aspx?guid=%7B8B7F0A3D%2D0AFD%2D4A3D%2DB61F%2D1E18DFDA6C1F%7D&siteid=yhoof
Not mentioned in this article is the fact that natural gas is used in ethanol plants.
we may lose 10% of our future natural gas supplies
I don’t like how that is phrased. Nothing is being “lost”. The implication is that the project was abandoned because it wasn’t economic at today’s prices (hard to believe). But it could be economic in the future if prices go higher.
Demand for natural gas is increasing. All that de-sulphurized diesel fuel that we talked about last week requires natural gas (they use it to make hydrogen in a process called hydrotreating). Then you’ve got your clean air regs that are driving natural gas use for electricity, heating, transportation, and all kinds of other uses.
Like I said, it is hard to believe that this project is uneconomic, although at $16.5B, it is an expensive project.
Anonymous, the Romer and Romer paper argues that the Fed’s information advantage about output and inflation is not due to either early access to government statistics or inside info about monetary policy, but simply because the Fed devotes more resources to forecasting than private forecasters do. Here is a shorter discussion of the Romers’ research:
http://www.nber.org/reporter/fall02/monetaryPolicy.html
kharris: Good observation. I know there has been a practice of taking the average of the product and income side estimates of economic activity to get a better measure of how the economy is doing, but I don’t know what the statistical basis for this approach is.
Charlie Stromeyer: Yes, there is statistical evidence that Green Book forecasts are better predictors than private sector forecasts, as JDH points out. Unlike Buzzcut I find this an interesting finding. That’s because the forecasts — in my understanding — is supposed to be unconditional, i.e., not incorporating expectations regarding Fed actions or the Fed reaction function. (Also, the staff is compiling the forecasts, not the FOMC.) In addition, there is a well-known literature that asserts that economic agents will observe a larger information set than the econometrician (here being equated with the Fed forecasters), and hence generate superior (mean squared error, etc.) forecasts.
Iasius: There is some speculation that the rapid economic growth — in particular the resurgence in capital investment — has been centered in Europe, which draws most of its imports not from the United States, but elsewhere.
Like I said, it is hard to believe that this project is uneconomic, although at $16.5B, it is an expensive project.
Plus on going operating costs (remember that outage in the Alaskan pipeline a while back – pipelines require constant tending). It is easy to see how they might think there will be little profit at the end of the pipeline.
Especially if they feel the economy is heading into a prolonged slowing with reduced demand.
In recent years, the income side of the national accounts has been more accurate than the initial product side. I.E. in annual revisions, the GDP numbers tend to correct towards the income side. See the following paper:
“Estimating Probabilities of Recession in Real Time Using GDP and GDI”, Jeremy J. Nalewaik, FEDS 2007-07
Abstract:
This work estimates Markov switching models on real time data and shows that the growth rate of gross domestic income (GDI), deflated by the GDP deflator, has done a better job recognizing the start of recessions than has the growth rate of real GDP. This result suggests that placing an increased focus on GDI may be useful in assessing the current state of the economy. In addition, the paper shows that the definition of a low-growth phase in the Markov switching models has changed over the past couple of decades. The models increasingly define this phase as an extended period of around zero rather than negative growth, diverging somewhat from the traditional definition of a recession.
Menzie Chinn: “There is some speculation that the rapid economic growth — in particular the resurgence in capital investment — has been centered in Europe, which draws most of its imports not from the United States, but elsewhere.”
I guess my question was more related to the question of why this is occurring, not whether it is.
Is US manufacturing uncompetitive? And if so, what needs to be done?
This is related to my opinion that a significant part of the US trade deficit is not directly related to exchange rates or demand imbalances, but structural weaknesses of US industry that have escaped attention due to the otherwise strong US economy in the past years.