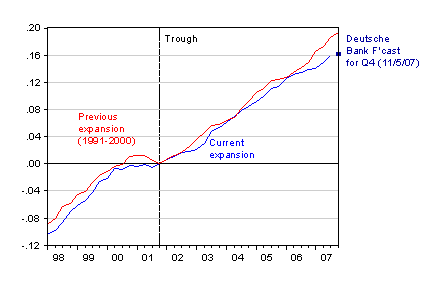
Just to put the 2007Q3 3.9% SAAR increase in GDP in perspective, here is how output stacks up during this expansion as compared to the last.

Figure 1: Log real GDP levels compared to NBER defined troughs for current expansion (blue), implied DeutscheBank forecast for 2007Q4 (dark blue square), and previous expansion (red). Source: BEA, 31 October 2007 NIPA release; NBER, Deutsche Bank Global Economic Perspectives (Nov. 5), and author’s calculations.
As of Q3, GDP is 2.6% less than the level recorded at the comparable point in the business cycle. If the Deutsche Bank forecast of 1.0% SAAR growth in 2007Q4 holds true (and Q3 GDP is not revised up or down), then GDP will be 3.2% less (all calculations in log terms).
[Late Addition] The Blue Chip median forecast is for 1.7% SAAR growth in Q4, according to this Reuters article.
[Late, late addition: 2:20pm pacific, 11/11/07]

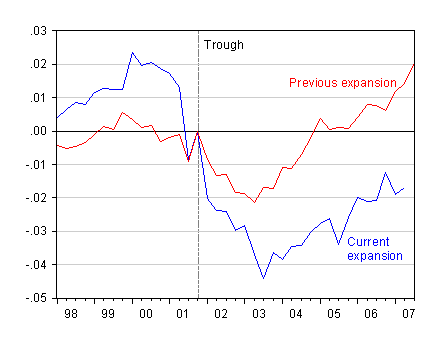
Figure 2: Federal net lending as a share of nominal GDP, on a NIPA basis (line 45, Table 3.2), normalized to 0 at trough, for current expansion (blue) and previous expansion (red). Source: BEA, NIPA release of 31 October, and author’s calculations.

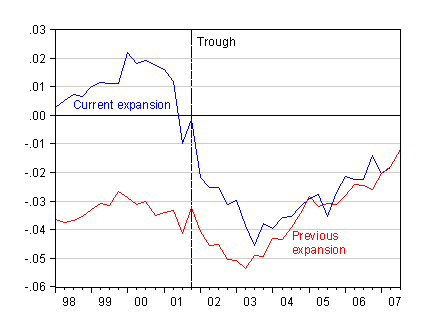
Figure 3: Federal net lending as a share of nominal GDP, on a NIPA basis (line 45, Table 3.2), for current expansion (blue) and previous expansion (red). Source: BEA, NIPA release of 31 October, and author’s calculations.
Last week I posted Nominal GDP vs the Prime Rate.
It clearly shows that there is more room for rates to drop.
Also the 15-month(5-quarters) annualized percent change vs Employment(NFP). The trend is also definitively down. See
http://wrahal.blogspot.com/2007/11/employment-and-gdp.html
Menzie-
Who says that business cycles have to be comparable? Interesting to note that during the Clinton “It’s the economy, stupid” claim, the economy had reached it’s bottom and was expanding. And if the forecast is wrong and the economy expands closer to the 3rd Q rate, not much difference.
A thin reed, Menzie, upon which you hang your hat.
Rich Berger: I didn’t say anything about good or bad — there are no reeds, and I have no hat. Data are data.
By the way, even if 3.9% SAAR is replicated in 07Q4, then output will still be 2.5% below (in log terms).
Could this [1.0-3.9 range] still be optimistic given the weight of “writedowns” in the Financial sector that seem to be screaming at us…that we will need to erase a lot of economic product that was just so much Frankfurtifiable BS? Not merely that the “advance” might be 3.9 and the “preliminary” something less and the “final” say 1.0%, but that “writedowns” approaching $1T (the CR guess) looks like a 7% GDP adjustment to me.
It would be a miracle for the two expansions to graph identical.
Especially since the underpinnings for both business cycles are so different. One has lower taxes and a war to fight. Both are paying off the deficit in nearly identical time frames. Both have their bubbles, but one was saddled with the effects of BOTH bubbles. Did I say already both are paying off the deficit in nearly identical time frames? Data are data and facts are facts.
CoRev: Please consult the graph in this post. Compare the FY1994 and FY1999, and you’ll see a decrease in the debt-to-GDP ratio. Compare FY2002 and FY2007; you see an increase. The data are from CBO, The Budget and Economic Outlook: An Update August 23, 2007. It hardly seems to me that both Administrations are paying off debt in the same way in the same time frame, was you assert.
Jaim Klein: I was not claiming that they should be the same; but in the past I have observed that one might have expected more growth from a period of fiscal profligacy and particularly stimulative monetary policy. In any case, I have observed in previous posts (but did not repeat myself in this post) that the growth surge in the previous recovery was moderate by historical standards. Had I used the average of previous recoveries, the comparison would have been even more stark. (See this article for some graphs.)
Something that is conspicously different during this expansion is the size of the productive slack. The output gap is bigger, and capacity utilization and labor force participation are lower than we would expect 23 quarters into the cycle. I wrote about that this week (www.econweekly.com).
Menzie-
Then I will take your post to mean even with a war on, the two expansions are similar.
Rich Berger: I take it to mean that with an increased amount of spending devoted to government consumption (most defense spending takes that form) as opposed to transfers, and hence implicitly a larger multiplier, it is surprising from a Keynesian perspective growth was not more rapid. See this post (although, note the current “burn rate” is probably higher than what I cite in the calculations).
Menzie, I said paying off the deficit, not the Fed debt. Care to compare the deficit to GDP ratios? You’ve changed the subject, again. If we are going to discuss things, let’s be sure they remain the same things, please.
Rich, don’t forget that other minor factor, lowered taxes. Oops, now I’ve made that linkage.
Menzie, I’m not trying to be a smart a$$, but if you keep up in this line of thought, I may not bring a gift to that Lake Geneva house warming party.
CoRev: Apologies for the confusion, but I’m afraid I didn’t understand what it meant to “pay off a deficit”. If you meant “reduce the deficit”, then I’ll just refer you to the Figure 2 I’ve added to the post. Thanks for bringing this to my attention.
CoRev: I’ve added Figure 3, which might represent what you are getting at. So, yes, starting with an advantage of about 3 ppts. of GDP, we are now just about at the same budget deficit that we were at the comparable stage of the expansion (although the full employment budget surplus is clearly more negative).
Menzie, thank you for chart 3. I have not seen the two cycles overlaid before. It really is a telling story. Sorry, for the confusion on the reducing the deficit issue.
Hope, you don’t mind if I use this chart over at my house. Also, let me know where you are registered so that when I buy my house warming gift, it is something you really want/need.
CoRev: Sure please feel free to use, with attribution.
Menize-
Sum of deficits as % of GDP FYE 93-99 – 6.5%; for FYE 01-07 – 12.9%; difference is 0.9% of GDP per annum. Not a significant amount of difference. Bush economic performance better when deficits declining and interest rates rising.
Rich Berger: if you call cumulative 6.4 ppts. of GDP worth of deficits not significant, that’s certainly your prerogative.
Rich, in the spirit of comparing the administrations synchronized to business cycles your selection of years was wrong. Moreover, with a comparative selection Bush’s numbers will probably be similar to St Bills.
There is another difference between the previous recovery and the current recovery. The Reagan supply side revolution that built the tax foundation for the 1990s was huge. The supply side successes of the 2000s have been marginal at best. Where Regean broadened the base for taxing and, in the spirit of Andrew Mellon, shifted the investments of the rich from tax free or sheltered investments into productive taxable investments the 2000s were built on an already corrected base so the changes have been less dramatic.
I have no problem with Menzie’s statistics because more than anything they demonstrate that both the Republican and Democrat congresses have simply continued in their failure to release the productive capacity of the US citizen and have increased the confiscation of wealth by and for the politically connected. This should be another alarm especially when we compare the US growth to the rest of the world. Obviously the current US political class is failing us.
It’s difficult to compare economic records of the past two administrations since the current administration had a series of economic shocks to deal with (internet stock bubble, 9/11, anthrax, SARS, Afghanistan war, Iraq war, high oil prices, Enron scandal and subsequent Sarbox burdens,subprime mortgage and real estate bubble).
What is apparent is how well the 2003 tax cuts targeted at small business and investment really lifted the economy in spite of all these ongoing shocks. Any deficit problem appears to be caused by increased government spending rather than a loss of revenue due to tax cuts or poor GDP performance during this administration.
Well, I lived through the 1990s, and I was paying attention.
The Clinton economy didn’t really take off unitl the Asian financial crisis caused oil prices to collapse.
Remember when Ford was an allstar company? It was the late 1990s that Ford had blockbuster products like the Explorer and the Expedition. Both vehicles were successful because oil was at $10 a barrel in ’98.
In effect, the Clinton economy was the beneficiary of a huge supply side tax cut that it was in no way responsible for.
Now, we are in a completely different situation. Commodities prices are like a supply side tax increase.
Yet we still had 3.9% growth last quarter.
Maybe we should take Menzie’s post and flip it on its head. The only thing keeping this economy going is a huge fiscal stimulus from the ’03 tax cuts and federal spending. We know that current policy is WAAAY more stimulative than Clinton policy, AND STILL the economy is not growing as fast “as it should” (reading into Menzie’s motives for the post).
But with 10 year T-bills at 4.21%, why on earth would we not want to deficit spend our way out of any slowdown? The demand for “safe” investments is huge. Shouldn’t the Feds cater to
Congress should double up. Eliminate the AMT for all, wihtout ANY offsetting tax increases. And make the ’03 tax cuts permanent.
Given that during the last expansion, oil was actually flat to dropping, while in this expansion oil has risen from $20 to $95, I would say that we are doing remarkably well this time.
Menzie-
As illustrated by the comments, it is difficult to compare expansions, because all else is never equal. DickF, Dean, Buzzcut and GK all raise good points. CoRev points out that simply taking the first 7 years of each administration does not align the expansions.
We may productively debate micro questions, such as the current price of oil. The big macro questions, like the behavior of the US economy over multi-year period, involve many, many moving parts, and debate is less fruitful.
Dean: What is apparent is how well the 2003 tax cuts targeted at small business and investment really lifted the economy in spite of all these ongoing shocks.
It’s curious how the tax cutters seem to have disappeared the much larger tax cut of 2001. It’s lingering effects on the deficit are huge yet it’s benefits on the economy are almost invisible.
Dick: There is another difference between the previous recovery and the current recovery. The Reagan supply side revolution that built the tax foundation for the 1990s was huge.
Funny, have you forgotten that Reagan cut taxes once in 1981, but then increased taxes twice in 1982, once in 1983, again in each of 1984, 1985, 1986 and finally in 1987. And of course Bush 41 famously continued the trend setting up the Clinton administration nicely.
Buzzcut: In effect, the Clinton economy was the beneficiary of a huge supply side tax cut that it was in no way responsible for.
Have you forgotten that the Clinton economy only began to take off after what conservatives called “the largest tax increase in human history” in 1993 that would “destroy the economy”?
There is really no point in arguing with the supply-side disciples. Facts have no more effect than they do on creationists that deny evolution. It is a philosophy based purely on religious faith.
Joseph,
yes, for BOTH sides. As is common for many things, there is a bit of truth for both sides to cling.
CoRev: yes, for BOTH sides. As is common for many things, there is a bit of truth for both sides to cling.
Well, that “pox on both their houses” stuff is a bunch of nonsense. As Krugman is known for saying, it’s ridiculous to have a headline that says “Shape of earth: Views differ.”
Supply siders’ belief that tax cuts pay for themselves deserve no more discussion than the idea that the earth is flat. It is a complete waste of time and effort. The fact that all of the Republican candidates for the presidency have endorsed this view should make them subjects of ridicule. Instead they are taken seriously in political discourse and that’s bad for the country.
Joseph,
So if tax cuts don’t pay for themselves, then tax increases do not shrink revenue, by your logic.
So, what is the topmost personal income tax bracket that you would like (currently at 35%)?
Guess who the more economically savvy people voted for in the 2004 Presidential election. Note that this includes even the $50K to $75K tax bracket.
Joseph, if economics or even politics were a single variable issue (flat versus round) then your argument MIGHT make sense. But politics and economics are far more nuanced, and to deny that is, well denial.
BTW, the only one bringing up the Laffer curve, tax cuts pay for themselves is you. I guess in your non-nuanced world during times of recession you would raise taxes, or just add to the deficit with Federal spending. Why take away one of your weapons for fighting the recession, lower taxes, because you disbelieve the Laffer curve?
Joseph,
Unfortunately the 2001 tax cut contained provisions that had no impact on savings and investment (short term focus on rebates and credits). In addition the pro-growth provisions, such as lower income tax rates were to be phased in over a 10-year period. The whole point of the 2003 tax cut was to accelerate all the phased-in tax cuts and to add the capital gains and dividend provisions that were excluded in 2001. Bottom line, the 2003 tax cut (not the 2001 cut) included significant reductions in marginal tax rates on work, saving, and investment.
Lessen learned – some tax cuts are better than others. Tax cuts that incent productive behavior (supply side) provide economic benefits while handouts (demand side) have little lasting effect.
Dean,
Great to read a fellow supply sider.
Cato has a new study with a summary here. http://www.cato.org/pubs/tbb/tbb_1107_49.pdf
Excerpt:
Tax Rates and Tax Revenues
Britain and the United States launched the corporate tax cut revolution in the mid-1980s. Since then, every major nation has cut its corporate tax rate. In the European Union, the average corporate tax rate has fallen from 38 percent to 24 percent since 1996. Further cuts are in the pipeline in Britain, Germany, and other countries. Canada has announced a cut to its federal corporate rate from 22 percent to 15 percent. The United States is lagging behind with a combined federal and state rate of about 40 percent.
Political consideration seem to infect most analysis of supply side tax cuts as the analyst attempts to demonstrate that the cuts do not pay for themselves, but government never demonstrates that tax increases pay for themselves but even when they admit to “accidental” tax increases such as the AMT congress demands that any fix must increase taxes elsewhere to maintain the projected revenue from the mistake. Typical of the political class. In truth tax increases above point E on the Laffer Curve not only do not pay for themselves but as the anti-Laffer Curve data shows they reduce revenue by a factor depending on where the tax structure is on the Laffer Curve.
And what is not always realized is that a growing economy will increase the demand for money and will control inflation. The current problems with US FOREX is not just a money supply problem. It is a business investment and growth problem. The entrepreneurs of the world are beginning to see that other economies are more attractive than the US economy. The trend is unmistakable.
If we are going to return to our leading economic role in the world we must re-learn what we taught the rest of the world. Lower taxes bring prosperity … and a higher GDP.
Joseph wrote:
Dick: There is another difference between the previous recovery and the current recovery. The Reagan supply side revolution that built the tax foundation for the 1990s was huge.
Funny, have you forgotten that Reagan cut taxes once in 1981, but then increased taxes twice in 1982, once in 1983, again in each of 1984, 1985, 1986 and finally in 1987. And of course Bush 41 famously continued the trend setting up the Clinton administration nicely.
Joseph,
When I became a corportate tax accountant I was curious so I counted the number of tax brackets in 1980, corporate and personal. I do not remember the numbers exactly but there were something like 96 total tax brackets.
Reagan restructured the tax system so that there were only three tax brackets from individuals. This is the base that we still have. Yes, the tax hawks have increased taxes but they have started from a much lower base, a base created by Reagan.