And forecasts in general
The Administration released its budget proposal yesterday. Others have dissected the implications [1] [2] [3]. Here I want to focus on the Administration forecast.
The forecasts, and comparisons against alternatives, are presented in Table 2-2 of the Analytical Perspectives of the Budget.
Table 2-2 from FY2013 Budget, Analytical Perspectives.
One important fact to remember is that the Administration forecast (from the Troika of Treasury, OMB and CEA) was “locked down” in mid-November. That would mean that the forecast was finalized before the disappointing advance release for 2011Q4 GDP, but also before the relatively positive January 2012 employment release. We can place the Administration forecast in context by plotting the implied GDP (log) levels associated with the Administration, January Blue Chip and Fed forecasts.
Figure 1: Log actual GDP (black), Administration forecast (red), Blue Chip (blue), and January Fed central tendency high and low (gray). Since only Q4 q4/q4 growth rates are reported, the q4/q4 growth rates are assumed to hold throughout the corresponding year. NBER defined recession dates shaded gray. Source: FY 2013 Budget Analytical Perspectives, NBER, author’s calculations.
The Administration forecast is above the Blue Chip forecast, but roughly at the top end of the Fed’s central tendency.
Figure 2: Log actual GDP (black), Administration forecast (red), Wall Street Journal mean (blue), and WSJ 20% trimmed high (Shephardson/Hi Frequency) and low (Sterne/Econ Analysis) (gray). Since only Q4 q4/q4 growth rates are reported, the q4/q4 growth rates are assumed to hold throughout the corresponding year, except for WSJ over 2012. Trimming is applied to only those respondents that provided 2012-2014 growth rates. NBER defined recession dates shaded gray. Source: FY 2013 Budget Analytical Perspectives, WSJ February survey, NBER and author’s calculations.
Figure 2 plots the Administration forecast as well as the mean and 20% trimmed hi/low range from the WSJ February survey. Since the February forecast is conditioned on the 2011Q4 release, it starts at a lower level than the Administration forecast which (conditioned on mid-November data) predicted a slightly higher level of output than estimated in the 2011Q4 advance release. Even so, the Administration forecasted level is below the trimmed high in 2013-2014 (clearly, it would have been farther below the actual high in the WSJ survey).
Forecast Accuracy
Prakash Loungani had a timely piece on forecasting a couple weeks ago (especially given the possibility of negative shocks emanating from Europe or the Persian Gulf), In it, he noted:
With my colleagues Jair Rodriguez and Hites Ahir, I’ve since looked at the record of forecasting recessions over the decade of the 2000s and during the Great Recession of 2007-09.
Let’s consider the 2000s first and restrict attention to forecasts for twelve large economies — the G7 plus the ‘E7’ (emerging market economies–Brazil, China, India, Korea, Mexico, Russia and Turkey), which together account for over three-quarters of world GDP.
There were a total of 26 recessions in this set of countries. Only two recessions were predicted a year in advance and one of those predictions came toward the turn of the year. Requiring recessions to be predicted a year ahead may seem like an unreasonably high bar to set.
…
Moreover, while forecasters increasingly started to recognize recessions in the year in which they occurred, the magnitude of the recession was underpredicted in the vast majority of cases. For instance, even as late as December of the year of the recession, the forecast was more optimistic than the outcome in 15 cases.
Figure 1 illustrates this point.
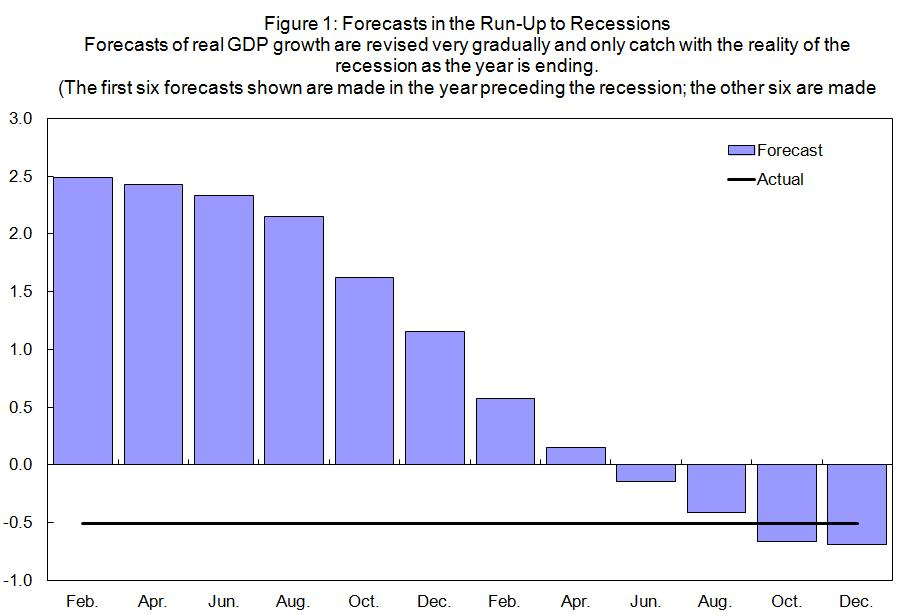
Figure 1 from Loungani (2012).
That being said, I think his take-away is relevant:
The failure to predict recessions does not mean that forecasts of economic growth have no value. But it does suggest that users of forecasts might be better served by paying greater attention to the description of the outlook and the associated risks than to just the central forecast itself.
Reassuringly, it is becoming more common to show how much uncertainty there is about whether the central forecast will come true. It is particularly useful to be explicit about the downside risks to a growth forecast as it can provide a wake-up call for policies and actions needed to keep those risks from materializing.
So, even though there are increasing signs of a durable, albeit slow, recovery, it would be a mistake to take the central tendency of any forecast too seriously. In particular, given the clearly evident downside risks, it would be a big mistake to withdraw stimulus too soon; the payroll tax reduction and the extension of unemployment insurance are critical in this regard. An assessment of what these types of measures can do is recounted here. As CBO notes, these types of measures have potentially the biggest per dollar impact.
Loungani’s other work on forecasting is also relevant, given the foreign sources of uncertainty. From Information Rigidity in Growth Forecasts: Some Cross-Country Evidence (with H. Steckler and N. Tamarisa):
First, there is considerable sluggishness in revisions of growth forecasts. This is consistent with the sticky information models of Mankiw and Reis (2002), the imperfect information models of Woodford (2002) and Sims (2003), and behavioral explanations for forecast smoothing (Nordhaus 1987, Nordhaus and Durlauf, 1984, Fildes and Stekler, 2002).
Second, the sluggishness in forecast revisions declines during recessions and banking crises. We find that forecasts in the year preceding a year of recession start to depart from the unconditional mean, and the pace of revision picks over the course of the year of the recession. A similar pattern holds for banking crises. These finding supports models with state-dependent acquisition of information (e.g. Gorodnichenko 2008).
Third, we confirm the finding of sluggish adjustment in a multivariate setting, by estimating a seven-country VAR model for forecast revisions. The seven economies are the so-called G-3 (U.S., Germany, Japan) and the BRICs (Brazil, Russia, India, China) Forecasters are somewhat slower in absorbing news from other countries than own-country (or domestic) news. Forecasts for non-U.S countries, particularly those for Germany and Japan, are generally slow to absorb news from the U.S. There is also a tendency to absorb news from China at a very sluggish pace.
Comparing Models in Forecasting
Volker Wieland and Maik Wolters provide some additional information regarding the relative accuracy of DSGE and old-style Keynesian macroeconometric models, in their Vox article “Macroeconomic model comparisons and forecast competitions”:
… we propose a comparative approach to macroeconomic policy analysis that is open to competing modelling paradigms. We have developed a database of macroeconomic models that enables a systematic comparative approach to macroeconomic modelling with the objective of identifying policy recommendations that are robust to model uncertainty. This comparative approach enables individual researchers to conduct model comparisons easily, frequently, at low cost, and on a large scale.
The macroeconomic model database is available to download from www.macromodelbase.com and includes over 50 models. We have included models that are used at policy institutions like the IMF, the ECB, the Fed, and in academia. The database includes models of the US economy, the Eurozone, and several multi-country models. Some of the models are fairly small and focus on explaining output, inflation, and interest-rate dynamics. Many others are of medium scale and cover many key macroeconomic aggregates.
…
We use two small micro-founded New Keynesian models, two medium-size state-of-the-art New Keynesian business-cycle models — often referred to as DSGE models — and for comparison purposes an earlier-generation New Keynesian model (also with rational expectations and nominal rigidities but less strict microeconomic foundations) and a Bayesian VAR model. For each forecast we re-estimate all five models using exactly the data as they were available for professional forecasters when they submitted their forecasts to the SPF. Using these historical data vintages is crucial to ensure comparability to historical forecasts by professionals. We compute successive quarter-by-quarters forecasts up to five quarters ahead for all models.
Predicting the recession of 2008–09
Figure 1 shows forecasts for annualised quarterly real output growth for the recent financial crisis. The black line shows real-time data until the forecast starting point and revised data afterwards. The grey lines show forecasts collected in the SPF and the green line shows their mean. Model forecasts are shown in red. While data for real GDP become available with a lag of one quarter, professional forecasters can use within-quarter information from data series with a higher frequency. In contrast the models can process only quarterly data. To put the models on an equal footing in terms of information with the forecasts of experts, we condition their forecasts on the mean estimate of the current state of the economy from the SPF.
Here is Figure 1.
Figure 1 from Wieland and Wolters(2012). Mean SPF is mean of forecasts from Survey of Professional Forecasters.
Wieland and Wolters conclude that old style Keynesian models are not necessarily to be favored, assuming that their use predominates in the Survey of Professional Forecasters.
I would note that at least the mean SPF predicted a growth deceleration as of 2008Q2, while all the newer vintage models continued predicting acceleration. On the other hand, the newer vintage models did catch the growth rebound better. This characterization is even more true for forecasts starting in 09Q1 or 09Q2. However, for forecast horizons that extend to mid-2010, the SPF seems to me (eyeballing) to do better at matching the deceleration of growth (see their Figure 2).
Further, these are growth rate forecasts; perhaps these are the most important. But as Morely has pointed out, oftentimes we are interested in levels. The treatment of trends then becomes critically important, as discussed at length here (see specifically Morley (2010) and Tovar (2008)).
Forecasts are generally lagging indicators, both for principal and agent reasons. On the agent side, people tend to have an experiential bias (see my article, “Rigs, Recessions…”). Thus, there is a tendency to extrapolate current conditions, whatever they are. (This is also the argument against accepting the futures curve as a forecast.)
On the principal side, it’s scary to make falisfiable forecasts. So for career reasons, there’s a tendency to stay close to the consensus view. Thus, forecasts will tend to follow, rather than lead, events. They only look good in times of stability.
And of course, the CBO forecasts are pure nonsense. Real GDP growth of 3.6%, 4.9% and 4.2% in 2013-2015? While reducing oil consumption by 1.5% per year? The US would have to become 16% more oil efficient per unit of GDP in just three years. Is that plausible?
And then there’s no recession for 15 years in that forecast. That’s three times the historical average. It’s not the Great Moderation anymore. The oil surplus from 1984 was consumed by 2004.
When exactly does a Kenysian apply austerity? I always thought this occurred when GDP growth became positive. But it’s been positive for almost three years now. What is the number or event that triggers austerity in the Kenysian world, as a practical matter?
Steve Kopits When exactly does a Kenysian [sic] apply austerity?
When the clearing interest rate is positive. That’s when it will be time to throttle back the fiscal stimulus and allow monetary policy to take over. And we should continue with an expansionary monetary policy until we close the output gap.
Do the Blue Chip forecasters have names? Many years ago I remember reading a study in one of the econ journals (it may have been Econometrica) in which the “Blue Chip” forecasters were broken out by academic forecasters and private forecasters. Neither group did very well, but academic forecasters slightly outperformed private forecasters. The study looked at forecasts over time, so over the years the names changed, but the pattern still held.
Steven Kopits: I’m not certain what a “Keynesian” would do — not many macroeeconomists I know would fit into the category of Keynesian as I learned it in graduate school. However, those of us who hew to something like the neoclassical synthesis (the aggregate demand/aggregate supply framework), perhaps with forward looking expectations formation process, would argue for cutting spending and raising taxes when output exceeded potential, or when the trajectory of the economy was such that exceeding potential was imminent.
“President Barack Obama called for $1.4 trillion in fresh revenue from Americans at the top of the income scale, proposing higher taxes on wages and investments and limiting breaks for retirement savings and health insurance.”
“In what he billed a bid for tax fairness and deficit reduction, Obama reversed his previous policy of taxing dividends more lightly than wage income. The budget plan would raise $206.4 billion over 10 years by treating dividends as ordinary income for married couples making more than $250,000 a year and individuals making more than $200,000.”
http://www.bloomberg.com/news/2012-02-13/obama-s-budget-plan-proposes-doubling-dividend-tax-in-focus-on-the-wealthy.html
**************
Perhaps I’m reading this wrong, but it looks as if Obama’s proposal would have a suppressing effect on the economy because:
1. nearly half of Americans don’t pay federal income taxes and are probably not doing much stimulating of the economy anyway.
2. those paying most of the federal income taxes would be paying even more [fairness doctrine] and would have less disposable income to stimulate the economy.
Therefore, it looks like Obama’s long-term plan is to take economic stimulation out of the hands of individuals and further increase the role of the federal government in stimulating the economy through new solar energy projects. Sorry….
But that is the crux of the philosophical dispute over taxes and government spending. If you are intellectually invested in Keynes, you choose Obama’s approach; if you are intellectually invested in Hayek, you don’t.
I agree with Steven Kopitz’s initial post. Forecasts are predicted by the data rather than a leading indicator of it. We would regard this as an unacceptable standard for a weather forecast (“as you can see from looking out of your window it is raining, and my forecast is therefore for rain — unless it stops”), but we think it’s absolutely fine for economic forecasting and even have sophisticated names for theories for why we can’t look past our nose.
US Aggregate Federal Debt is now about 130% of GDP. Financial Restructuring (default) is now taking place via bond market manipulation that depresses government bonds yields below the rate of inflation. Real austerity and financial repression are just around the corner — We’ll just have to wait until after the November elections.
The focus on forecasts simply diverts our attention from real solutions. Obama’s answer to entitlement problems is to tax the “rich” and make a few cuts to discretionary spending.
His “budget” that Harry Reid will never bring to the Senate floor is nothing more that a campaign ploy that allows him to save face with his constituents.
The Buffet Rule? Please…
I am amazed that people don’t understand that business onwers (shareholders) have their share of business income taxed twice. Once you accept the fact that a shareholder is the owner of a firm and owns the firms profits, then it makes no sense to tax their income at the corporate rate before they receive it, then again at the individual rate after they receive it.
Why don’t we allow dividends to be expensed like operating expenses, or interest? Then a tax at the individual rate makes sense. However, to tax income that ends up as a dividend at 35% before the dividend is paid and then tax it again at 30% to 40% after it is paid, is an effective 65% to 75% tax on the income of businesss owners (shareholders).
tj: Some of us actually have an interest in the art and science of forecasting. Sorry to bore you.
Ah, yes, the forecasters.
It was only 16 months ago that the CBO was telling us that the deficit would be 3% of GDP next year.
How’s that working out for them?
Ironman,has not been participating since long.
On the duress of forecasting:
How Good Are Earnings Forecasts?.
http://politicalcalculations.blogspot.com/2012/01/how-good-are-earnings-forecasts.html
They are not good either,but can be ordered to be better at time of necessity (just a matter of accounting).
Menzie,
I think to put the art and science of forecasting in perspective, you should plot the Q4 2006 forecasts by the above groups for the period 2007:Q1-2010:Q4 vs the actual.
If your point is that WH forecasts are reasonable compared to the forecasts above, then point made.
My point is that you choose to disect the forecasts rather than the policy within the “budget”. If this was a Republicant “budget” you would delve into the policy, which, by the way, I always find educational.
A couple of years ago I was working on a forecasting project involving regions in Europe, and I took a VAR-based approach followed by simple regressions to link the main variables we were forecasting to other variables of secondary importance. My forecasts certainly looked plausible and just as reasonable as forecasts we had been producing using structural models similar to “old Keynesian” macro models.
But as my mentors explained and emphasized to me, decision makers typically care just as much about the narrative behind a forecast as the point estimate of the forecast itself. For a risk manager at a bank or the CEO of a company, knowing that GDP is going to grow 2.7% next year or that the UER is going to fall to 8.1% is slightly useful. But what they really want to know is WHY the economy is going to grow in the 3% ballpark instead of the 4 or 5% range of past recoveries or WHY the unemployment rate is going to take so long to recover. Perhaps most important to them is to know what are the risks to the economy. What is most likely to go wrong and slow the economy? That’s what they spend the most time worrying about.
In short, it’s the story that really matters, not just the numbers.
tj: I do hope to dissect the budget later on, but here is an earlier (2006) discussion of the forecasts of a Republican budget, as point of comparison.
OK. So what school does counter-cyclical spending belong to? In the blogosphere, I think the generally used term is “Keynesian” (or properly spelled, “Kenynesian”). Should we refer to it as something else? Is the proper term “neoclassical synthesis”?
Then we seem to have two interpretations of when “austerity” should be applied: i) when real interest rates become positive; or ii) when actual output exceeds or is anticipated to exceed potential output. (I’ll confess, I prefer the interest rate definition, because it’s pretty easy to determine. Potential output always seemed a bit slippery concept to me.)
If we allow the second definition (output gap), what does that imply in terms of deficits in your view if we accept the CBO numbers? And if there is another recession between now and then, as the historical record would suggest?
Regarding Prakash’s comments:
Turning points are notoriously difficult to predict with conventional forecasting tools. I have migrated to the view that we should take a more constraint-oriented approach to forecasting, where corrections are the result of a constrained factor causing unsustainable distortions in the economy. Thus, the distance between the actual and expected value of a given variable can be viewed as the level of stress in the system, and when certain ratios are violated, a correction can be anticipated.
There are many, many variables which have long-run stable relationships, for example:
– rents to housing values
– median income to median home value
– debt to wealth
– wealth to income
– share prices to GDP
– asset prices to GDP
– energy to GDP
– profits to GDP
– wages to GDP
– inventories to sales
There must be dozens of these, and they don’t appear to be incorporated into economic models. Researching and collecting such relationships into a Book of Ratios might be a worthwhile exercise.
W.C. Varones: Are you forgetting that CBO projects based on current law (which I have repeated ad nauseum on this weblog, so you can’t have missed), or are you being willfully obtuse? If we had eliminated the 2001 and 2003 tax cuts as in the original provisions of the EGTRRA and JGTRRA, then I think we would’ve been closer to the projections for the cyclically adjusted budget balances than we ended up with.
Menzie,
Are you being willfully obtuse?
I don’t care whether you use current law or any set of policy options. The deficit was never going to get to 3% by 2013.
As I said at the time, current law means:
…they assume all the Bush tax cuts expire, AMT isn’t fixed, Medicare cuts payments to doctors, UI isn’t extended, the states aren’t bailed out, etc.
And under that scenario they see robust economic growth.
Good luck with that.
W.C. Varones: I think the biggest component of the projected (as opposed to forecasted) improvement is (and continues to be) allowing the EGTRRA and JGTRRA provisions to expire.
Steve Kopits we seem to have two interpretations of when “austerity” should be applied: i) when real interest rates become positive; or ii) when actual output exceeds or is anticipated to exceed potential output.
Not following you here. There are two ways to stimulate aggregate demand: fiscal stimulus and monetary policy. If you ask me when we should start to relax fiscal stimulus, I would tell you when the clearing interest rate is positive. That’s a signal we can start to lean on monetary policy rather than fiscal policy. Ordinarily monetary policy should be our first option…except that right now monetary policy is weak so we have to rely upon fiscal policy. But we still need an expansionary monetary policy, and monetary policy should stay expansionary until it looks like we’ll push beyond potential GDP; i.e., until we close the output gap.
I’m sympathetic to your comment on predicting turning points. One of the things I’ve always looked at is a change in conditional volatility as a precursor for a turning point. I don’t think I’ve ever seen any actual paper that supports this view, but my (perhaps biased) experience tells me to pay attention when there’s a change in volatility. Maybe JDH has some thoughts on this, since it’s right up his alley.
There are numerouse problems with continuous fiscal stimuli coupled with long term deficit reduction. Theoretically, its sound. However, from a practical standpoint, success depends on the growth. If we slog through 10+ years of 0+/- growth then we never close the output gap and the clearing (real?) interest rate never becomes positive. The result is that Congress will find it easy to vote down the long term deficit reduction legislation every time it comes due. (e.g. Bush Tax Cuts, extended unemployment benefits, payroll tax reduction,…).
We must remain congnizant of the possibility that the growth necessary to justify an end to short term stimulus, and the large federal deficits that accompany it, is sufficiently far in the future that we bury the U.S. under an unimaginably huge mountatin of debt.
Menzie don’t worry about people like Steve and tj. Some people cling to their orthodoxy and ideology like a wet blanket and become inconsolable when confronted with the notion that they lack rigour and data.