I’m just back from Japan, where disappointing GDP statistics have reinforced the fact that the economy is still far from full recovery.
However, like in the US, first reads on GDP statistics are often very noisy, so one shouldn’t get too worked up (while revisions have tended to be downward, post-2008, just like in the US, successful prediction of direction of and acceleration in growth has increased post-2008 [0]).
Still, with exports accounting for a notable share of growth [1] [2], this led me to wonder how much of the exchange rate depreciation that occurred several months ago has remained, and has led to declining export prices faced by other countries. From today’s WSJ RTE, “Prices for Imports From Japan Decline Sharply” (by E. Morath):
Import prices from Japan [to the US] declined 2.4% in July compared with a year earlier, the sharpest 12-month drop since December 2002, according to Labor Department data released Tuesday. The cost of imports from America’s fourth-largest trading partner have trended down for six consecutive months.
Prices U.S. consumers pay for imported computers, cars and other consumer durable goods — all products that are made in Japan — have fallen in the past year.
For more on exchange rate pass through, see here.
Figure 1 depicts the course of the exchange rate against the US dollar (down is a yen depreciation).
This depreciation is not merely a US-Japan phenomenon; the yen has also depreciated on a broad basis, as measured by the BIS’s nominal trade weighted (broad) index.
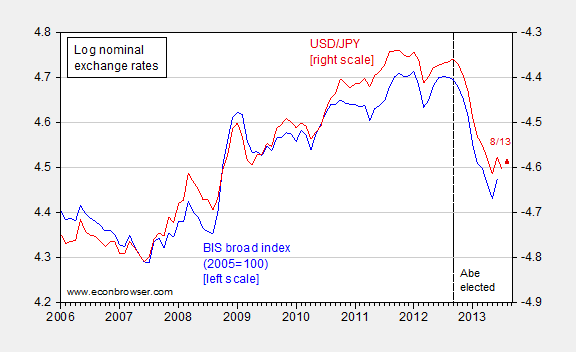
Figure 1: Log USD/JPY exchange rate (red, right axis), August 13 value (red triangle, right axis) and log trade weighted value of Japanese yen (blue, left axis).
Source: Fed via FRED, and BIS.
Now, even with exchange rates moving, it is conceivable (although unlikely) that pass through into export prices would be zero. Profit margins or unit costs could rise to nullify the effect. The second effect in particular has been a worry as imported inputs — especially energy, post-Fukushima — are an important component of production costs (energy imports are typically denominated in dollars,
so a yen depreciation serves to increase unit costs). Apparently, the standard effect dominates in regard to exports to the United States.
How durable has the exchange rate depreciation been? Import costs today are a function of exchange rates in preceding months. Figure 2 shows the real value of the yen over a longer span of time, back to 1990.
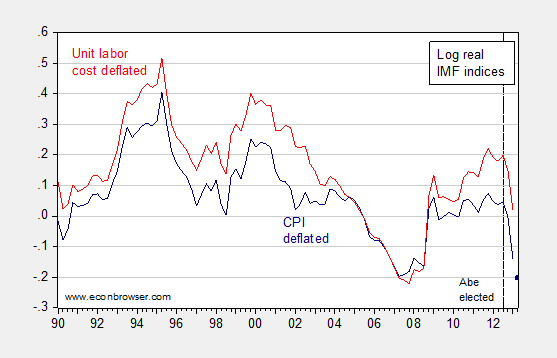
Figure 2: Log CPI deflated value of yen from IMF (dark blue), value for 2013Q2 extrapolated using BIS measure (dark blue square), and log unit labor cost deflated value of yen from IMF
(light red), all 2005=0. Source: IMF, International Financial Statistics, BIS, and author’s calculations.
The data suggest that the real effective exchange rate for Japan has depreciated by about 25% (log terms) since Abe’s election, at least using a CPI-deflated measure (and probably using a unit labor cost deflated measure as well [3].
In Chinn and Kamata (2013), discussed in this post from May, we estimated that holding feedback effects constant,
exports would be about 1.3 percentage points of GDP higher, for a persistent 20% depreciation. One would have to subtract out the increase in imports resulting from higher income to determine the resulting (smaller) increase in net exports. Going the other direction, if the multiplier is greater than one for net exports, then output would be higher yet again, relative to baseline.
Finally, I will note that things in Japan did seem a lot cheaper to me compared to my last visit to Japan fifteen years ago (!). And indeed, statistics — or at least Big Mac prices — confirm my impression.
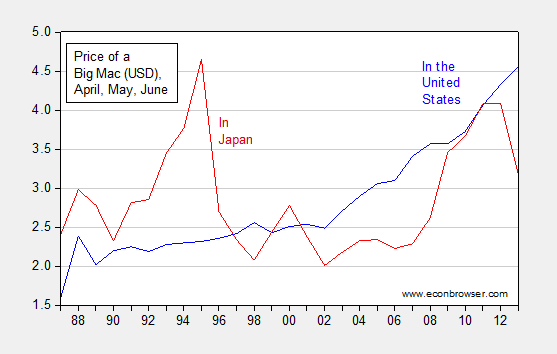
Figure 3: Price of a Big Mac ™ in United States (blue), and in Japan (red), in USD. Note: Surveys take place at irregular intervals, usually in April, May or June. Source: Economist.
While Japanese Big Mac’s are approximately 35% cheaper (in log terms) than a US Big Mac, as of June, that doesn’t necessarily mean that the yen is 35% undervalued (whatever that means). As I’ve noted before [4], the Penn effect implies a lower price level for a lower relative income, even for identical goods, given the presence of nontradable goods. In the sample I have (1987-2013, 24 med- to high-income countries, unbalanced sample), the slope coefficient is about 0.25 on relative per capita income expressed in PPP terms. With Japanese per capita income about 31% lower than US, then the yen is about 27% “undervalued”.
This morning I heard a Bloomberg report that said that Japan was discussing cuts in corporate taxes and that the market was moving up. How strange that markets would welcome tax cuts…NOT!
Menzie, thanks for pointing out the failure of Japan’s debasement of their currency actually leading Japan to decreasing trade. International trade is not dependent in any significant way to exchange rates. A change in a currency does not change the composition or tase of a Big Mac. All it does it revalue it and usually make it more expensive for the citizens of a country. Certainly it makes it cheaper for foreigners, but does it really make sense to burden citizens to subsidize foreigners.
Good post Menzie!
Regional GDP PPP, parity of trade and capital flows between the three regional trading blocs, and Peak Oil and the rising costs of energy imports to GDP for the largest economies reduces, or eliminates, the effects on trade flows from “managing” currency values.
Regional GDP and trade and capital flow parity implies the long-term trend is for the major fiat digital debt-money currencies trending towards, and around, par with one another hereafter.
Japan cannot devalue and export her way out of a Long Wave debt-deflationary regime with higher energy costs, slowing global trade, a nuclear disaster, and demographic drag effects bearing down.
Thanks Bruce! An excellent post demonstrating the absurdity of the idea that currency depreciation will have a positive impact on trade.
Japan is toast. We will follow their course and share their fate.
Lot’s in the post, many issues raised. Many of them can be explained if you think the long slump has led to a glitch in future expectations. The long slump implies a need to do something else with cash coming in than expand, hire, produce, etc. A cushion. Pay down some loans – they still have credit overhangs, which I presume are more than we can see – or maybe start paying on some loans that have sat. That would mirror some of what we’ve seen in Europe and here, where funds have been used to bolster and of course to free funds closer to the institution’s heart (like own account trading). That makes sense and it means the current ideas should have been earlier. I have no idea, however, what that means in managing future expectations
But what confuses me is a drop in local prices when imports should be more expensive and Japan relies so much on both foreign inputs for industry and consumer goods. It’s almost like the old model of Japan keeping down domestic consumption to drive the export machine has flipped over an axis.
So Menzie,
the export “J-curve” appears to have peaked in Q1 2013. Are Abenomics and your forecast model dead, or is there an S-curve miracle about to kick in and save them both?
Just curious if your GDP forecast model is still impervious to falsification by the data like it was in May.
For Ecomedian:
http://ia700509.us.archive.org/9/items/rimshot_739/rimshot.mp3
😀
Bump to have a good lulz that Menzie approved Fed policies have hastened Japan’s inevitable decline.