US, Euro area, and UK GDP Trajectories Compared, and the Expansionary Fiscal Contraction Hypothesis
From Lost Decades: The Making of America’s Debt Crisis and the Long Recovery, by Chinn and Frieden:
Sometimes the government needs to step in to counter economic downturns, and in those instances expenditures should exceed revenues. The deepest recession since the Great Depression required an aggressive response from the government. Otherwise, economic activity would have continued to spiral downward, along with tax revenues, and the government would have ended up in a deeper hole of debt.
In the short term, there was no choice but to act decisively, with temporary tax cuts, spending increases, and transfers to the states. And with the economy growing only modestly as recovery began, too rapid a retrenchment in spending and an increase in taxes could very well be counterproductive, throwing the economy back into recession and further accumulation of debt. However, the politics of countercyclical fiscal policy can be perverse, as the Obama administration found. Recessions hit hardest at poor and working-class families, who would benefit most from stimulative fiscal policy. But attempts to undertake these policies face opposition from upperincome taxpayers who are less affected by the recession and more concerned about the impact on their future taxes. This opposition can impede an effective fiscal response to cyclical downturns.
Jeff Frieden and I wrote those words some two years after the collapse of Lehman Brothers. Now we know with even greater force that pro-cyclical fiscal policies, oftentimes couched as austerity measures, can be highly counterproductive. This can be illustrated by reference to the comparative performance of GDP in the US, which has pursued a stimulative (albeit insufficiently so) fiscal policy, especially compared to the UK, and the Euro area.
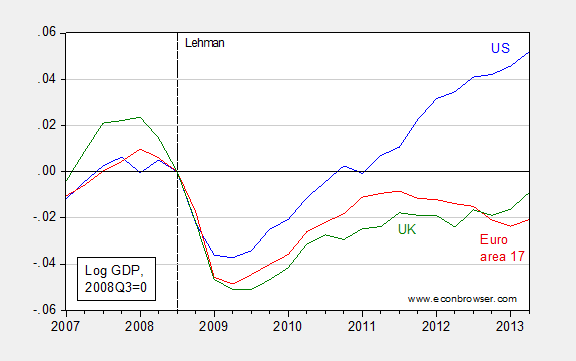
Figure 1: Log real GDP for the US (blue), Euro area 17 (red), and UK (green), normalized to 2008Q3=0. Source: BEA, UK Office of National Statistics, and OECD via FRED, and author’s calculations.
The failure of expansionary fiscal contraction to evidence itself is one of the key outcomes of the experiment that has been conducted over the past five years. But in a way, those of us who were acquainted with the data knew of the unlikelihood these outcomes, as I noted back in 2010.
This is but one lesson learned. Other lessons, I think are: the idea of a self-regulating financial system is a chimera, that quantitative/credit easing does not lead directly to hyperinflation, structural unemployment does not account for most unemployment, and that fiscal policy can be effective in stimulating aggregate demand and hence output. Well, at least most of us have learned them. Others are, like some recalcitrant students, untutorable.
Update, 8:30PM: Reader tj asks which countries have actual declines in government spending. UK government spending in real (CPI deflated) terms declined going from 2010 to 2011 and again going to 2012 (relying on WEO database). For Euro 17, nominal government spending fell from 2010 to 2011;it increased going to 2012, but given CPI inflation, was flat (ECB database). And for the US, here is a plot of real US government spending.
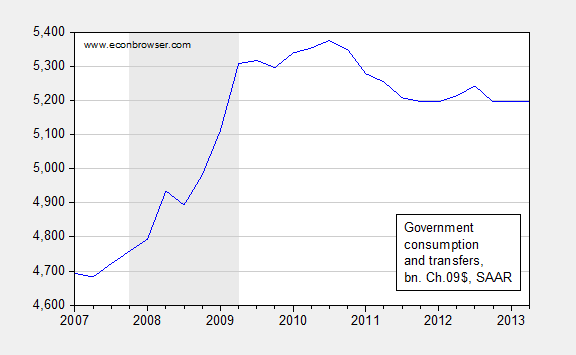
Figure 2: Sum of real government consumption and government transfers deflated by PCE deflator. Source: BEA, 2013Q2 second release and author’s calculations.
So, yes, spending is falling y/y.
Ah, but do the data support the assertion?
Compared to the peak deficit (in 2009 or 2010 for the listed countries), in 2013, the IMF projects that the budget deficit will be lower, in
– Germany: by -3.7%
– Italy: -3.5%
– UK: -3.1%
– US: -6.1%
So, the US has had by far the greatest fiscal consolidation of all the reference countries, and yet the best growth.
But perhaps the post-2011 period is the best measure. After all, the US was trending parallel to Europe until that time, and that’s when they parted paths. So what’s the situation since then (2013 vs 2011 deficit):
– Germany: -0.4%
– Italy: -2.0%
– UK: -1.3%
– US: -2.8%
Again, the US saw the greatest fiscal consolidation, and yet by far the best growth.
So, the data seem to be arguing exactly the opposite of what you’re suggesting. Growth and fiscal consolidation are linked for the sample group.
Oh, and recall that I forecast an OECD recession post the Arab Spring. You can see it clearly in the UK and Euro data you present above.
As for the US, it separates from Europe just as shale oil production soars.
But as we know, oil doesn’t matter! If it did, surely there would have been at least one session on the relationship of oil to the economy in that macro conference you wrote about.
“What is the meaning of a debt to GDP ratio if the GDP is government spending financed by debt?”
Charles Gave, December 2012
“…the Federal Reserve is the epitome of dumb money – devoid of information and deadly to the real assets of the nation.”
KNOWLEDGE AND POWER, George Gilder 2013 commenting on Henry Paulon’s and the FED’s reaction to Lehman Bros. demise.
Which countries had a YOY decline in actual spending?
Thank you, O great teacher.
I compared economic outcomes in two states that implemented contrasting fiscal policies: California, which surged ahead while raising taxes and cutting spending…Menzie Chinn, September 06, 2013, A Tale of Two Fiscal Policies, Continued.
https://econbrowser.com/archives/2013/09/a_tale_of_two_f.html
It appears only Progressive states can pull off – The Amazing! The Stupendous! The Incredible!….Expansionary Fiscal Contraction.
Prof. Mark J. Perry, an economic professor of considerably higher stature than Menzie Chinn, is doing good work at exposing the lies of feminism, particularly in regards to the ‘pay gap’ myth.
Since Menzie Chinn is pro-feminism, he often gets tripped up when his obligation to the profession of economics conflicts with his need to support the lie that women are paid 77% of men for the same output.
Prof. Perry provides useful education on how what feminists believe is economically unsound.
@Steven Kopits- The way I read the graph is that there was separation because the EU flattened out. The US trajectory has been pretty steady.
Steve
Well, OK, Steve. But then the question is, why did Europe flatten out?
Look at the data, and it’s pretty clear the Arab Spring played a significant role. As it did in Japan.
But not in the US. So why was the US different, or, in your terms, what was the difference between the US, Europe and Japan during this period? It certainly wasn’t fiscal policy. US fiscal policy was far more contractionary than Europe policy. So what was it?
David: You’re very welcome!!!
tj: Hmm. Let me see if I can explain this as simply as possible. Suppose dy/dg is 2, dy/dt = -1, where g is govt spending (on goods and services) to GDP in ppts, and t is tax revenue to GDP in ppts. Suppose in both cases, I need to close the budget balance to GDP gap by 1 ppt, in two otherwise identical economies. In one case, I close the gap by 50-50 mix of tax increases and spending on goods and services cuts. In the other, I also target a reduced size of the government-to-GDP ratio by 1 ppt. In which case will one see a larger decrease in output (relative to baseline). Doing the math, with these stipulations, one would find the latter experiences a larger decrease in GDP.
Steven Kopits: First, I wouldn’t use unadjusted budget balances. See this post for an assessment of contractionary policies (structural budget balances, and changes therein). You should also see Chapter 3, IMF World Economic Outlook, October 2010.
Darren: I am frankly mystified by your statement:
Where have I made the assertion attributed to me? Please provide a specific URL.
Menzie
I asked a simple question.
Which countries had a YOY decline in actual spending?
You answered with calculus. A simple list would have sufficed.
So, I will ask again.
Which countries had a YOY decline in actual spending?
Let me phrase in terms that you can understand.
Suppose dg/dt = 2 for any given country in your list, where g = government spending and t equals a period of length t. Assume dt = 1 year.
Which countries have dg/dt relative to baseline
That’s the real issue. Baseline accounting.
dg is always relative to baseline so that dg > 0 even with a “cut”.
Has dg/dt changed since government switched to continuing resolutions from an actual budgeting process? Continuing resolutions just signal spend, spend, spend until you run out of money, then raise the credit card limit. It’s criminal.
Folks would not be so upset with dg if Congress and the president (past and present) followed the traditional budget process.
tj: I was responding to your 9:23AM post. In response to your 7:12AM, well, I thought it was a rhetorical question. I assume you know how to access FRED, and use a spreadsheet.
Stephen Kopits: You ask what is the difference between the US and Europe.
A modern economy requires credit. Credit is created by the banking system, both depository and securitized banking. The predominate constraint on the creation of credit is the bank regulatory capital requirement. Loan and securities losses must be written off one-for-one against bank equity. The banking systems of the US and Europe were both severely stricken by the great credit cycle collapse. The best measure of the capital condition of banks is the market price of their stock. The Philadelphia KBW bank stock index peaked in 2007 at 118, fell to a devastating low, and has since recovered to 65. The capital condition of US banks is still, after four years of recovery, only 55% of what it was at the peak. In Europe, the Stoxx 600 Bank index peaked in 2007 at 539, fell to an even more devastating low, and is now back to 186. The capital condition of European banks is only 35% of what it was in 2007. As the survival risk of being closed down by regulators because of insufficient capital is nonlinear, the condition of banks in Europe is far worse than it looks from this simple 35% to 55% comparison. This is all you need to know to explain the causality underlying Minzie’s graphics. In the multicar train of causality, fiscal austerity is the caboose.
The core concept is leverage. Money and Banking books do not teach this. Europe is massively overleveraged. Take the simple measure of bank assets to national GDP. In nearly every country of the eurozone, the single largest domestic bank in that country has assets greater than that country’s GDP. In Germany, with a GDP of $3.4 trillion, Deutsche Bank has $2.6T of assets and Commerzbank $0.8T. In France with a GDP of $2.6T, Credit Agricole alone has $2.6T in assets and BNP Paribus $2.5T. UBS in Switzerland has $1.3T in assets sitting atop that country’s $1T GDP and scrunching it. In Netherlands, ING has $1.5T in assets against a GDP of just $0.8T. Opps, a single bank nearly twice the size of the economy! And so on. But it is quite otherwise in non-zone countries like Turkey, Poland, Norway, Hungry, and others. You already know where this is going with the UK.
Total assets of all 8,000 banks in the US — $14T. The leverage cycle simply cannot and did not crimp the flow of credit here as it did Europe. Not even close.
For me, a big lesson is that there are kinds of spending and they have different roles. In the UK, for example, overall spending has not decreased because social spending for need has gone up as the economy goes down. But the UK has seriously starved public investment. Other countries in the Eurozone have done the same thing, with public investment in many countries essentially evaporating.
This says to me the long term has been compromised. It’s like not investing in your facilities as a company and then finding your productive capacity has eroded versus your competition.
And this says to me austerity has both inflicted hardship currently and hurt the long term economic prospects, this as Asian competitors have been investing – perhaps over-investing – in their future productive capacity.
Remember the lines: this is the world ends, not with a bang but a whimper. When you run down your productive capacity, you think you’re managing even as you lose the ability to cope. You try to keep up standards – like employees in the sequester – but I’ve watched the long term effects in Detroit: standards drop and expectations drop and then you can’t meet the reduced standard and it becomes a cycle downward.
In this regard, I note that Texas is now on its way to de-paving roads because their road engineers say they need money – like $4-5B – just to keep pace (population growth, heavy truck traffic, etc.) and they can’t get it because that would mean taxes and fees so … they’re going back to dirt roads. Dirt roads.
Thank you JBH and jonathan for providing some rational arguments to the discussion of economic phenomena during a credit crisis…
Continually priming the pump when your credit is already over-extended impoverishes the future. Western Europe, Japan, Argentina, and the USA are in the unenviable position of experiencing the future right now.
tj: I have added the data you requested on government spending in levels.
I see at least three competing explanations for slow growth post-2008:
1/ The lingering effect of the subprime crisis (particularly on the banking system)
2/ The euro-area crisis (both sovereign debt and internal devaluation stories)
3/ The effects of fiscal austerity
The existence of 1/ and 2/ make using a comparison of GDP alone to evaluate fiscal policy as a “natural experiment” invalid.
JBH above provides good reasons why we could argue that the Europe was more sensitive to banking system disruption than the US. In addition, I’d note that banks provide a higher proportion of financing to the corporate sector in Europe than the US (the US has more highly developed securities markets).
I think most people would agree that the Euro crisis would have a larger effect on Europe (and the UK) than the US.
Re: Texas dirt roads, are these the ones you’re thinking should be paved?
http://blog.mysanantonio.com/eagle-ford-fix/files/2013/03/EFLutherAerial.jpg
OK, guys, let’s go back to the original narrative, which goes like this:
Evil US bankers, abetted by the Fed, fueled a US housing bubble which caused Americans to borrow more than they could service, leading to a financial crisis in the US, peaking with the collapse of Lehman Brothers now five years ago. Europe was primarily implicated as a purchaser of bad US subprime bonds.
That’s the standard story line, no?
So, then, why are the European banks in worse shape, if it was primarily a US crisis? JBH: You seem to be making Scott Sumner’s case that monetary, not fiscal policy in Europe is too tight. (See Sumner here, for example: http://www.themoneyillusion.com/?p=21956)
It’s the opposite of what Menzie’s arguing: that fiscal policy is too tight. As much as I understand what Scott is saying, I think his take has more validity.
Be that as it may, Menzie’s thesis is in tatters. If you’re arguing that US austerity is lowering growth, it’s just not there in the data. It’s not even close. If US growth had been the same as Europe, I could still have made the case that tighter US fiscal policy did no harm. But in fact US GDP growth has been 2-3% above Europe’s for the last two years. It’s a really big gap–and the data is coming in dead opposite of Menzie’s thesis.
So if Menzie wants to argue that it’s about cyclical balance or potential GDP, well, he’d better start trotting out those arguments in fine detail. But let me tell you, if I’m a DC decision-maker, the basic narrative is this: Decreasing US deficits did not cause a US recession, did not cause decreased US GDP growth, and in fact (if I believe in the causality) led to faster GDP growth in the US than Europe. That’s the simple read.
Menzie
Interesting, thanks. In general, dy was rising in the U.S. and less negative in in UK/EU, while dg was falling or flat for the US/UK and most of the countries in the EU.
It appears that in the U.S. we can have modest increases in economic growth while at the same time, holding the line on government spending.
OECD Long-Term GDP Growth of 1.5%?
On Monday, I had the opportunity to sit through Statoil’s Energy Outlook presentation at Columbia University. (Bottom line: They don’t know how to do supply-constrained forecasting either.)
Now, the presentation had an interesting slide, which showed average OECD GDP growth at 1.5-1.75% through 2040. (I don’t believe this was a Statoil number. Was it IEA?)
As a practical matter, economists have used 3% as the sustainable deficit for national budgets. This is what’s used in the Maastricht criteria, for example. But if only 1.5% growth can be anticipated, isn’t then the sustainable increase in debt only 1.5%? Should the criteria for sustainable deficits be revised down?
And further, what is then the impact on debt repayment? If a country has debt of 100% of GDP and wanted to reduce it to 60% over, say, 20 years, what would have to happen? Well, it appears the country would have to run a primary surplus of around 1% of GDP every year. And that includes during the three recessions we might expect over a twenty year stretch (or if you’re Europe, the eight recessions, based on the last five years’ experience).
If this where the OECD is headed? And if so, what are the social implications and at time when the baby boomers are retiring? Doesn’t it suggest that the future will look quite different from the past?
JBH:
I’m unsure that the comparison of total assets of international banks with the GDP in their nominal home country is relevant. Not just because assets aren’t the problem (liabilities are) but it only indicates that the big banks all have large foreign assets. Because they have large foreign assets (usually US assets because of the trade deficit) they can be important players in other markets, which means other countries have a vested interest in bailing them out when they get in trouble. The US bailed out many European banks for that exact reason.
Incidentally, leverage follows from comparing liabilities to underlying assets, not from comparing assets to (completely unrelated) income.
Menzie wrote:
Sometimes the government needs to step in to counter economic downturns, and in those instances expenditures should exceed revenues.
Can you name one person in government who will devote the time and effort to any production greater than the entrepreneur who actually produces? If you do not understand that money is a medium of exchange you will never see the flaw in Menzie’s thinking.
Money is a tool to allow traders a common method of evaluating various methods of production so that we can actually eat, clothe, and house ourselves. Money’s purpose is to transmit information to the ones who use money. Money provides invaluable information when it transmits relative prices and investment outcomes. Such money is filled with information and speaks volumns.
Money that is thrown into the economy via the government and debt or through creation by the FED is devoid of informtion. It does not tell you the relative price of anything. Not only that when it is injected into a viable monetary system it distorts the transmission mechanism of money in a real economy. Because money is fungible you cannot tell the difference between smart money and is filled with information about relative value and dumb money that is created by the government that tells you nothing.
Without understanding the purpose and meaning of money you will always be confused by monetary policy and support illusions presented by confused magicians.
SK:
“So, then, why are the European banks in worse shape, if it was primarily a US crisis?”
The big European banks got hit badly by the US-dominated housing crash. They were saved in the same way as US banks, by the US government saving Fannie, Freddie, AIG and the rest of the financial core institutions. But the problem in the US forced a worldwide re-evaluation of government finances. After all, if the government is all what is holding up the economy, the question becomes how well and how long they can do that. This caused the crisis in Europe.
Why only in Europe, when the US government has a far higher debt-to-income burden?
Partially because European countries issue government bonds separately, which means that the default of a single small country is not only possible, it is manageable. Perversely, that makes it more likely to actually happen (and so it has). This is in contrast to a real default on US bonds, which the global financial industry can not survive, and so no one really believes it will ever happen.
Partially, though, there initially was a clear push from politicians in the core European countries to talk up the crisis in the periphery. The reason for this was that the US crisis drove the euro to unsustainably high exchange rates (almost 1.6 USD). The talk of sovereign defaults immediately brought down the euro to a more competitive level – which was the point. Unfortunately the politicians found it extremely hard to steer this crisis, and the euro kept swinging up whenever it looked like things stabilized. Even after the Greek default in October 2011 (sorry, “debt restructuring”), the euro flirted with the 1.4 USD threshold. The collateral damage of all this brinkmanship has been huge, but the euro has finally been brought down to pre-crisis levels without trillions of dollars of additional government debt. It will take a lot more time before we can judge whether this was a success or not.
But clearly the european banks suffered tremendously because they held so much european government debt. The difference, in the end, is that the US government made good on its implicit guarantee of the GSEs, the EU governments did not (although legally the Euro treaty forbade bailouts explicitly, so there really wasn’t a guarantee to begin with). That is why the European crisis is different.
OK, endorendil. Let’s assume I accept your argument. Then it has two possible implications:
i) monetary policy in Europe is too tight, a la Scott Sumner, or
ii) Europe did not engage is sufficient fiscal accommodation specifically for the financial sector, eg, it should have done more to recapitalize its banks.
Either way, you are not supporting Menzie’s thesis, unless you believe that US banks require even more fiscal accommodation, eg, more bailouts. I think the evidence for this is scant. AIG paid back its loan; many if not most of the banks have repaid their TARP funding. So I don’t see the case for further financial injections into the US financial system, do you?
If we agree that, then further general fiscal stimulus appears uncalled for, and deficit reduction can continue. Is that what you’re saying?
Steven Kopits: My argument is in tatters? Let me once again point you to the graphs of structural budget balances in this post. US stimulus as measured by cyclically adjusted budget balances was more stimulative than in the UK, and than in the Eurozone. You do understand endogeneity (due to automatic stabilizers), don’t you (even if you believe in Leontiev production functions, it doesn’t rule out endogeneity)?
“Sometimes the government needs to step in to counter economic downturns, and in those instances expenditures should exceed revenues. The deepest recession since the Great Depression required an aggressive response from the government. Otherwise, economic activity would have continued to spiral downward, along with tax revenues, and the government would have ended up in a deeper hole of debt.”
Why do the sages always have a means of saving the economy but are unable to identify the peril in the first place?
Hans: I don’t know what the sages said, but here are my posts from 2006 and 2007. Many thought all was hunky-dory. I can honestly say I did not.
Menzie –
You mean your post where you write that sequester won’t have any noticeable effect on GDP growth because of endogeneity? Nope, missed that one.
Now, as I understand the real simple version of events, i) an increase in the deficit leads to greater GDP growth around a downturn, and ii) a decrease in the deficit should deduct from the growth rate.
So let’s take the 2010-2013 period for the countries above, and see what we have, starting with the most contractionary fiscal policies:
i) USA: change in budget bal (reduction in deficit as a percent of GDP): -3.9%; GDP growth 6.2%; net swing, 10.1%
ii) Germany: change in bb: -3.7%; growth GDP growth, 4.9%; net swing, 8.7%
iii) UK change in bb: -2.7%; GDP growth, 1.5%; net swing, 4.2%
iv) Italy, change in bb: -2.6%; GDP growth, -2.6%; net swing, 0.1%.
The plain vanilla interpretation of the data is clear: The countries who reduced their deficit the most had the greatest GDP growth. That’s really simple.
Now, I presume by endogeneity you mean that “there was other stuff going on” that was country-specific and unrelated to the deficit. And, of course, you know I agree. Indeed, I would argue that GDP growth appears a bigger driver of the deficit than vice versa for this period. But that’s exactly the point: there is no compelling evidence, at least for the data set above, that growth is reduced by reducing deficits. It’s exactly the opposite.
As for Leontief functions, I presume you are referring to oil constraints. You are well aware that I think oil is taking 0.7-1.2 percentage points off of OECD GDP growth. So I’m on board with the Statoil OECD GDP outlook, although for different reasons than they stipulate (because, of course, they can’t do supply-constrained forecasting which means, for them, that GDP growth is exogenous).
I would add that, for the record, I am more optimistic about longer term OECD growth than that presented by Statoil. Self-driving cars are clearly gaining traction (excuse the pun), and post-2020, they should be in a position to allow electric vehicles to begin to provide mobility without reducing social welfare. So things do get better, but not for a while, most likely.
I think the comparison of the UK to Italy is also telling. Both saw similar levels of deficit reduction, but the difference in three year GDP is 4.3%. Is that the price of Euro membership? Is it really worth it?
In any event, my elevator pitch is clear: If you think deficits drive GDP, then those countries who reduced their deficits quickest saw the best GDP growth.
What’s your elevator pitch?
Steven Kopits Allow me to correct a few of the things you have been saying.
First, it is not true that the Great Recession was caused by evil bankers duping clueless and risky borrowers who couldn’t afford mortgages. The fact that many people who took out mortgages were also high risks should not, in and of itself, have caused any great panic provided those higher risk factors were transparent. The problem is when risk is hidden by loan originators, banks and ratings agencies. If the risks aren’t known, then the assets cannot be priced correctly. There is nothing particularly wrong with lending to risky borrowers provided everyone understands the risks. Most of the blame is on the powers of opaqueness and regulators asleep at the switch. In other words, the monied class supporting GOP candidates.
Second, the housing bubble was not just a US phenomenon. For example, investment flowed from northern Europe to Spain, and consequently Spain had its own housing boom. And in the case of Ireland the government explicitly accepted all of the banks’ liabilities, leaving the taxpayers holding the bag.
Third, the nontechnical definition of endogeneity is that all of the changes are due to the interactions of the variables contained in the system (e.g., as they move towards equilibrium) and not because of shocks that are completely outside of the model (e.g., acts of God, meteors wiping out London, earthquakes shutting down nuclear power plants, etc.).
Fourth, Scott Sumner is an MMT guy and so it’s no surprise that he doesn’t put much stock in fiscal policy. Now Sumner may be right that a sufficiently aggressive monetary policy that targeted NGDP might do the trick without benefit of fiscal policy. But we do know from prior experience that fiscal policy will work, so I don’t see why we should put all of our eggs in one theoretical but untested theory. I have no problem with doing both. In any event, the same crowd that is most up in arms about using fiscal policy isn’t likely to support the kind of monetary policies that Sumner has in mind either.
Fifth, in addition to correcting for cyclically adjusted balances as Menzie recommended, you should also think about simultaneous equations bias in the GDP changes you are citing. The values you are observing are the simultaneous equilibrium results. You need an instrument.
Sixth, regarding sustainable deficits, the deficit of 3% of GDP refers to nominal GDP. The growth rates of 1.5%-1.75% refer to real growth rates. You’re comparing apples and elephants.
Seventh, regarding Leontiev production functions, let me shout out to Menzie: “Yea Verily!” That’s a point I’ve made many, many times myself. A Leontiev production function assumes that the marginal rate of technical substitution is zero; i.e., the isoquants are rectangular. As Joan Robinson pointed out 80 years ago, this makes you a closet Marxist because Marx denied the reality of non-zero marginal rates of technical substitution. You might be interested in this paper:
http://www.crei.cat/people/gali/pdf_files/bgoil07wp.pdf
by Blanchard and Gali that addresses the question why oil shocks in the 2000s have a very different macroeconomic effect than oil shocks in the 1970s.
Finally, Europe is doing badly because they have extraordinarily egocentric and egotistical central bankers and foreign ministers. One of my brothers-in-law is the director of monetary affairs at the State Dept and during the never ending euro crises he practically commuted to European capitals. To those folks the crisis was something almost delicious, where they had the opportunity to scratch their chins and look serious during the day and enjoy expensive cocktail parties at night. I half suspect that they fondly look back on those crisis days as the best of times. Almost in the same way that Sartre was bored with life after World War II.
endorendil
“Partially, though, there initially was a clear push from politicians in the core European countries to talk up the crisis in the periphery. The reason for this was that the US crisis drove the euro to unsustainably high exchange rates (almost 1.6 USD). The talk of sovereign defaults immediately brought down the euro to a more competitive level – which was the point.”
Although I agree that 1.6 USD per euro was unsustainable, I am much less sure that the crisis in the euro peripheral was talked up to bring the euro down. In my view, the euro is still too high, and the sovereign debt crisis is still very real and will come to a head if the debtors come to realize that paying back their debt while maintaining an unrealistically high foreign exchange rate is a fool’s task. Even if they get a “restructuring” free pass (like Greece), they will continue to suffer from a non-competitive exchange rate if they stay in the euro bloc. The euro is being kept high by the fed’s policies, which are creating a dollar carry trade much like the yen carry trade that was created by Japan’s zero rate policies in a previous decade. Only instead of Ms Watanabe, we are seeing highly levered U.S. financial institutions engaging in the trade.
Steven Kopits: No, by endogeneity, I meant the budget balance depends on automatic stabilizers…hence, one should not look to the budget balance as a summary measure of fiscal policy, but rather to a fiscal impulse measure (i.e., cyclically adjusted balance). (This is 3rd lecture in undergraduate intermediate macro…)
Steven Kopits: See this post for the relationship of interest, purged of endogeneity by way of use of cyclically adjusted budget balances.
Thank you most kindly, Professor Chinn!
I will read your links when time permits…
Menzie –
I’m not sure I see the relevance of the point. I said nothing about the composition of the deficit, only its aggregate size.
You write: “The failure of expansionary fiscal contraction to evidence itself is one of the key outcomes of the experiment that has been conducted over the past five years.”
Except that’s not what the data shows. The data shows that expansionary fiscal contraction in fact worked, if I am to take a purely statistical view of the matter for the countries I surveyed.
And keep in mind I’m not necessarily a fan of expansionary fiscal contraction. But the data show that countries whose deficits closed the fastest also grew the quickest.
Now, if you have two paragraphs explaining–and let’s take it back to the very first lecture in the course–why I should consider the US’s fiscal policy more expansionary than that of Europe, since 2010, well, let’s hear it.
Slugs –
I didn’t say the recession was caused by evil bankers. I said that’s the standard narrative. I have said that the recession was caused by i) Blame it on Beijing, and ii) an oil shock. As you indicate that the housing bubble was not just a US phenomenon, you also must believe in something global, for example, the role of Chinese liquidity in reducing interest rates and creating an asset bubble.
Leontief functions. We’ve discussed this before. The relationship of oil to the economy is through the pace of efficiency gain. This does seem to be subject to real world limits. Just because the rate of substitution is not zero doesn’t mean it’s infinite either. So, if you have to reduce consumption of oil at a 1.5% pace, and the maximum, sustainable, non-recessionary efficiency gain is 3%, then by definition your GDP growth will be capped out at 1.5%. Which is the same number that Statoil presented as forecast OECD GDP growth to 2040. Get it? By the way, if you’re a macroeconomist and you don’t understand this, you will be lost in the wilderness. You’ll chronically be over-forecasting GDP growth, just as the Fed, IMF, CBO and others have been doing. That’s why I get bent out of shape when there’s a macro conference without so much as a word on oil. But the Menzie’s of the world don’t understand why OECD oil consumption will decline. (Well, why should they? Exxon doesn’t.) Nor do they any clue as to what the pace of sustainable efficiency gain might be. (Jim excepted.) As such, they simply do not have any model at all for thinking about the impact of oil on the economy outside a Blanchard and Gali type of framework. But theory’s moved on, guy.
Speaking of B&G, I read the article you linked years ago. And the paper was also written years ago, before the Third (Great Recession) and Fourth (Arab Spring) modern oil shocks. It’s a quite dated paper. These analyses typically are built on oil supply shocks under conditions of price inelasticity. What we’re seeing now is chronic and differentiated demand pressures (shocks, if we were talking about an acute situation) under conditions of price elasticity. B&G didn’t write about that.
As for Europeans. Having lived there for many years myself, I have some feel for the continent. It is not as entrepreneurial as the US, to be sure. But the real question is why the US diverged from Europe after Q2 2011. If you think French bankers were the cause, well, I have my doubts.
@SK
“Either way, you are not supporting Menzie’s thesis, unless you believe that US banks require even more fiscal accommodation, eg, more bailouts”
I reacted on your use of the European banks as an argument in the debate on monetary policy. Their problems do not have the same cause, and are therefor not a fair comparison on the subject. You need to find a better argument.
“In my view, the euro is still too high, and the sovereign debt crisis is still very real and will come to a head if the debtors come to realize that paying back their debt while maintaining an unrealistically high foreign exchange rate is a fool’s task. ”
I agree that the sovereign debt crisis is real in a couple of countries – including the US. No argument there. It was insane that for much of a decade sovereign risk in Greece and Germany was considered the same.
The euro is high, probably because there isn’t much more that European leaders can do to weaken it without resorting to the proverbial printing presses, which is something the European public on the whole will not accept.
I am entirely unsympathetic to the argument that being in the euro block means that the peripheral countries are somehow stuck with a less than ideal exchange rate. It’s boilerplate triteness, and it is as true for most individual US states as it is for any eurozone country. Yes, the euro is too weak for Germany, too strong for Greece. It used to be the other way around. Structural reforms (like the push to raise German wages and the push to privatize much of Greece’s economy) can help moderate these differences, and some saner behaviour from the financial sector in pricing relative risk will go a long way too. But part of this is permanent: there is no way that an economic block of over 300 million people can get a single monetary policy that’s right for all.