“U.S. gasoline prices have fallen to their lowest level in nearly 33 months amid a boom in domestic oil drilling”, the Wall Street Journal declared last week. That’s a true statement, but there’s more to the story.
Americans are indeed facing the lowest gasoline prices in almost three years, but not by much. The price of gasoline last December was almost as low as it is now, as it also had been in December 2011. The fact is, U.S. gasoline prices are usually lower in the fall and winter than they are in the spring and summer due to seasonal variation in gasoline demand and fuel formulations.
 |
The long-run determinant of the price of gasoline is the price of crude oil, which does not change much between summer and winter. The price of West Texas Intermediate has fallen from its high in September, but is still above the values we saw most of last year.
 |
Limits to U.S. pipeline capacity for crude oil cause the price of WTI in the central U.S. to differ from the world price of similar crudes such as North Sea Brent. Because we have adequate facilities to transport refined products, gasoline sold in the U.S. tends to track the world price and follows Brent more closely than it does WTI. Brent is down more modestly from its September high.
 |
I’ve often used a simple summary of the long-run relation (described by academics as a “cointegrating relation”) between the U.S. retail price of gasoline and the price of crude oil, according to which a $1 decrease in the price of Brent is typically associated with a 2.5 cents decrease in the price of gasoline. The drop in the price of Brent from around $108 at the end of September to $104 the week ended November 8 (the last week shown in the graph below) could explain a drop in the price of gasoline of about 10 cents a gallon. Over that same period, the actual price of gasoline fell about 30 cents. So the long-run relation would attribute most of the decline in gasoline prices this fall to seasonal factors.
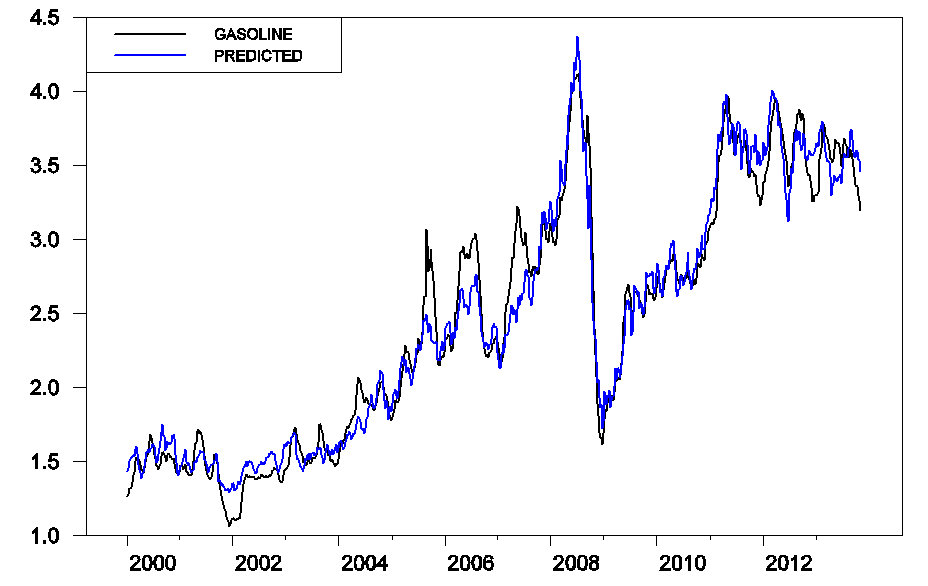 |
Here’s a little calculator courtesy of Political Calculations that you can use to get the predicted gasoline price plotted in blue in the graph above. Just enter the current price of Brent to see the predicted gasoline price.
Here's a self-updating reference to the current Brent price, where you can see the bad news. As of the end of last week, Brent was back above $108, wiping out most of the relief in crude prices since September.
And here is a self-updating plot of the average U.S. retail gasoline price.
|
|
| New Jersey Historical Gas Price Charts Provided by GasBuddy.com |
So why hasn't the surge in U.S. production of crude oil brought any real decrease in the price of oil and gasoline? The answer is pretty simple. If you leave out the growth in shale oil production from the U.S. and oil sands production from Canada, total field production of crude oil from the rest of the world combined actually decreased between 2005 and 2012. Given the increase from the U.S. and Canada, global production managed to increase by 2 million barrels a day over the period, but that's less than the growth in consumption from the emerging economies and oil-producing countries over those same years. That's why the world price of oil went up, not down, despite the growth in production from the U.S. and Canada.
The boom in domestic drilling is bringing some real benefits to the U.S. economy. But a lower gasoline price for U.S. consumers isn't one of them.
Here are some numbers I put together, based on Steven Kopits’ excellent work*.
The cumulative increase in global crude oil (Crude + Condensate) production, in the seven year period from 1998 to 2005, in excess of what we would have produced at the 1998 production rate of 67.0 mbpd (million barrels per day, EIA), was 6.3 Gb (billion barrels).
Steven Kopits estimated that cumulative global upstream (oil exploration and production) capital costs were $1.5 Trillion in the seven year period from 1998 to 2005. So, the total capital cost per net cumulative barrel of increase in production from 1998 to 2005 (relative to 1998) was about $300 per barrel.
Of course, the total upstream capital expenditures were used to both offset declines from existing production and to show a net increase in production, but I am primarily interested in the difference between the 1998 to 2005 increase in global crude oil production versus the 2005 to 2012 increase in global crude oil production.
The cumulative increase in global crude oil production, in the seven year period from 2005 to 2012, in excess of what we would have produced at the 2005 production rate of 73.6 mbpd (million barrels per day, EIA), was 0.3 Gb.
Steven Kopits estimated that cumulative global upstream capital costs were $3.5 Trillion in the seven year period from 2005 to 2012. So, the total capital cost per net cumulative barrel of increase in production from 2005 to 2012 (relative to 2005) was about $11,700 per barrel.
Note that cumulative upstream capital costs increased by 133% from the 1998 to 2005 time period to the 2005 to 2012 time period, but the corresponding increase in cumulative production (relative to 1998 and 2005 respectively) fell by 95%.
Therefore the global upstream capital costs necessary to offset production declines from existing wells and to add one new barrel of cumulative production in the 2005 to 2012 time period was 39 times what was necessary to offset production declines from existing wells and to add one new barrel of cumulative production in the 1998 to 2005 time period–in terms of capital costs per barrel of new cumulative production.
And note that annual Brent crude oil prices rose at an average rate of about 15%/year from 1998 to 2012.
A critically important point to remember is that the post-2005 decline in US petroleum consumption, and the post-2008 increase in US crude oil production, caused our demand for net oil imports to decline, but this had no impact on the global supply of net oil exports.
We have seen a material post-2005 decline in Global Net Exports of oil (GNE**), with developing countries, led by China, so far at least consuming an increasing share of a post-2005 declining volume of GNE.
The reality facing the US and most other developed net oil importing countries is that are gradually being priced out of the global market for exported oil, via price rationing. At the 2005 to 2012 rate of decline in the ratio of GNE to Chindia’s Net Imports (GNI), the GNE/CNI ratio would approach 1.0 in only 17 years, which implies that the Chindia region alone would theoretically consume 100% of Global Net Exports of oil:
http://i1095.photobucket.com/albums/i475/westexas/Slide1_zps9ff3e76d.jpg
*Data Source: Barclays Capital
**GNE = Combined net exports from (2005) Top 33 net oil exporters, total petroleum liquids + other liquids (EIA)
From what I have seen, total oil supply has been moving up since 2005 and significantly since the most recent recession. Corn prices are also at three-year lows, and corn is the main input for fuel ethanol. And also, the EPA is now considering a reduction in the ethanol mandate, though I do not know if refiners will chose to use a different oxygenator (like MTBE) for their blends.
There is also supply reduction in countries like Libya (war) and Iran (politics). Venezuela is turning into a failed state. Mexico is reforming its oil industry to offer incentives (like production sharing agreements) to boost production.
It looks like there are more factors which could lower oil prices than raise them, over the next few years.
Jeffrey Brown is absolutely right. That is why the Republicans filibustering the Democrats attempt to enable us to become energy independent through natural gas, was nothing less than treasonous.
Luke,
Following is a link to normalized production and net exports numbers for 2002 to 2011, and partially to 2012:
http://i1095.photobucket.com/albums/i475/westexas/Slide1-29_zps42ffc9bc.jpg
2005 values in the above chart were set equal to 100%. GNE remained at 96% (of 2005 rate) in 2012, while ANE (Available Net Exports, or GNE less CNI) fell to 85% (of 2005 rate).
Regarding Libya and Iran, production and export disruptions certainly had an effect, but there are always some kind of production problems around the globe at any given point in time.
Regarding Mexico, based on the 2004 to 2012 rate of decline in their ECI ratio, they would approach zero net oil exports in about six years, by the end of 2019. Overall Western Hemisphere net oil exports* fell from 5.9 mbpd in 2004 to 5.0 mbpd in 2012.
*Seven major net exporters in the Americas in 2004, total petroleum liquids + other liquids, EIA
And here is an excerpt from an essay I wrote regarding the prospect for the US becoming a net oil exporter:
http://www.resilience.org/stories/2013-06-10/commentary-is-it-only-a-question-of-when-the-us-once-again-becomes-a-net-oil-exporter
For a concrete example of how the Export Capacity Index (ECI) concept works, consider two countries that are widely considered to be critically important sources of future crude oil production: Brazil and Iraq. If we extrapolate the 2008 to 2012 rate of decline in Brazil + Iraq’s combined ECI ratio (the ratio of liquids production* to consumption), they would collectively approach zero net oil exports in about 20 years.
Given Brazil’s status as a net oil importer in 2012, even if we count biofuels, it’s instructive to consider what the conventional wisdom was just a few years ago regarding Brazil. In April, 2009 Bloomberg published a column discussing the prospect for Brazil continuing “to take market share away from OPEC.”
We should keep case histories like this in mind when we read in the media about the “Fact” that the US will soon be a net oil exporter, and while there are always uncertainties in forecasting future trends, we can be certain of three objective facts: (1) All oil fields, sooner or later, peak and decline; (2) Global crude oil production is the sum of discrete oil fields that peak and decline and (3) Given an ongoing production decline in an oil exporting country, it is an mathematical certainty that unless domestic consumption in that oil exporting country falls at the same rate as the rate of decline in production, or at a faster rate, the resulting net export decline rate will exceed the production decline rate and the net export decline rate will accelerate with time.
*EIA data, production = total petroleum liquids + other liquids (mostly biofuels in the other liquids category)
Lower gasoline prices are more to do with lack of demand growth rather than supply increases. World oil demand is rising by less than 1%. Chinese oil demand was 8.4 mpd in 2005. In 2013 they are consuming at rate of 9.75 mpd which is mere 1.9% growth componded from 2005 while their economy has grown at over 9% average. so is east european and CIS oil demand where oil demand growth has lagged economic growth rates. they consume lot less oil than countries with similar per capita income. Can anyone explain this anamoly?
Oil prices persist higher because of existence if etfs which have expanded the pool of bids way beyond those who want to use the physical good. Once we remove these etfs a new balance between physical users and liquidity providers will emerge so that the price is less responsive to slight changes in the supply demand picture
perhaps our inability to impact world crude prices and thus gasoline suggests the economy should attack energy in a different way? reduce demand for oil and gasoline with renewable energy sources and electric/hybrid cars. you can change the supply-demand curve two ways. why not shift the demand curve if we are ineffective with the supply curve?
Jeffrey, excellent work, as always. Have you considered adjusting your data for population to show the per-capita levels and rates? If so, you will have already discovered that the world extraction per capita now resembles that of the US in the mid- to late 1970s, implying that the global growth of industrialization has peaked along with real GDP per capita.
Also, what you and Steven are describing WRT to costs at the trend investment and extraction rates is the so-called “Seneca Cliff” (or effect), i.e., the acceleration rate of decline is much faster than the rise to the peak. The phenomenon is also analogous to the so-called “Red Queen Race” (also prevalent in the high-tech industry) in which a faster rate of growth of investment, net energy, and profit is required to avoid deceleration and then contraction of extraction/production.
To all:
Real final sales per capita and wage and salary disbursements to the price of gasoline:
http://research.stlouisfed.org/fredgraph.png?g=owD
To working-class wages:
http://research.stlouisfed.org/fredgraph.png?g=owE
Brent to real GDP levels for China to ’11), US (real final sales per capita), Japan, and the EU:
http://research.stlouisfed.org/fredgraph.png?g=owF
Change rates (China has decelerated from 9% to 7%):
http://research.stlouisfed.org/fredgraph.png?g=owG
Change rates of US real final sales per capita and Brent to real final sales per capita:
http://research.stlouisfed.org/fredgraph.png?g=owK
The decelerating rate of Brent to final sales with the yoy rate of US real final sales below 1% is recessionary historically.
https://app.box.com/s/txig5u69mz0pbgsj3qn5
IOW, the prices of oil and gasoline have fallen recently because US and global demand is at or near an historical recessionary rate worldwide.
There has recently been headlines about the Monterey shale reserves in CA with recoverable reserves estimated at 15 billion bbl by the EIA, which is about 2 years’ worth of current US consumption and ~18 months for the US and China combined. What is rarely discussed when these issues are reported is the price of oil, cost per bbl, sustainable rate of extraction, and rate of real GDP per capita is required to sustain profitable extraction and the demand to justify the costs of extraction.
@bmz, the US cannot become “energy independent” in the way it is generally understood (sold) at the trend level and rate of real GDP per capita AND at the current price of oil. Rather, we would need the constant US$ price of oil below $40 at a 30-35% lower level of oil consumption (including net oil imports) OR a near doubling of US extraction in the meantime.
However, real GDP per capita cannot grow with the sustained price of oil above $40-$50, but a price of oil at or above $85-$100 is required for crude substitutes to be profitable to extract.
We can’t afford to increase profitable crude substitute extraction AND grow real GDP per capita at the current price of oil.
Therefore, we are left with an indefinite period ahead of little or no growth of real GDP per capita with steadily declining US oil consumption and imports per capita, and the likelihood of the average price of oil falling to levels that do not permit growth of profitable extraction of crude substitutes.
IOW, Peak Oil and the “Limits to Growth”.
Re: Satish
I don’t know if it’s an explanation, other than an explanation for high oil prices, but here is a chart showing normalized liquids consumption (2002 = 100%) for China, India, (2005) Top 33 net oil exporters and the US from 2002 to 2012, versus annual Brent crude oil prices:
http://i1095.photobucket.com/albums/i475/westexas/Slide14_zpsb2fe0f1a.jpg
The $64 Trillion question is what happens from 2012 to 2022. As noted above, the current trajectory would put China and India consuming 100% of Global Net Exports of oil in 17 years.
Re: Jimmy,
Of course, there is the alternative explanation–that the global supply of net oil exports available to importers other than China & India (what I call ANE) fell from 41 mbpd in 2005 to 35 mbpd in 2012.
Just a few observations….
On an inflation adjust basis, I would guess that the price of gasoline in the U.S. is pretty much the same as it was prior to the original peak oil in the early 1970s… 4 decades ago when I was getting 16 mpg at highway speeds in my 455 4-barrel Pontiac Bonneville that cost about $4000 which would be about the same as today on an inflation adjusted basis [if there were any new Pontiacs].
I would also point out that the technology for CNG powered vehicles has been around for decades and is being used by many fleets. With natural gas mains running throughout the U.S., a fairly rapid changeover to CNG vehicles and CNG filling stations is quite possible.
Additionally, the U.S. is sitting on enormous quantities of coal which could be used for fueling vehicles by creation of Direct Coal Liquefaction facilities which many studies indicate are economically feasible with oil at $100 per barrel. Of course our über-environmentalists would probably find some major reason to object to that.
The point is that there are many alternatives available to the U.S. provided we are not stuck with an administration that is philosophically opposed to energy self-sufficiency.
“The non-partisan Congressional Research Service reported in March that on federal lands, oil production fell 6% and natural gas production fell 21% from the beginning of 2009 to the end of 2012.”
US product supplied (materially, oil consumption) increased to 20.2 mbpd for the last three weeks from 19.1 mbpd for the same period last year, representing an increase of 6%.
This is truly an astounding development. In recent times, the price of regular gasoline has fallen below $3 at some stations here in New Jersey, and it would appear that consumers have responded enthusiastically.
Such a development is not consistent with a demand-constrained model. The IEA, BP and Citi, among others, have contended that demand is thin and any unexpected increase in the oil would crater oil prices.
By contrast, I have argued that the global economy is starved for oil, and any excess supply would quickly be mopped up, with prices returning to the carrying capacity level in relatively short order. The rapid growth of US consumption is evidence of such an effect. Show an American driver $2.99 regular, and they’re ready for a fill up.
Jim has also alluded to the notion of carrying capacity. He notes that, despite the increase from the U.S. and Canada, this was “less than the growth in consumption from the emerging economies and oil-producing countries over those same years. That’s why the world price of oil went up, not down, despite the growth in production from the U.S. and Canada.”
But this also means that the emerging economies sourced part of their increased consumption from advanced economy consumers. The the price of oil was must therefore have been set above the carrying capacity of the OECD. That is, the price of oil must have been set to re-allocate consumption from the slow to the fast growing economies.
Thus, recent US demand developments added to Jim’s post suggests that a supply-constrained approach is, in fact, the right one.
http://www.eia.gov/dnav/pet/hist/LeafHandler.ashx?n=PET&s=WRPUPUS2&f=W
It seems clear that neither major political party in the US is interested in energy policy that requires substantial capital investment by the consumer, or anywhere near the consumer in the delivery chain. That makes CNG or electric vehicle adoption a very slow process. Those are unlikely to get any sort of push until all the other possible alternatives are exhausted: unconventional crude, NG-to-liquids, coal-to-liquids, biomass-to-liquids.
Satish:
Yes, an economy much below trend in most of the developed world is one factor in oil demand not driving prices higher, and one reason to believe that oil prices are unlikely to drop dramatically, absent greater economic woes. OECD oil consumption has declined by 1.3% per year from 2005 to 2012 but is still half of world consumption.
With respect to China, BP’s numbers show 5.7% per year compounded growth in oil consumption, markedly lower than economic growth, but other forms of energy are cheaper than oil, and structural dependence on oil is lower than in most developed countries. China’s primary energy consumption grew at an annual rate of 7.9% from 2005 to 2012 (per BP). This does not include consumption of traditional fuels (which is probably declining), nor distributed solar thermal water heating installations (China leads the world). Most of the overall growth was in coal consumption, although other smaller sectors of energy supply (natural gas, hydro, other renewables, and nuclear) grew faster on a percentage basis.
Bruce: Oil is much higher on an inflation adjusted basis than before the U.S. production peak and ‘first oil crisis’ in the early 70’s. The post-war price of oil was stable but declining and reached about $20/bbl in inflation adjusted terms in today’s dollars around that time. There is no question that unlimited supply of oil at that price would have a strong positive growth effect on the world economy. But, those days are gone forever.
I’m an engineer, I don’t belong to the ‘no impacts are permissible, all options are off the table’ camp. However, take a look at China, the former Soviet Union, or a long litany of environmental and health consequences in our own country, if you truly believe that no regulatory consideration of externalities is necessary in economic development of energy and industry. The biggest, richest vein of energy available to us is our own consumption. Americans waste a tremendous amount of energy and spend very little on energy efficiency. There are many cost-effective projects available to improve energy independence, and much in the way of unemplyed labor available to implement them.
Steven,
Very good points about demand, and I suspect that this factor accounts for the cyclical pattern of higher annual oil price lows.
We have of course seen a cyclical pattern of higher annual highs and higher annual lows in global (Brent) crude oil prices, but I think that the rates of change between successive price lows, or troughs following annual oil price highs, is very interesting.
Year Over Year Declines in Annual Brent Crude Oil Prices, 1997 to 2013
1997: $19
1998: $13
2000: $29
2001: $24 (1998 to 2001 rate of change: +20%/year)
2008: $97
2009: $62 (2001 to 2009 rate of change: +12%/year)
The 11 year 1998 to 2009 overall of change in trough prices was 14%/year. And then we have 2012 to 2013.
2012: $112
2013: $108 (Est. price)
Based on estimated price for 2013, the four year 2009 to 2013 rate of change in the trough price would be 14%/year ($62 to $108).
The long term 15 year 1998 to 2013 rate of change in trough prices would also be 14%/year ($13 to $108).
Benamery21: you are correct that within the last few years the price of gasoline popped up again, but has been trending a bit lower this year.
http://inflationdata.com/inflation/images/charts/Oil/Gasoline_inflation_chart.htm
Overall, I’d guess that the increase has been pretty well absorbed by the vehicle efficiency gains as far as individual consumers are concerned.
I don’t believe that no clean air/water standards should be the case, but it seems that, lately, the EPA has been particularly aggressive in claiming dominion over marginal aspects of the environment… such as http://finance.yahoo.com/news/w-va-chicken-farmer-wins-203035682.html
What is needed is both near-term common sense and long-term strategic development of abundant alternative resources. That’s why I’d be supporting both NG fueled vehicles and more research into DCL facilities. I agree that electric vehicles are still a ways off due to battery range and costs. The replacement cost of a battery pack for a Ford C-Max energi approaches $9,000 [parts only].
The price of oil is higher than the norm because of world tensions. Syria has not be resolved. Iran is still a serious problem to major oil producing countries in the ME. Egypt is a basket case. Venezuela has a madman instituting Zimbabwe style price controls. There are multiple government induced shortages around the world.
But as Steven Kopits and others have noted demand remains high stimulating innovations in oil production, for example the US. As traditional suppliers see their deliveries threatened more and more, other sources will come on line.
Combine that with stronger currencies as indicated by the price of gold and oil prices are actually close to normal now. $90-95/bbl is about right. That means that gasoline prices are about where they will be for some time, unless the government does something stupid like creating a gasoline shortage or massive QE driving the dollar down and the price of gold up.
The recent stability of the dollar as measured by gold has allowed businesses to trade more efficiently. This can be seen clearly in a more stable price of oil (after the Obama administration Syria fiasco). If the FED and the congress can continue to restrain themselves from additional meddling we might even see a real recovery. But then there is the Democrat Socialized Medicine disaster that will only get worse in 2015 when all the business insurance plans are cancelled.
just curious what people mean by us energy independence. we have a faction who say that domestic drill baby drill will solve our problems. but what problems will it actually solve? even if we increase domestic supply, because oil is a world market, we really won’t get substantial decrease in oil cost. hamilton’s post says as much. it may secure our own oil supply in the event of a world war, but not much other security or economy. unless we put significant restrictions on import/export of oil and regulate it into a domestic market.
it is still a better proposition to move away from oil based energy consumption. renewables certainly provide a safer, domestic supply of energy.
Excellent analysis, but those that look at the US as the only producer/consumer are dangerously ignorant. Also, the reduction in US consumption is comparable to the increase in US crude production. Why aren’t there stories about how the reduction in American oil consumption is driving prices lower? A positive is that the newest model year has lots of improved efficiency vehicle – 20-30% in many cases.
Winstongator –
It’s not so much about price stability as supply stability when seeking a North American supply base. As long as supply can be met from U.S./Canada/Mexico, there is a much better strategic positioning for the U.S. than a high degree of dependence on politically unstable or antagonistic nations.
Ricardo –
Let me clarify a couple of points. Personally, I do not believe the oil price is elevated due to tensions. If that were true, we’d be seeing production ahead of consumption and inventory builds. We’re not. For the last three months (EIA STEO), consumption was running 89.9 mbpd, production at 89.1 mbpd.
It is not clear that high oil prices are stimulating more production outside unconventionals. As Jim points out (and I have in the past), global oil supply growth is entirely leveraged to North American unconventionals.
The 2005 legacy oil production system (including new Iraq but excluding N. American unconventionals and NGLs), peaked in 2005 and is below that level now, although we have spent $2.5 trillion in the interim trying to maintain that legacy system, which constitutes 94% of total oil production, even today. (H/T to Mark Sadowski)
In the unconventionals, the Eagle Ford and Bakken are doing well; the Permian is doing exactly nothing. So maybe we have another 1.4-2.0 mbpd of production growth in the US–that’s about it. Maybe we get more production from Argentina or somewhere else, but it’s not clear what Act II is after the Eagle Ford and Bakken hit steady state, somewhere around 2016.
Goldman Sachs estimates the breakeven for the public oil majors at around $120-$130 Brent. Faced with this reality, the investment banks are calling for “capital discipline”, what I have earlier labeled here as capex compression. Notably, Shell unexpectedly (albeit, not for us) released a 2009 vintage, 6th gen ultra deepwater rig in the Gulf of Mexico on Friday. In short, we are seeing an outlook for reduced capex at the oil majors even at high current oil prices.
So, we can consider the current period Peak Oil Phase III. In Phase I, the oil supply stalls, oil prices rise, and capital is draw into the system to bolster production. However, the asset based can not be increased fast enough, and thus owners of existing assets see profitability soar.
In Phase II, new assets are brought on line. Some of this is simple capital intensity–more deepwater drilling rigs, more subsea production hardware, more industry activity overall. Also, higher prices allow technical innovation, in this case, primarily related to shale oil and gas drilling.
In Phase III, oil prices reach the global carrying capacity, from which they can only increase by GDP growth + efficiency gains, 7% in theory (including inflation), about 4.5% as observed empirically.
In Phase III, E&P costs are rising faster than oil prices and the operators find themselves in a squeeze. Investors, seeing that the vast earlier expansion of capex is not bringing desired results, begin to constraint operator flexibility and call for “capital discipline”. Reluctantly, operators begin to look for ways to improve efficiency. As labor is short as it is, they cannot really reduce opex. Instead, the turn to divestitures in the hopes of both generating cash and retaining higher rate of return projects. However, in doing so, they begin to cannibalize their oil production streams and revenues, but E&P cost increases do not ease. (See, for example, Hess.)
As a result, in Phase IV, they are forced to cull capex as well. Arctic, high cost LNG, and marginal deepwater projects take most of the adjustment. Capex begins to fall, and oil production declines begin to accelerate.
We’re starting Phase IV now.
Bruce Hall,
Most recent US net crude oil imports were 7.5 mbpd. Most recent US net oil imports on a total liquids basis were 6.1 mbpd (EIA, four week running average.)
Combined net oil exports from Canada + Mexico fell from 2.5 mbpd in 2004 to 2.2 mbpd in 2012 (EIA, total petroleum liquids + other liquids).
As noted up the thread, overall Western Hemisphere net oil exports* fell from 5.9 mbpd in 2004 to 5.0 mbpd in 2012.
*Seven major net exporters in the Americas in 2004 (Canada, Mexico, Venezuela, Argentina, Colombia, Ecuador, Trinidad & Tobago), total petroleum liquids + other liquids, EIA
“Jeffrey Brown is absolutely right. That is why the Republicans filibustering the Democrats attempt to enable us to become energy independent through natural gas, was nothing less than treasonous.”
What a falsehood…It is the Demcos who have been pimping Green Energy, at the expense of carbon based fuels…
And whom are blocking pipelines and goo production on public lands?
Clearly, clearly until global production reaches a 5% or greater capacity than demand, goo pricing shall remain volatile..It is as simple as dat.
hans
“What a falsehood…It is the Demcos who have been pimping Green Energy, at the expense of carbon based fuels…”
what is wrong with renewable energy sources? i bet if a solution for fusion technology were found, you would be against it as well!
the problem with carbon based fuels is they have direct connection to political instability, war, economic volatility, and pollution. why not pursue alternatives which minimize these negatives?
Technically, it looks to be consolidating sideways until it breaks out in a few years!
Steven,
Thanks for the lengthy response. It was excellent as usual.
Do you not believe that WTI soaring to $100/bbl was due to world events?
The price of oil is in a more normal range now. I think you know that I see oil as simply another commocdity and that oil reservers are only restrained by what we know. The discovery of additional sources throughout history has proven that supply is consistent with demand but world events (government errors) and currency errors (government errors) create the distortions.
But I appreciate your analysis because that is what keeps the oil supply balanced based on the currency value.
I almost feel guilty because the currency errors due to floating currencies are making me money on oil investments. If I get currency stability I will have to change my investment strategy. But then all these folks like George Soros who make $trillions off of currency errors don’t want stability so my strategy is probably safe. Sadly our economies will suffer though.
Weekly product supplied is pretty noisy.
Jeffrey Brown –
Of course the U.S. still imports much of its oil, however, I wrote about North American supply, not just U.S. [which has been increasing btw].
My much earlier point was that the U.S. should be focused on developing natural gas vehicles and fueling infrastructure which is far more feasible than plug-in vehicles and recharging stations. Additionally, with huge supplies of coal, DCF facilities could reduce the need for petroleum as the source of gasoline which is feasible at $100 per barrel for oil.
https://docs.google.com/viewer?url=http%3A%2F%2Fwww.netl.doe.gov%2Ftechnologies%2Fccbtl%2Frefshelf%2Fpresentations%2F20090409_LTI_DCL%2520Presentation%2520-%2520Comprehensive%2520Overview.pdf
bruce,
i can appreciate your view that alternative energy sources to oil-in your case nat gas-are the path forward. but the reason you are not seeing a great build out of nat gas infrastructure is the population does not see it in the future. that is why very little research and infrastructure work is done to directly support nat gas. the future is an electric world-nat gas will need to fit into that view.
electric vehicles will offer suprising versatility into the future through the use of fuel cells and batteries. nat gas will serve to produce the electricity-but it will not serve as the primary combustible in these future vehicles. the electric field is a few steps away from significant increases in efficiency of battery and fuel cell technology. combustion engine technology is basically maxed out-you can’t get much more efficiency there. but the electric world is just getting started with efficiency of its motors. the R&D is simply occuring where the future exists.
Richardo –
I was speaking of Brent, not WTI. So forgive me if I confused the two.
I am not an expert on the WTI-Brent differential. However, the gap closed when supply increases from the Bakken were less. The Bakken and Eagle Ford have had a blow-out performance since August, and the gap has widened since.
Bena –
Product supplied is noisy, although the last three weeks’ data is impressive. It could be the result of the temporary dislocation between US retail gasoline and Brent crude oil prices, as Jim notes above. However, it’s consistent with a supply-constrained model. In a supply-constrained model, the price is pretty well locked in around the carrying capacity price. If the price falls (oil volumes increase), then demand rebounds quickly, GDP increases, and the price reverts to the carrying capacity price.
On the other hand, it’s difficult to push past the carrying capacity price, because above it, consumers would rather consume less than pay more. So carrying capacity only increases with GDP. If E&P costs are rising faster, then the operators get squeezed. Goldman just this morning put a “sell” on Hornbeck, one of the leading operators of platform supply vessels. Goldman stated its view that expectations for floating drilling rig counts (the driver for the platform supply vessel market) would lag expectations, with an overbuild of PSVs now appearing likely.
A supply-constrained model therefore provides a unique interpretation. On the one hand, at the carrying capacity price, the potential volume uptake is, in effect, infinite. If you can produce oil at, say, $105 Brent, the market will take it in any quantity that you care to produce.
But if you can’t, the market will not recognize your costs. It will push you off your projects instead.
Baffled claims: ” combustion engine technology is basically maxed out-you can’t get much more efficiency there. but the electric world is just getting started with efficiency of its motors. the R&D is simply occuring where the future exists.”
How do you come up with these crazy ideas? Combustion engines are maxed out? Maybe you haven’t noticed the change in the past 3-4 decades. Maybe you missed the increased mileage and change in # of cylinders being used in most autos. Perhaps you also missed the shift from gas to diesel engines. On this one color me skeptical.
Electric motors a re not new technology. They are as sold as gas engines. We’ve been waiting for the at big gain in efficiency for nearly its whole life. On this one color me cynical.
Bruce Hall
“Of course the U.S. still imports much of its oil, however, I wrote about North American supply.”
Perhaps I am missing an exporter somewhere. As noted above, the two major net oil exporters in North America (Canada & Mexico) showed combined declining net oil exports from 2004 to 2012, and in round numbers it would take about three times the 2012 combined net oil exports from Canada + Mexico to meet current US net import demand.
Even total Western Hemisphere net exports, from the major net oil exporters, would not meet current US net import demand.
Baffling, I have to agree with CoRev with regard to vehicles for the next few decades.
All-electric vehicles have a number of issues and not related to the electric motors themselves. For example, Ford Motor Company has been focusing on the power management aspect of all-electric vehicles. Tesla has successfully extended the all-electric range to about 1/2 of some gasoline-powered vehicle [but 1/4 – 1/3 of efficient vehicles] by densely packing many lithium ion packs at a considerable expense. Battery technology requires a 200-300% efficiency improvement and a reduction of costs to be competitive with current vehicles. The issue there is that the internal combustion engines will continue to get more efficient thereby moving the bar farther.
For the foreseeable future, all-electric vehicles will have the niche of short-distance commuter vehicles in moderate climates [don’t expect them to be popular in Minnesota or Arizona].
Eventually [maybe 3 decades] all-electric vehicles will provide customers with enough cost/efficiency benefits to be competitive with ultra-efficient internal combustion engines.
corev,
there are thermodynamic laws at play with combustion type engines, and these laws cannot be broken. you can be skeptical all you want, but you cannot break the laws of physics.
yes electric motors have been around quite some. but coupled with software control systems, we continue to increase the performance of these systems. again you can be cynical if you want, but software will improve electric systems to a much greater degree than it will improve mechanical systems like combustion engines.
once the battery issue is solved, and it will, gas powered engines will become a relic of the past.
@CoRev
80% of the energy that is consumed by an ICE is waste heat, even if you improve the milage of an ICE a little bit the overall picture will not change – thermodynamics is a bitch.
A real improvement can only be expected when we use a system that does not work within the limitations of a Carnot cycle. Logical alternatives are, therefore, EVs with batteries or fuel cells.
Baffling, CoRev, and Ulenspiegel:
On efficiency of internal combustion engines, please see this.
JDH, Baffling, Ulenspiegel, et al, the issue is confused by the use of terms efficiency of Internal combustion Engine (ICE) versus that of autos. If you look closely at the comments, most are talking of the efficiency of autos.
In this average mileage environment we have to look at average changes in fleet make up vehicles (move from cars to trucks), vehicle fleet weights/footprints, and miles driven to make sense of efficiency changes. This chart although dated talks to all of these factors and many more, explaining how the fleet has changed: http://www.nhtsa.gov/cars/rules/CAFE/NewPassengerCarFleet.htm
It is easy to see where most of the auto efficiency has come from. Make your own conclusions from this data.
Steven,
Thank you again for the response.
The problem with confusion of WTI and Brent in your post was all mine. I made an assumption without reading closely. I watch WTI because it is the domestic oil price so it is most influenced by monetary errors with the dollar. Brent is more influenced by the monetary condition of the euro.
I understand your comments on supply constraints but I wonder if the reduction in off-shore drilling is not a function of more on-shore production where costs are lower. It is much more expensive to build, drill, and then maintain off-shore rigs. So perhaps it is supply that is impacting a reduction in drilling rigs rather than a reduction in drilling rigs creating supply constraints.
I still have a problem ignoring that at the height of the Syria fiasco WTI hit $110/bbl and then when Russia and the American people forced Obama to react rationally the price fell. Again I believe WTI’s trading range is between $85 and $95.
I have been very sensitive to the differential between WTI and Brent because of your posts and those of the professor. I believe they are very perceptive. But the differential between WTI and Brent has remained for some time now. I am not sure why. But demand certainly seems to still move WTI back to its norm.
Thanks to you and the professor for the intelligent analysis.
In vehicles, it’s important to distinguish between efficiency and conservation. A Honda with a 168 HP engine is not the same as the same car with a 244 HP engine. (I can attest to this personally.) That’s conservation, not efficiency–the consumer is making a sacrifice for that MPG gain.
A less demand constrained U.S. economy would mean a higher carrying capacity price.
jdh, your link is not addressing the efficiency of internal combustion engines. improved performance of today’s autos has to do with better aerodynamics, tire technology, better materials, weight density, etc. these are attributes which are also shared by electric vehicles. first order effects of increased efficiency, brought on by the combustion engine itself, are very slow to grow. second order effects, which are not always unique to the combustion engine, have been a large source of efficiency increase. these improvements can be shared across platforms.
bruce, think of these two options. where will the largest breakthrough occur? 1) signficant changes in the efficiency of internal combustion engines, when they are pushed to the limit of the laws of thermodynamics? or 2) significant increase in battery peformance?
you cannnot beat the laws of thermodynamics. but there exist significant possibilities in battery technology. nanotechnology is providing great insight into significantly increased storage capacity. and new work is showing “old” materials like platinum currently in use are not nearly as efficient as some other materials under development.
this huge difference in upside potential is why significant R&D is conducted today on electric systems, and much much less so on internal combustion engines. it is the area with greatest potential for improvement.
remember folks, for the tea partiers who are into repealing laws today, there is no known method for repealing the laws of thermodynamics and gravity!
steven kopits
“In vehicles, it’s important to distinguish between efficiency and conservation. A Honda with a 168 HP engine is not the same as the same car with a 244 HP engine. (I can attest to this personally.) That’s conservation, not efficiency–the consumer is making a sacrifice for that MPG gain.”
you are exactly right. the point is improvements we are seeing are NOT the result of better internal combustion engines. they are secondary changes, often transferable across vehicle platforms. lighter and more aerodynamic vehicles help BOTH gas powered and electric powered systems. but i still have signficant room to improve the guts of my electric system, not so much with my gas engine.
Kopits: Your Honda example is both efficiency and curtailment, both of which are conservation. When the vehicle is used for a purpose which does not utilize the additional HP, the resulting greater efficiency is simply efficiency. When the vehicle owner would use the additional horsepower but is unable to do so thru having purchased a smaller engine, that is curtailment. Typically there are also other benefits received for opting out of conspicuous consumption, such as lower sticker price, lower fuel bills, and reduced traffic fines.
Internal combustion engines are not “maxed out”. In fact, their efficiency has been growing at a 1% yearly rate for quite a long time.
That’s not to say that electric cars or fuel cells don’t have more potential. But I am skeptical of any proposal that involves throwing out a working system for something unproven (think Obamacare).
I feel the same way about converting heavy trucks to nat gas rather than, say, gas-to-liquids technology to produce GTL diesel. The later utilizes existing infrastructure and only requires (massive) investment in existing refineries. Makes far more sense, in my opinion.
Bena –
“A less demand constrained U.S. economy would mean a higher carrying capacity price.”
In a demand-constrained approach, GDP is exogenous, and the oil supply is endogenous, in that the supply responds to GDP through increased oil demand. In this world, P=MC.
In a supply-constrained approach, the oil supply is exogenous and GDP is endogenous, with P=CC (Is it the same as the monopoly price? Ross McKitrick says no, but it’s something like that.) Note that the supply-constrained approach only applies to the part of the curve where the oil supply is a binding constraint on GDP growth. The threshold is something like a 2.7%-3.2% oil supply growth rate. In such an event, the oil supply would be growing fast enough to meet all needs and would therefore not be a binding constraint on economic growth. It is currently growing around 1.5%, expected at 1.7-1.9% for 2014, for the record.
Now, for any given country, oil may not be the binding constraint. So, in recent years, Slovakia has grown much faster than Hungary, even though the two are direct neighbors with similar levels of development. Clearly, Slovakia has much better governance. Therefore, governance is also an important determinant of growth, and this would include fiscal and monetary policy, as well as regulations and investment climate-related legislation. For example, badly managed as Hungary is, it still only has half the unemployment rate of Portugal or Greece, which are being strangled by Euro membership.
However, if we take the oil supply as a whole as fixed (a pretty reasonable assumption, I think), then any increase in one country’s oil consumption must necessarily be offset by a decline in another’s. Therefore, in a supply-constrained model, we would expect to see a kind of “lump sum of growth” effect, whereby one region or country would be doing well while another would be doing poorly. It’s something like a zero sum game.
I would note that the zero sum aspect hinges on a constant rate of efficiency gain across countries. That is, we’d assume that the maximum pace of efficiency gain in, say, the United States is the same as in China. It’s probably not, but that’s as far as my analytics go in the matter.
engineer,
“Most steel engines have a thermodynamic limit of 37%. Even when aided with turbochargers and stock efficiency aids, most engines retain an average efficiency of about 18%-20%.[9] Rocket engine efficiencies are much better, up to 70%, because they operate at very high temperatures and pressures and can have very high expansion ratios.[10] (Electric motors are better still, at around 85-90% efficiency or more.)” this is quoted from wikipedia-internal combustion engines.
the problem with ICE’s is that you will not get significant changes in performance-no matter what the fuel type. 1% a year is effectively “maxed out”. that is why you are not getting any significant investment in long term programs.
however, very significant changes can and will occur in the electric vehicle front. that is why you are seeing park and plug spots appearing throughout the country. there is a belief electric holds a long term solution. look at the new tesla vehicle. right now it blows the doors off any comparable gas powered vehicle. its drawback? needs more battery range-no dispute. the odds are much greater i can increase its range 10-fold in 10 years, than i can even double the range of a gas powered vehicle in the same time frame. it is that potential-which has a high probability of being reached-which is driving the R&D of electric systems today.
My Alaska article:
http://www.douglas-westwood.com/files/files/823-Alaska%20Oil%20Crossroad%20-%20Kopits%20-%20Oil%20and%20Gas%20Journal%20-%20Nov.pdf
CoRev, The Engineer,
I actually do understand the differences but should have explanied the problem morte in detail.
I would start the discussion with two premises:
1) You do not have per se an energy problem, but foremost a liquid fuel problem.
2) You have very likely to reduce your oil consumption by more than 2% per year in order to get a meaningful result, i.e. to come close to compensate for declining prodcution with substitution/savings.
Within this framework the EV is very attractive:
The advantage of EVs is that they reduce energy demand by 70% and allow at the same time to shift the reamining 30% to other energy sources, the whole affair is quite future proof. The additional burden for the elctric transmission net is from a practical POV zero and the power plants get better FLH or the slightly higher demand can easily be provided by alternatives like NPPs, PV, wind, most likely even by efficiency gain in other fields.
Alternatives like higher milage of ICEs are either too slow or only a temporary solution like NG as large scale substitute for oil.
Therefore, I would start with the low hanging fruits in case of the EV, here we have very likely economoic solution already for some application in urban districts, and combine these with better miligae of the other vehicles (hybrids, EV with range extender…).
I strcitly oppose new large-scale NG infrastructure for cars, NG is good for replacing oil in locomotives, ships, busses and some trucks, applications that require only limited infrastructure changes.
Continuing with the the theme of capital costs per bpd of the average post-2005 increase in global crude oil production. . . .
Of course, this is a back door way of saying we have basically peaked. As the incremental increase in production relative to a prior year approaches zero, the capital costs per barrel per day of incremental production approaches infinity.
In any case, Steven Kopits’ data (from Barclays Capital) show that the global oil industry spent $3.5 Trillion, or $500 billion per year on average, for 2006 to 2012 inclusive on upstream (exploration and production) costs.
For 2006 to 2012 inclusive, global C+C production averaged 73.7 mbpd, versus 73.6 mbpd in 2005 (of course, almost all of the actual increase was in 2012).
So, in order to offset declines from existing production and to show an average increase of 0.1 mbpd (100,000 bpd) for 2006 to 2012 inclusive, the industry spent an average of $500 billion per year, or a total of $3,500 billion.
In the alternative, one could say that the industry spent $35 million (per barrel per day of increased production) from 2006 to 2012 inclusive, to offset production declines and to show an average increase in production of one bpd for seven years.
In regard to the prior seven years, 1998 to 2005 (which would be 1999 to 2005 inclusive), the global industry spent $1.5 Trillion to show an average increase of 2.5 mbpd for seven years. Or, in order to offset declines and show an average one bpd increase in production, the industry spent $0.6 million per barrel per day of average increase in production (relative to 1998).
So . . .
1999 to 2005 inclusive, we spent $1.5 Trillion to offset declines and to boost production by an average of 2.5 mbpd, relative to 1998–$0.6 million per one bpd average increase in production.
2006 to 2012 inclusive, we spent $3.5 Trillion to offset declines and to boost production by an average of 0.1 mbpd, relative to 2005–$35 million per one bpd average increase in production.
Therefore, we have seen a 58 fold increase in the capital costs necessary (per bpd of increased production) to offset production declines and to show one bpd of increased average incremental production as we went from the 1998 to 2005 time period to 2005 to 2012 time period.
As noted above, as the incremental increase in production approaches zero, the capital costs per bpd of increased production approaches infinity.
US gasoline consumers could easily see near-term benefits, if Brent Crude heads into a near-term cyclical low. A number of coincidences could support the popular notion that energy self sufficiency is just around the corner.
It is curious how energy self-sufficiency has become synonymous with national energy security when the two are by no means the same. Moreover, it would appear that the collective fondness for abundant cheap energy is driving much US energy policy, even some of issues addressed on Econbrowser. National energy security is a much more elusive creature, harder to define and harder to operationalize.
The Canadian prime minister in his attempts to promote the Keystone XL pipeline has found out the hard way that special-interest politics rule, not some charming, wistful appeal to national energy security.
Baffling said
Those exact same thermodynamic laws apply to electric cars. The only difference is they are applied at the power plant that generates the electricity that charges the electric cars batteries.
Additional efficiency reductions in the form of transmission / transformer losses occur when the electricity is moved from the generating station to the car charger.
@Duracomm
some remarks to “Those exact same thermodynamic laws apply to electric cars.”:
1) You work in powerplants with higher tmeperatures, higher temperature differences and more uniform output, which give higher efficiency (40%-60% vs
duracommm,
you are still missing the point. there is far more potential to improve the efficiency of the electric auto than the internal combustion engine auto. even if you tap out the potential of electricity transfer-and we are in the early stages of the smart grid so this is very doubtful-the problem reduces to efficiencies to be generated at the automobile itself. and there the electric vehicle has much greater potential advantage.
if you want to argue against electricity generation and transmission, then you should also consider the cost of discovery, recovery and transportation of gas and oil. do you believe this cost ($100/barrel oil) is going to increase or decrease in the coming decade? wind and sunlight as a renewable source long term put significant restraints on rising electricity costs-as least from the producers perspective.
Baffling asked,
The problem with “renewable” energy sources is they mostly don’t work as advertised and often cause more environmental damage than the nonrenewable power source they were supposed to replace.
Palm oil: the biofuel of the future driving an ecological disaster now
Duracomm,
Most mainstream people talking about alternative fuels on a large scale refer to wind, solar and geothermal, possibly wave. Most folks, including myself, are quite suspect of biofuels on a number of levels. They may serve a niche purpose-but not a large scale solution.
“The problem with “renewable” energy sources is they mostly don’t work as advertised and often cause more environmental damage than the nonrenewable power source they were supposed to replace.”
This statement is simply incorrect, unless you want to identify esoteric sources such as “palm oil” as representative of large scale renewable energy sources. and it is NOT representative. choosing a poor example and extrapolating to the whole is a sad way to try and make an argument, unless you intend to misrepresent the story.
Baffling,
You asked what was wrong with renewables and I showed the problem. You may not like the answer but that does not change the facts.
The problem with “renewable” energy sources is they mostly don’t work as advertised and often cause more environmental damage than the nonrenewable power source they were supposed to replace.
Hundreds Protest Chinese Solar Factory Pollution
@Duracomm
The EU biofuel program was reduced this year and your argument “The problem with “renewable” energy sources is they mostly don’t work as advertised and often cause more environmental damage than the nonrenewable power source they were supposed to replace.” is wrong. The most important contribution comes from wind power which works as advertised.
BTW you did not provide any hard data that supports your arguments, only personal opinions.
Ulenspiegel said,
You missed the links in my comments they provide the data you are looking for.
Here are some more facts showing the problem with “renewable” energy sources is they mostly don’t work as advertised and often cause more environmental damage than the nonrenewable power source they were supposed to replace.
White elephants seen in North Sea
A huge offshore energy project may prove an expensive disaster
duracomm
“You asked what was wrong with renewables and I showed the problem. You may not like the answer but that does not change the facts.”
Again I need to reiterate you are wrong. you chose an esoteric example, palm oil biofuel, as an example to say the whole field is bad. simply incorrect and very disingenuous. wind, solar, geothermal and wave are all much larger scale potential sources-with much greater potential of solving future problems.
you site an example of a possible pollution problem-same problem exists in fossil fuel approaches as well. but over the long run, the production problems only occur once, not every time you produce the energy. simple pollution regulation would keep the event you quote from occurring-exactly what we have here in the USA.
renewables most certainly work as advertised.
Baffling,
I keep supplying real world examples of renewable failures and the environmental destruction they cause.
You keep supplying arm waving assertions that these failures do not exist.
You may not like the facts and wish they were different but that does not change them.
duracomm,
you supply esoteric examples that have no meaning on the large scale-that is why I refute your comments. I don’t say failures do not exist-I simply say the items to bring up are meaningless in the big picture. if I had a drug that injured 1 person for every 10,000 it saved-should I banish the drug to save that 1 person? that is on the same level as your examples.
Baffling said,
“you supply esoteric examples that have no meaning on the large scale-that is why I refute your comments.”
Baffling you have asserted much and refuted nothing. You have argued that the parrot is not dead it is just pining for the fjords.
The parrot is dead and renewables mostly do not work as advertised and often cause more environmental damage than the nonrenewable power source they were supposed to replace.
The examples shown are not esoteric in the massive amount of amount of environmental destruction they have caused. They were all implemented by government fiat enabled by the shiny green patina of being renewable. They all failed and some of them caused massive amounts of environmental damage in the process of being miserable failures.
This discussion has provided a good example of how environmentally destructive status signaling and epistemic closure are when applied to energy and the environment.
If a power generation device was labeled renewable but slurried arctic seal pups and endangered bats while generating the power many “environmentalists” would mindlessly support it (because renewable!!!).
If it was pointed out that this renewable power source was harmful to arctic seal pups and endangered bat species these same “environmentalists” would say it was an esoteric example.
The abject refusal by an unfortunately large number of “environmentalists” to even consider the environmental destruction “renewables” cause would be amusing if it were not so damaging to the environment.
duracomm,
I refuse to engage in a battle of wits with an unarmed man. if you can show me why wind, solar and geothermal fail to provide as promised, great. but palm oil as an example? stupid.
baffling,
Palm oil is the perfect example of the environmental destruction status signaling renewable supporters have caused. Your sad attempts to ignore the facts on the ground do not change the facts.
Earthquakes Hinder Green Energy Plans
Quakes slow geothermal energy
Aside from the environmental damage many “renewables” cause uninformed renewable supporters do not understand the scale of energy usage and why “renewables” are unlikely to scale up to produce the power needed.
An informative point from the article above
New geothermal projects have had difficulty getting to the point where they actually produce power. Yet to meet 10 % of the power demand geothermal capacity will have to increase by 25 times.
duracomm,
I guess I have a more realistic understanding of the world. as one innovates, one should expect success vs failure. when something does not work, then of course you change course. any intelligent individual understands this. but as of now, I do not see where wind, solar or geothermal have been a mistake.
so if you want to ban geothermal due to possible seismic issues, I assume you are willing to do the same for fracking and seismic issues? the logical approach is you study the problem, identify if it is a problem and its source. at that point you decide whether to move forward or stop.
so we have discovered a possible problem with seismic issues and geothermal? does that mean you throw out geothermal sources? of course not-only an ideological idiot would do that. we simply study the problem until we get a better understanding of what, if any, risk is associated with geothermal. I advise we do the same thing for fracking-but of course the industry is very resistant to this type of study.
Geothermal works in limited settings and it is producing energy in most of those settings already. I never mentioned banning geothermal, and would not support such a ban. Such a ban would be a waste of legislative effort because geothermal is failing all by itself.
The problem with most renewables at the moment is corporate rent seekers in the renewables industry enabled by clueless renewable supporters force the deployment of non commercial technology for the purpose of harvesting government subsidies and mandates.
If things go well the result is lots of money spent with no appreciable energy production. If things go badly you get an environmental train wreck like any number of biofuel boondoggles.
again we simply disagree on reality. I find wind and solar-the largest renewable sources-as quite environmentally friendly. but more importantly, they are RENEWABLE. you can gripe about biofuels all you want-they are not even on my radar screen. my interest is wind and solar, and a modern system to transport the energy produced. I see no reason yet to think they will be a failure.