The rest of the Nation continues to grow.
The Wisconsin Department of Workforce Development has released preliminary January employment figures, incorporating incorporating backward revisions to earlier months’ data. [1]
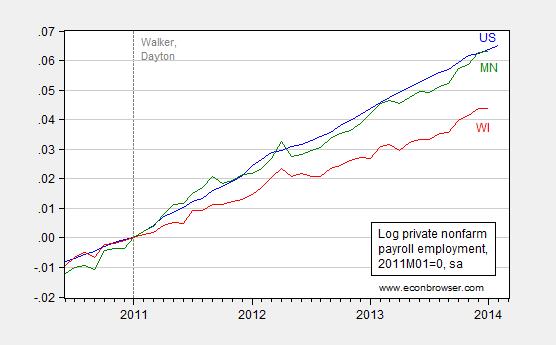
Figure 1 (rev’d): Log private nonfarm employment, seasonally adjusted, for US (blue), Wisconsin (red), and Minnesota (green). Vertical dashed line at 2011M01. Source: BLS, WI DWD and MN DEED. (MN series corrected 3/14 12:30PM — mdc)
In order to hit Governor Walker’s goal of 250,000 net new private sector jobs by January 2015, 12,275 jobs per month would have to be created in each of the next twelve months. Mean job creation has been 2,868/month, with standard deviation of 3,766, since January 2011. The gap between the required monthly job creation rate and the average rate of job creation is 2.5 standard deviations. For 12,275 jobs to be created month after month for the next 12 months is therefore somewhat (!) unlikely.
Minnesota’s cumulative private nonfarm payroll employment growth since 2011M01 is 1.9 percentage points higher than Wisconsin’s (in log terms). Furthermore, the gap is expanding, so that over the last three months, Minnesota’s (annualized) growth is 2.8 0.9 percentage points faster (correction 3/14 12:30PM).
Menzie, Thanks for trying to keep this debate alive, but I’m afraid that the obfuscation tactics of the Walkerites, combined with Wisconsin’s abjectly lazy (or oligopolistic) media have all but buried this one. While Walker stated on February 25, 2010, that “If you elect me as Governor, I’ll get government out of the way and lower the tax burden . . . [to] create 250,000 jobs”, here we are, four years later, with dismal job creation performance compared to the majority of other states and extremely poor job records in comparison with our neighbor to the west. While manufacturing and construction jobs languish, the Walker Administration shifted the debate to how jobs are counted, and what BLS reports are important so that now–no one cares. Look, for example, at the old monthly job reports from the Doyle Administration, a one page narrative and two pages of BLS reports–seasonally adjusted and not seasonally adjusted; straightforward, easy-to-read and use. Now it’s a six page release, two pages of glowing narrative spin on the work of Our Glorious Leader, and then a parade of confusing and parti-colored graphs, heavy on line and bar charts but short on real information, with special attention focused on BLS data revisions so as to imply that all the statics are inaccurate. The result: the eyes of the MJS and WSJ staff gloss over and the story headlines become the first line of the Walker press release (just check out what was said in those two publications). While one might think that the loss of manufacturing jobs over the last year, the beginning decline in health care jobs, and the steady shrinkage of the Wisconsin work force (and the only thing Wisconsin has going for it is the propensity of its citizens to be seeking employment compared to other states) might be important stories, you wouldn’t find any concerns about that in the states’ media. So it was a pretty simple strategy: promise something, fail to deliver, then continually move the goalposts, or claim the umpires are wrong, or the score keeper lied until nobody really cares anymore.
Menzie
The flat part of the Wisconsin graph relates well to the job report, but I do not understand how just 900 jobs, a 0.0% change, December to January, in Minnesota makes that great upward leap? Should not it too be flat? From your link to Minnesota, MNDEED.
Change from Previous Month
Industry Title January December November Numeric Percent
Total Nonfarm 2,812,300 2,811,700 2,799,800 600 0.0%
Total Private 2,396,000 2,395,100 2,385,200 900 0.0%
Ed
Ed Hanson: You are right, I had the wrong series for pre-2014 data. Thanks for catching that error. I’ve inputted the correct series, so that the widening occurs earlier than in January 2014 (that is the current MN series is higher than what I plotted before). As you can see, the cumulative gap as of Jan 2014 remains 1.9 percentage points in log terms. The gap is still widening over the last three months, but at a slower pace than I initially reported — about 1 percentage point at an annualized rate.
So, thank you for highlighting the fact that I had understated Minnesota’s relative outperformance of Wisconsin for the pre-2014 period.
Menzie
It would help if we knew for certain that we both use the same data base for our calculations, and although I used the your linked data form WI DWD and MN DEED in my previous post, I prefer the data as presented by the St. Louis Fed FRED site. FRED seems to update revisions more consistently than other sites. Do you use a better source or do you agree that FRED works? I note that the FRED data is different from WI DWD and MN DEED. Which of the sources do you consider currently more accurate and will the sources become identical as revisions are incorporated?
Then following is from St Louis Fed FRED; <a href="http://research.stlouisfed.org/fred2/data/WINA.txt" and <a href="http://research.stlouisfed.org/fred2/data/MNNA.txt". Jan,2014 are not included as the BLS does not publish until tomorrow. All the numbers are seasonally adjusted.
Wisconsin employment numbers, rounded to nearest hundred
Jan 1, 2013 …. 2,797,800
Dec 1, 2013…. 2,840,500
Difference …. 52,700
Minnesota employment numbers, rounded to nearest hundred
Jan 1, 2013 …. 2,765,400
Dec 1 2013 …. 2,797,700
Difference …. 32,300
These numbers indicate that since the major tax changes by both states beginning Jan 1, 2013, Wisconsin employment growth is clearly better and stronger than Minnesota. More over, these number do not match your current rev. Figure 1.
The numbers for the three months Sep. 1, 2013 through Dec. 1 2013 result in the following job growth numbers:
Wisconsin …. 21,500
Minnesota … 21,300
Depending on your basis these numbers may reflect a .9 % improvement in Minnesota over these 3 months, but as with all statistics in percentage, the context is important. Speaking of context, I again would like to point out what is happening to the leading indicators of both states. Again from the FRED site.
Wisconsin Percent Hide Last 5 Observations
2013-12: 1.02
2013-11: 0.94
2013-10: 1.81
2013-09: 1.36
2013-08: 1.31
Minnesota Percent Hide Last 5 Observations
2013-12: 0.36
2013-11: 0.48
2013-10: 0.97
2013-09: 0.70
2013-08: 1.14
Wisconsin remains squarely in the range of leading indicators since 2011, while Minnesota’s plunge is far below its range since 2011. Such indicators are subject to volatility, but do you consider this trend significant?
More tomorrow, as time allows, with the BLS report.
Ed
Ed Hanson: As you indicate, with the January figures, BLS will release a new set of benchmarked employment series (like the national figures are rebenchmarked using tax records). The states provide the BLS the series and the BLS will finally release, after inspection for consistency, etc., tomorrow. My experience is that the BLS series differ insignificantly from the state series that are released slightly earlier — at least insofar as Wisconsin data are concerned.
So my guess is that the results I have just cited in the blogpost will match what you will find in FRED.