The previous post on state employment trends sparked some debate regarding the generality of the negative correlation between the ALEC-Laffer “Economic Outlook” ranking and economic growth, as measured by the Philadelphia Fed’s coincident index. One reader argued four observations were not sufficient to make a conclusion, and I concur. Here, without further ado, is the correlation for all fifty states.
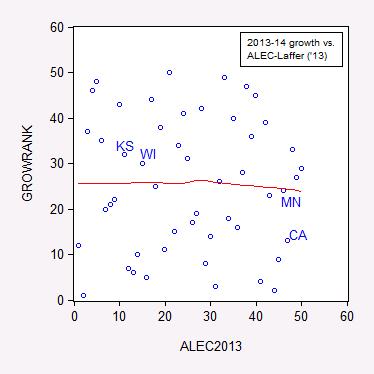
Figure 1: Ranking by annualized growth rate in log coincident index 2013M01-2014M03 versus 2013 ALEC-Laffer “Economic Outlook” ranking. Nearest neighbor nonparametric smoother line in red (window = 0.7). Source: Philadelphia Fed, ALEC, and author’s calculations.
If a higher ALEC-Laffer ranking resulted in faster growth, then the points should line up along an upward sloping 45 degree line. This is not what I see.
Some of the fastest growing states are oil exporters, so in order to partly control for this factor, I omit the top five oil producer states.
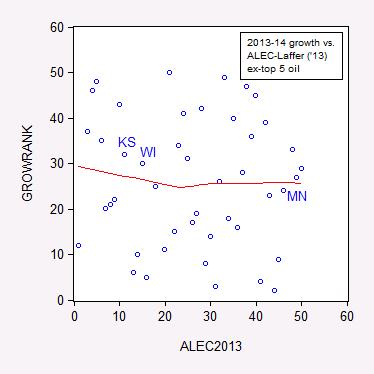
Figure 2: Ranking by annualized growth rate in log coincident index 2013M01-2014M03 versus 2013 ALEC-Laffer “Economic Outlook” ranking, excluding top five oil producing states. Nearest neighbor nonparametric smoother line in red (window = 0.7). Source: Philadelphia Fed, ALEC, and author’s calculations.
An econometric point. Some commentators have repeatedly concentrated on unemployment rates as an indicator of inter-state relative performance, over time. As I’ve pointed out, there are state fixed effects apparent in unemployment data, so it makes sense to look at differences, or growth rates. Hence, I am looking at growth rates over time (in the previous post, I examined cumulated growth rates from 2011M01 onward). (For individual fixed effects, consult a standard econometrics textbook — I am using Stock and Watson Econometrics for teaching this semester; people who keep on ignoring fixed effects should consult).
Notice that whatever relationship there is, it doesn’t seem particularly positive in either sample. A linear regression delivers a negative (but statistically insignificant) coefficient. Of course, since the dependent variable is a ranking, an ordinal regression is more appropriate. In this case the coefficients are not interpretable as slope coefficients, but rather changes in the z statistic, distributed by assumption normally.
In the full sample, the ordered probit regression with 50 ranks yields a coefficient of -0.001, z-statistic of 0.01. Since the ranking is likely to include many cases where the gap in growth is very small, I place the growth ranking and ALEC index rankings into 10 bins, and re-estimate the ordered probit.
The full sample coefficient on ALEC2013 is -0.028, z-statistic of -0.56, so that the p-value is 0.58. Examining the same data, excluding oil producers yields a coefficient of -0.046, z-statistic of 0.85. The p-value for rejecting the null hypothesis of zero coefficient is 0.40.
While the proportion of correct predictions is quite low (the pseudo-R2 is 0.003), the coefficient on ALEC2013 is always negative regardless of specification. The interpretation of the impact of a higher ALEC-Laffer ranking on growth rank is ambiguous in general (and has to be calculated out numerically). However, for the top decile (using the “binned” data), it indicates a higher ALEC-Laffer ranking reduces the probability of being in the top decile. For the bottom decile, a higher score implies increases the probability moving into the lower decile.
Bottom line: If there is any evidence, it suggests that a higher ALEC-Laffer Economic Outlook score is associated with a worse economic performance, as measured by 2013M01-2014M03 growth using the Philadelphia Fed’s coincident indices. However, a more definitive conclusion must await a more comprehensive analysis. (Here‘s a start.)
Addendum: For the data reported by BLS, over the 1976M01-2014M03, the Wisconsin fixed effect (relative to the US), is 0.9 ppts. That is, on average, Wisconsin’s unemployment rate is 0.9 percentage points below that of the United States. The t-statistic (using Newey-West standard errors) for the null hypothesis of 0 difference is 9.5. If you do not understand this paragraph, you should not be comparing inter-state unemployment at a point in time, without referring to a prior period.
Update, 11:10AM Pacific 4/24: Here is a link to Kolko, Neumark and Cuellar Mejia, J.Reg.Stud. (2013), which assesses the relationship between growth and various business environment indices (but not the ALEC-Laffer indices).
Update, 9AM Pacific 5/8: CBPP finds little impact of tax rates on migration, here.
1. You have to remember to switch the formatting after you enter the graph.
2. I have the same drawing in my kid’s dot-to-dot book. If you connect them in the right order, it makes a bunny on a bicycle. In other words, “Holy Random, Batman!”
jonathan: I’m happy with the conclusion that the ALEC-Laffer Economic Outlook index ranking has effectively no correlation with actual economic performance.
But it does make a bunny on a bicycle!
I’m curious as to whether there’s any data about how a change in one state’s ALEC-Laffer outlook rating corresponds to a change in their growth rate once one removes the national growth picture. i.e. a state makes a change that results in an increase in their ALEC rating. Their growth goes from 1% greater than national GDP growth to 1.1% greater over the following year (or following 5 years). That would seem to be the best test for whether the items ALEC is measuring can have any impact on a state’s growth rate. Otherwise, the overall picture is going to muddy things (for instance education rates, asset bases, natural resources being extracted, etc.).
I think that your overall take on this makes sense (by and large, I’m inclined to believe the things ALEC measures have nothing to do with actually creating growth), but the best way to determine that would seem to be to look at how changes in those items relate to changes in growth once we take out the overall picture.
dygmacdonald: I’m not sure I understand your point. The growth rates take out the initial levels. If I subtract the national growth rate, that merely shifts down the scatterplot, leaving the slope coefficient unchanged.
I think the proponents of the ALEC-Laffer system think that things like estate taxes and progressive income taxes impede growth. They’d argue that states without such things will grow faster. I’d guess that if unearned wealth and inequality were good for growth, that stability in such things would be a positive, rather than a negative.
Real economic growth requires disruptive change, like fundamentally new energy sources and groundbreaking medical research. Unfortunately, the wealthy seem most interested in protecting their privilege.
Menzie I could be wrong, but I think poster dygmacdonald might be asking for a probit model that shows how the probabilities change as a state adjusts its ALEC rating, holding other factors constant. The (literal) textbook example for this kind of problem would be William Greene’s presentation of how a new teaching method affects the probabilities of seeing improvement as a function of the student’s GPA. The new teach approach was more effective for students with higher initial GPAs. The example is also replicated in the Eviews user manual…I’m doing this from memory because I’m not at my office, but I believe it is on page 55 of volume 2. I think that’s the kind of approach dygmacdonald has in mind.
BTW, if readers don’t understand your addendum comment, then I seriously doubt they will understand ordered probit/logit models either. So this could all be kind of circular.
Does this mean high taxes/union shops/high minimum wage = high growth? Or high taxes are harmless?
No! No Taxes = No Government = FREEDOM!!!
Just ask Bundy.
Ecomedian, I hope Professor Chinn replies to your post.
Thanks Menzie, another great reality-based critique. Unfortunately, the Laffer/ALEC analysis, while it purports to be about the relationship between taxes, et. al. to growth, is really just a cheerleading document for their preferred policy regime. Therefore, it is not a surprise that no relationship can be found–and this paradox just reflects the point that in order to advance ALEC’s political agenda, the results almost require a lack of relationship. For example, does anyone in Wisconsin seriously think that the state has jumped from 33/34th to 17th in growth potential? Has a pool of oil beneath the state been discovered recently? (pretty tough since the rocks are all of Pre-Cambrian origin) Has the state begun to swell with immigrants? (even the ALEC study itself reported a net out-migration) My point is that the pressure was on ALEC to praise Walker by claiming that Wisconsin was facing a bright future. No doubt the “fact” that the state’s rating by ALEC has jumped will appear in future political ads, but does anyone, anywhere in the state expect this upsurge in economic activity? Moody’s certainly doesn’t, but then Moody’s is writing for people who need accurate information to allocate billions of dollars in financial resources–quite a different standard.
Dr. Morbius: I would agree that there seems to be little empirical and theoretical content to the ALEC-Laffer index. Indeed, that was the motivation for the post. We all need to deploy data to counter ideology that masquerades as analysis.
menzie, the challenge is the massive amount of intellectually dishonest material that becomes presented, and in a “formal” method, so as to indicate it is based on rigorous research methods. then it is taken up as “fact” and repeated such. it’s like playing the whack-a-mole game. you cannot keep up with the mole!
baffling: Well, I have hope. After all, Representative Ryan no longer asks Heritage CDA to “score” his budget plans. I count that as a small victory, arising partly from the enormous (and well-deserved) ridicule heaped upon their methodological approach.
menzie, unfortunately folks like ryan win in these situations. they have you spend all your time and money debunking a false argument. and once you are done, they make up another argument and let you spin your wheels debunking it as well. and since their arguments are not grounded in reality, you are a busy hamster debunking all kinds of incompatible statements. they seem to lose no credibility at all when making factually incoherent statements, so they are in the news all day. it takes you a day to refute a 10 minute statement-and they have more 10 minute statements than you have free days! but i applaud you, krugman and others for keeping up the fight!
Would the scatter plot look much different if you used the average growth rate and average ranking over a longer period of time?
john: Surely the answer is yes, since both series are random variables. But whether there would be a substantive difference (from low, negative, correlation) is the question. A preliminary answer can be seen in the document I linked near the end of the text, i.e., here.
Thanks for the response professor Chinn. The paper finds that industrial structure does a much better job explaining variation in growth rates across states, which to a certain extent highlights the importance of geography and natural endowments. But I don’t find this evidence very compelling is suggesting that so called ‘pro business’ environments do not result in higher growth rates. Let me explain. Perhaps the variation in corporate tax rates is too small across states to be a significant determinant of relative growth performances. Maybe the average corporate tax rate at the national level would prove a significant driver of relative growth in a cross country comparisons after controlling for other factors. I suspect this work has already been done somewhere and that relative corporate tax rates prove of little significance in explaining relative economic performance.
Just called the Iowa Policy Project and the person whom
I spoke with said there finding are “indisputable” and then
hung up.
They are a non-profit (very fitting title for the left) with 990’s
available for review.
“The policy prescriptions laid out in the ALEC report embody the right-wing agenda of ALEC: reduction
or abolition of progressive taxes, fewer government services, weaker or non-existent unions. To attain
the highest ranking would require a state to have no individual or corporate income tax, no estate or
inheritance tax, no state minimum wage, severe tax and expenditure limits and very limited public
services. It also would have to be a so-called “right-to-work state” — that is, it would provide no right
for employees to negotiate a union contract that requires all employees who benefit from the contract to
pay a share of the costs of negotiating it. Laffer and company have been arguing for five years that
adoption of such policies is the sure-fire prescription for state growth and prosperity. The better a state
ranks on their index of 15 such policies, the better its economic outlook, they say.”
Now I will done a Gore – and inform myself.
I have added a link to a study which does examine the correlation of growth with several indices (but not the ALEC-Laffer index), as an update to the post.
Menzie: Can you to the earliest date (I think it is not too long ago) for which ALEC published their index and do the exercise focusing on the outcomes from the date that version of the index was produced to most recent quarter (Q12014)?
jo: I could but it would take a lot of time since ALEC doesn’t provide the data in spreadsheet form, just PDFs. This article has links to all the issues (the 2014 issue is the 7th edition), so you should be able to do the analysis yourself, with the right statistical package (suggest R, an open source stat package). See also the links I have added at the end of the post.
Menzie, I know you like to compare Wisconsin to Minnesota. I suggest you compare Milwaukee to Minneapolis. Milwaukee is definitely not the stronghold of Gov. Walker. It has had a strongly Democratic Party government for decades. Milwaukee has a very high minority population whereas Minneapolis does not. Milwaukee represents 10% of Wisconsin’s population; Minneapolis represents a little over 7% of Minnesota’s. There are definitely factors affecting fiscal growth beyond a governor and Wisconsin certainly faces bigger demographic challenges. Now take Wisconsin’s challenge dealing with Milwaukee and compare that to Michigan’s challenge dealing with Detroit, Flint, and Benton Harbor. I excluded Madison and Lansing because those cities benefit from the money siphoned off from the rest of the state to run the state governments.
Perhaps the real issues lie in the major cities of the states and to the extent that the major cities are non-productive, the states cannot overcome that.
Bruce Hall Milwaukee has a very high minority population whereas Minneapolis does not.
Is your middle name “Clive Bundy”? How is this relevant to economic growth? Oh wait, most economic growth comes from population gain, so I suppose you mean to say that much of Milwaukee’s growth is coming from minorities coming to Milwaukee.
Milwaukee represents 10% of Wisconsin’s population; Minneapolis represents a little over 7% of Minnesota’s.
Doesn’t it make more sense to look at the county level? Afterall, for all practical purposes Hennepin and Ramsey counties are a single economic unit. That’s why they call it the Twin Cities. Milwaukee County represents about 16.7% of Wisconsin’s population. Hennepin and Ramsey represent about 29.4% of Minnesota’s population.
compare that to Michigan’s challenge dealing with Detroit, Flint, and Benton Harbor.
Have you ever been to the Detroit area? The city proper is desperately poor; but the Detroit metro area is very wealthy. Drive a few miles up Van Dyke Blvd and you’ll run into some pretty upscale areas. You see this with a lot of big cities. Wealthy suburbanites suck up all of the benefits of big cities while escaping the taxes and fees needed to support those cities. For example, wealthy suburbanites are usually the ones behind efforts to get city governments to pay for big sports complexes so that wealthy folks who live outside the city can have nice evenings at the ballpark or football stadium or hockey arena. And of course all the time demanding lots of police protection. And then they balk if they are asked to pay a stadium fee. Or they demand the amenities of nice restaurant districts downtown. Or airports maintained at city expense. And then blame the city workers because they are getting retirement benefits that are less than the Social Security checks they had to forfeit. You see this same kind of thing in St. Louis as well.
the major cities are non-productive,
I think that depends on whether you think suburban and ex-urban workers derive their productivity from where they physically work or from where they lay down their heads at night. Cities make workers more productive. The problem is that those productive workers take their paychecks that they earned in the city and deposit them in suburban businesses.
BTW, I grew up in one of those very wealthy and privileged suburbs outside of Chicago. Everyone in my neighborhood took the train into the city during the morning and after 5:00pm hopped the Roosevelt or Randolph St trains out of the city…except for all of those University of Chicago economics professors in my neighborhood who escaped to the suburbs via the Hyde Park station.
This is my surprise face: 😐
Definitely a victory for actual data over ideology!
One means of testing a state’s attractiveness is to consider population changes over time. A dynamic state should see increasing population; a poorly run state should be growing more slowly or losing population.
From 2000-2010, here are the top ten fastest growing states:
Nevada
Arizona
Utah
Idaho
Texas
North Carolina
Georgia
Florida
Colorado
South Carolina
I believe all of these are low tax, non-union states.
Bottom ten slowest growing states:
Pennsylvania (union)
Illinois (high tax, union)
Massachusetts (high tax, union)
Vermont
West Virginia (poor)
New York (high tax, union)
Ohio (union)
Louisiana (poor)
Rhode Island (high tax, union, corrupt)
Michigan (union)
The slowest growing states tend to fall into one of two categories: high tax/union, or poor. The “poor’ category deserves some special attention, I think, and we can contemplate whether a different governance regime might not benefit such states.
An interesting bunch is the second tier from the top, the 11th-20th fastest growing states, in order:
Delaware
Wyoming (lifestyle)
Washington (lifestyle)
Alaska (lifestyle)
New Mexico (lifestyle)
Virginia (DC)
Hawaii (lifestyle)
Oregon (lifestyle?)
Tennessee
California (lifestyle)
This second tier is a mixed bag of low and higher tax states, union and right to work. However, almost all of these states are lifestyle states, where people move for the weather or nature. Thus, in many cases, the inherent appeal of the state can compensate for otherwise undesirable qualities. Does anyone doubt that this applies to California? How would California’s numbers look if it had the climate of Texas?
The remaining states (21st-40th) are a mixed bag of union / right to work, high tax, low tax with no particular pattern apparent by visual inspection.
So, to conclude:
– Being a right to work, low tax state does not guarantee that people will choose your state, but all the fastest growing states have these characteristics.
– Being a high tax, unionized state doesn’t guarantee that migrants will avoid you, but just about all the non-poor states in the bottom tier have this characteristic
– Poor states qualify as a special group, and these need a wholehearted re-think of governance structures more than an ideological adherence to any given tax regime.
– Lifestyle states are also a special group, and can significantly offset other disadvantages simply because people want to live there for personal reasons. California and Hawaii are good examples.
– Massachusetts, home of Romney Care, has to be considered a truly notable failure. Given the state’s favorable location, its beautiful beaches and outstanding universities, policies in the state can only be considered poor. Even more so for Rhode Island.
– For the climate change challenged, note that the top three fastest growing states are hot, desert states and seven of the top ten fastest growing states would be considered hot or dry.
– And Menzie’s comment about omitting the top oil exporting states tells us all we need to know about the importance of oil. I’d also add that three of the bottom ten states are the traditional automobile producing states, which also tells us all we need to know about the importance of oil.
Nice pointers, Mr Kopits!
Almost all of the ‘winners’ have significantly better weather than the ‘losers’ so I don’t see how you can draw any conclusions without correcting for that. In addition, many of the ‘losers’ were in the earliest settled and higher density states than the new ‘winners’. You also somehow need to correct for inevitable diffusion. I’d characterize more like this:
!) In general, previously high density states are losing population to previously lower density states
2) In general, states with mild winters are gaining population from states with not so mild winters
3) In general, taxes and union membership are,relatively speaking, noise.
OK, so I checked, and without actually running the stats, it appears that migration is highly correlated with population density. I suspect that it you combine that with severity of winter weather, you have all you need to explain migration between states.
http://en.wikipedia.org/wiki/List_of_U.S._states_by_population_density
Wow, Menzie, the mere mention of the reality that demographic differences affect the economics of an area sends you on the “racist” meme. That’s truly disappointing. And yes, you could look at the county statistics as well. Include St. Paul with Minneapolis. Include all of Wayne county with Detroit. The point is that you are ignoring a strong indicator of economic strength versus weakness by ignoring demographics.
If you truly believe the data regarding minority [include Hispanics as well as blacks] has no bearing on economic strength or weakness] look at the average income for various areas. If you truly believe that the drain of state resources is not related to support for those minorities, examine the state spending patterns. I’m not saying that the demographic mix is the sole arbiter of economic success or failure, but it has a distinct bearing at the state level.
With regard to have I ever been to the Detroit area, uh, yes. I live in one of those areas outside of Detroit and worked in Detroit during the 1990s. I watched Detroit deteriorate under corrupt government and the weight of an 80% black population. At the same time, I lived in an area in southern Oakland county [considered wealthy] with middle class black neighbors who carried their personal and community weight. So, it’s not a racial issue, it is a problem of concentration of poor blacks… percent of total… in cities and any 10th graders can find the correlation between percent of blacks in a city and negative economic indicators. And those cities are definitely an economic drain on the states, unlike a city like San Francisco which has a lower-than-state percentage of blacks.
While there are people who travel to Detroit to work [I was one of them], I would venture from my own experience that, given a choice, few would. The politics of Detroit have driven out the educated, the entrepreneurs, the economically sound. Yes, there are some such as Mike Illitch and Dan Gilbert who have used the slow destruction of the city to get bargain basement deals on arenas and land. But they are the exception. Bankruptcy may hold off the consequences of Detroit’s demographics for awhile, but it will take more than that to bring vitality to that part of the state.
Milwaukee does not represent the same level of economic disaster to Wisconsin as Detroit does to Michigan, but Minneapolis/St. Paul has a much more positive impact to Minnesota than Milwaukee/Waukesha does to Wisconsin. By the way, I grew up in Milwaukee during the 50s and 60s so I am quite familiar with the area. It’s changed significantly since my relatives lived at 30th and North.
So, there, I’ve broken the leftist prohibition about never mentioning race and outcomes. Prove me wrong.
bruce hall,
i don’t suppose the decades of racism and discrimination which was targeted towards african-americans and latinos has had any lasting impact on the world we see today? lets see, in the 1950’s and 60’s and 70’s, inner city blacks were welcomed into job opportunities throughout the city metro areas, right? our history of bigoted behavior was one of many causes of the inner city decay, probably the major cause. this created defacto segregation, and that segregation created a barrier to access capital for jobs, infrastructure, etc in these communities. to fault the black communities without identifying these significant failures on the part of our country as a whole is not appropriate. this drives the arguments being made today about inequality. it is easy to say you are a self made man when you come from a background that could provide you access to an entry level job with prospects, access to capital via banks, business associates, etc. but we never made those “benefits” accessible to certain parts of our country to their demise. two different worlds, and only a city block apart.
Baffling, I am not making a judgment regarding the cause of the dystopia in predominantly or significantly black cities. I am making the case that some portion of the economic performance/recovery of a state can be related to the degree that state has one or more larger cities with predominantly or significantly black cities… especially when compared with states that do not. To ignore or gloss over such differences for fear of being politically incorrect is simply not rational.
You are reading too much into the argument.
bruce,
“If you truly believe the data regarding minority [include Hispanics as well as blacks] has no bearing on economic strength or weakness] look at the average income for various areas. If you truly believe that the drain of state resources is not related to support for those minorities, examine the state spending patterns. I’m not saying that the demographic mix is the sole arbiter of economic success or failure, but it has a distinct bearing at the state level.”
statements such as this imply the minority areas became unproductive on their own, and now are in need of bailouts because they are a drain of resources. but you really ignore the fact that our society helped to create these economically unproductive zones-the “white flight” to the suburbs-by moving accessible capital elsewhere. if you want a capitalist society, but then irresponsibly move the capital elsewhere, who is responsible for the outcome? manufacturing in the us shutdown and moved overseas-we relocated the capital expenditures-and the result was a downtrodden midwest rust belt. in your view, these cities are nothing but a drain on the more “productive” areas of the country. probably not the best way to look at the problem.
Baffling, you can “imply” whatever social morality you perceive to the data. The only thing it shows to me is that there is an economic impact based on the black percentage of the population of large cities. The data do not contain statements about how to change the perceived moral issues. The point was to examine the changes in Minnesota versus Wisconsin. I threw in Michigan as a bonus.
As to the “whys”, there are many factors. I know for certain the triggering point for Detroit’s demise was the 1967 riots despite have problems similar to other large cities prior to that. There are many “explanations” as to why those riots happened, but the fact is they did and the city emptied of whites and many upper/middle class blacks. That opened the door for politicians like Coleman Young, Sr. and Kwame Kilpatrick to pander to the poorer and poorly educated blacks that became the majority which ultimately created the culture of corruption and mismanagement that is a huge drag on the state.
bruce, you are confusing minority communities with poor communities. plenty of minority communities around the country thrive. poor communities do not. and there are actions we have taken to make these communities poor-many of them having to do with discrimination. plenty of smaller towns throughout the midwest suffer, and they are vast majority white. it is not a minority thing, as you argue. it is a “poor” thing. this has much to do with income inequality in our country.
Rather than dots in a box, is there another metric that could be
used?
And what time frame should be used? Certainly a single year or
fives is far too short, IMHO.
Bruce Hall: I believe you have me confused with somebody else. If I may be so bold, I suggest you review the comments, paying careful attention to names and associated comments; the commenter’s name is above the comment. In other words, don’t be so quick on the trigger finger.
Menzie, I apologize profusely. I should have realized that you would not write that comment. I saw your name in bold in a reply to Jo above my post and when I hit “page down” and read the reply to my post, strung the two together.
However, 2slug, my comments stand for you.
Here Dr Fischer summation:
“The moral of the story is quite simple: The policy prescriptions in Rich States, Poor States do not help at
all to explain why some states created more jobs than others, or why some states experienced more
growth in income per person than others, over the past five years. In other words, the policies that make
up the Economic Outlook Ranking are not a recipe for growth and prosperity. If anything, they are quite
the opposite: They are a recipe for economic inequality, low wages, and stagnant incomes that at the
same time deprive state and local governments of the revenue needed to maintain the public
infrastructure and education systems that are the underpinnings of long term economic growth.”
I can accept Dr Fischer’s first half explanation but the latter opinions are without merit and bias
and undermines his objectivity…To suggest that economic incentives are an inducement for economic
(inequality) low wages, and stagnant incomes is not only reprehensible but an assault on common
sense from this numbers guy.
As a longtime governmental unit employee, he laments the loss of revenue to the non-profit industry;
monies that are being redirected to (working) families and businesses…Apparently, Dr Fischer is not
satisfied that governmental units consume over 33% of the GNP.
The Good Doctor is clearly giving a partisan view, which is always a matter of concern…But then Academia
itself is a suppliant of government funding.
I’ve compared Laffer’s outlook and performance rankings each year since RSPS was first published. His own data shows he was wrong to begin with, and has grown less accurate each year since. In this 7th edition of RSPS, Laffer has proven his own predictions wrong more than 60% of the time.
Nearly one-quarter of states (12) have an economic performance ranking this year that differs by 20 places or more from their outlook ranking last year. The average of this “Laffer Error” for all states is now 13.5 (up from 12.2 last year, and 11.9 the year before). Lowering the bar for success doesn’t help. This year, in 31 out of 50 states (61%), Laffer predicted a state would do worse economically, when it actually did better, or vice-versa. That’s up from 56% in 2012, and 50% in 2011. At this point, a coin flip is actually a better predictor of economic performance than Laffer’s report.
A lot of this ALEC stuff just seems to be an encouragement to eat your seed corn. I guess you could distribute the proceeds of say the gas tax to the CEO’s of companies that you like to play golf with and maybe then cut the rates even further but sooner or later despite the ‘death by a thousand cuts’ that you inflict on the public someone would notice that the roads aren’t in too good of shape. I keep wondering with this constand degrading of the teaching profession in both salary and prestige exactlly who is going to bother entering the profession. I suppose we could go on but it just seems that running an economy based on short term interests of business is a bad policy.
“A lot of this ALEC stuff just seems to be an encouragement to eat your seed corn.”
How keeping more of your labor eating your seed corn???
Do you really need an exposition concerning the importance of good infrastructure and a well educated population for economic growth?
Why not simply use GNP minus government growth rates over
a period of some twenty years and compare them to the ALEX
survey?
The trend from 2009 to 2012, shows little correlation between
growth and the Laffer rankings.
http://bea.gov/newsreleases/regional/gdp_state/gsp_newsrelease.htm
Hans: Since the Map Figure only provides 2012 growth, I’m not sure how you arrived at your conclusion regarding 2009-12 growth.
I am amazed that CA has such a high Laffer/ALEC score!
Weird