It’s interesting how “pro-business” policies do not appear to be conducive to rapid employment growth.
Employment in Governor Walker’s Wisconsin, as in Governor Brownback’s Kansas, has lagged behind that of the United States (and behind that of Governor Dayton’s Minnesota and Governor Brown’s California).
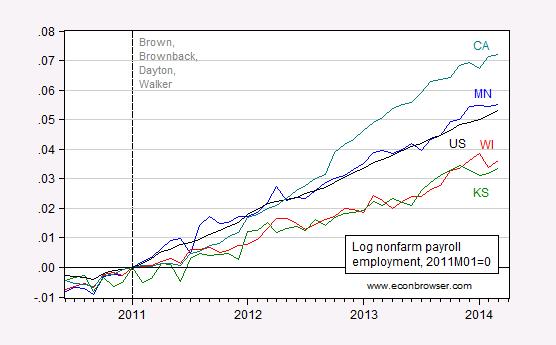
Figure 1: Log nonfarm payroll employment in Minnesota (blue), Wisconsin (red), Kansas (green), California (teal),and the United States (black), seasonally adjusted, 2011M01=0. Source: BLS, and author’s calculations.
Notice that Kansas and Wisconsin, ranked 15th and 17th in terms of the ALEC-Laffer “Economic Outlook Rankings”, are doing equally badly relative to US employment growth. In contrast, Minnesota (ranked 46th) is outperforming the United States and those two states. The cumulative employment gaps are 0.021 and 0.019, since 2011M01 (inaugurations of Governors Brownback, Walker and Dayton). The ALEC-Laffer methodology equally weights 15 measures: Top Marginal Personal Income Tax Rate, Top Marginal Corporate Income Tax Rate, Personal Income Tax Progressivity, Property Tax Burden, Sales Tax Burden, Remaining Tax Burden, Estate/Inheritance Tax Levied, Recently Legislated Tax Changes, Debt Service as a Share of Tax Revenue, Public Employees Per 10,000 of Population (full-time equivalent), State Liability System Survey (tort litigation treatment, judicial impartiality, etc.), State Minimum Wage, Average Workers’ Compensation Costs (per $100 of payroll), Right-to-Work State (option to join or support a union), and Number of Tax Expenditure Limits.
What about California? It is ranked 47th by ALEC-Laffer, and yet is doing the best in terms of employment amongst the four states. This does not deny the relevance of these indices, but for sure the correlation of the index with performance is not obvious to me. (These rankings are persistent — in 2012, Kansas and Wisconsin were ranked 26 and 32 respectively, while Minnesota and California were 41 and 38 respectively.) So, the higher the ranking according to Arthur Laffer, Stephen Moore (currently chief economist of Heritage), and Jonathan Williams, the poorer the employment growth.
Moreover, it is not apparent to me that broader measures of economic performance (i.e., the Philadelphia Fed’s coincident economic indices) tell a different story (see this post).
In terms of Wisconsin’s performance relative to stated goals, private nonfarm employment is projected by the Wisconsin Department of Revenue to fall far short of Governor Walker’s goal (reiterated 8 months ago) of 250,000 net new jobs created.
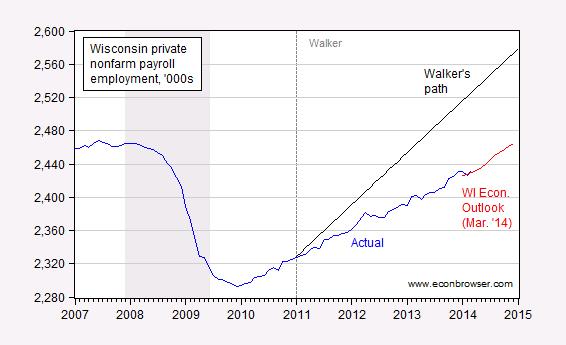
Figure 2: Wisconsin nonfarm payroll employment (blue), Wisconsin Economic Outlook (March 2014) forecast, quadratic match interpolation (red), and Governor Walker’s goal (black). NBER defined recession dates shaded gray. Source: BLS, Wisconsin Economic Outlook (March 2014), NBER, and author’s calculations.
As of March, employment is lagging goal by 94,300. Using the Wisconsin Department of Revenue employment forecast (interpolated), employment will lag the trend goal by 108,400 in December 2014.
One final point. Some observers (e.g., the irrepressible Ed Hanson) have argued that January 2013 is the right point in time to assess the impact of altered fiscal policies in Wisconsin. The annualized month-on-month growth rate in Wisconsin was 1.3% in the first two years of Walker’s administration. Since January 2013, the growth rate has accelerated … to 1.3%.
Update, 7AM Pacific 5/10: An econometric addendum to this post is here.
Professor Chinn,
Based upon the charts that you present, it seems that the premise is: “High” union membership and a “high” minimum wage policy create the path to prosperity for a state? If this is the premise, it would be helpful for you to explain why this premise is true for those of us who are not economists. The connection between union membership and a high minimum wage does not seem self-evident as a cause of prosperity.
If I read the Laffer index properly, it seems to like income and wealth inequality. For instance, estate taxes and progressive income taxes seem to be considered bad. On the other hand, Union membership and minimum wages increase wages at the lower end of the scale, and reduce income and wealth inequality.
The wealthy tend to spend less of their income – that will reduce aggregate demand. In a period where a large output gap exists, that will reduce economic output.
So, greater income inequality will reduce economic growth.
Thanks for adding two more states. This is starting to become something totally awesome. Can you write an academic paper using a cross-sectional time series model of all states over time, regressing on Low Tax/Right-to-Work/Low Minimum Wage policies and also austerity? if you do, it would be such a great paper! Anyway, still love this, keep it up!
You are using California as an example of growth? This is an alternative reality post.
Top 6 2014
ND – do we count petrostates? Of course we do!
TX
OR
WA
MN
CA
Regards.
Using Fred, I plotted the non-farm employment series indexed to 2007m12 = 100. The difference between WI and CA is not nearly so stark (CA was performing worse than WI as recently as 3/2013), although CA is certainly continuing on its upward trajectory. CA had a more severe recession than WI so we should expect some catch-up growth as they revert to the mean.
http://research.stlouisfed.org/fred2/graph/?chart_type=line&recession_bars=on&log_scales=&bgcolor=%23e1e9f0&graph_bgcolor=%23ffffff&fo=verdana&ts=12&tts=12&txtcolor=%23444444&drp=0&cosd=1990-01-01%2C1990-01-01&coed=2014-03-01%2C2014-03-01&width=670&height=445&stacking=&range=&mode=fred&id=CANA%2CWINA&transformation=lin&nd=&ost=-99999&oet=99999&scale=left&line_color=%234572a7&line_style=solid&lw=2&mark_type=&mw=3&mma=0&fml=a&fgst=lin&fq=Monthly&fam=avg&vintage_date=&revision_date=
MMMM? Makes one wonder if business gives a hoot about “business friendly” state policies. Maybe they give a big hoot about market size and resources to exploit. I don’t mean “exploit” as evil, just that resources are there in quantity. California is a big state with lots of resources, people and materials and its environment can’t be described in one word, like flat agricultural. California is like the girl with the curl in the middle of her forehead: When times are good they are very good and when times are bad they are very bad.
When I worked for the Colorado legislature’s budget committee, I spent quite a bit of time with the Governor’s Office of Economic Development. Their primary mission is to attract businesses to the state. At some point I asked what kinds of things businesses considering a relocation asked about. They told me there were two kinds of companies. High-wage companies worried about education at several levels (K-12, college, current workforce), transportation, health care, and quality of life things like symphonies and zoos. Low-wage companies worried about tax rates and cost of regulations.
True, Colorado which is less Hispanic than Texas and California and this is not a conservative or racists observation usually has more of the population that finishes high school and college. Steve Murdock a demographer who came from Texas mentions that Texas’s demographic changes from White to Hispanic has made it less desirable sometimes against states like Colorado and and more so in the future. Hispanics are behind Whites and Asians in all three states but they are the fastest growing in the younger ages.
The Laffer analysis is set up to deliver high rankings to conservative states (“I’m shocked, shocked, at the misuse of statistics by conservatives”) through the use of binomial value variables for a number of the categories. Since a conservative-pleasing policy rates #1 while a conservative-displeasing policy receives a #50 in this “analysis” it is not surprising that states that actually produce jobs above the national average are low-rated. What is surprising, however, is that a state like Wisconsin could only rate 17th even with a couple of binomial #1s. However, since the state does not have right to work laws it gets a #50 which drags down the ratings. Had Wisconsin enjoyed the right to serfdom, then its overall ranking would have approached the top ten.
The idea that January 2013 represents a better analysis point ignores both the statements of the Walker Administration as well as the operational dates of many of their policy initiatives. At the height of the Recall Election it was the explicit, stated position of the Administration that scores of employers were waiting until after the election, at which point the hiring by these mysterious parties would “skyrocket” (their words, and the source of the WMC’s “Skyrocket” Ad of last summer). State workers are well-aware that the impact of new employment policies occurred in January 2012. Just another example of the endless goalpost moving behavior of the failed Walker Administration.
I have yet to be particularly convinced anything more that idiosyncratic factors are driving these results over the short tern. Wisconsin and KS are a so-called judicial foreclosure state, MN and CA are not. Foreclosures are still ~2x higher in WI than MN, and unsurprisingly, WI construction employment growth lags MN considerably. WI and KS foreclosures rates and distressed sales are higher than CA and MN. Maybe that means something, for construction employment.
But, VA and MD are two other case studies. Both lag the nation considerably in YoY employment growth. That’s federal budget cuts, not (merely) tax or business policy. Maryland is 34th, VA is 11th. Yet, both are near rock bottom in YoY employment growth.
Actually, I am somewhat surprised maryland is 34th in this study, the business climate is atrocious. Looking at the “economic outlook” ranking for MD (p 29), I don’t see why there would be a sudden jump from 20 in 2012 to 35 in 2013. The “Public Employees Per 10,000” figure looks totally wrong to me too. Debt Service as a % of Tax revenue also looks wrong to me. The Department of legislative Services for MD puts it at 9.5% for FY 2013. There is also at least 20Bn in unfunded penion liabilities which have to be paid for, eventually. Oh well. garbage in, garbage out.
But look at the USA trend line, the whole country is doing better than these austerity/rightowork etc states. So, the USA trend line accounts for idosycrantic factors of any particular state. Also note that they were all very close in performance in 2011, before austerity, and diverged after it’s implementation. It is very convincing to me that austerity failed these states…
XO: There are only four out of 50 states on this graph. If you think 4 data points is convincing, PM me I have some some nice property in MD to sell you.
Seriously, there are many states from “pro-business” Kentucky to Maryland that have lagged in year-over-year employment growth, as of March 2014. WI and MN are slightly below and above average (1.6/1.4% respectively), while New York is below average and NJ is near the bottom (0%). On the other hand, CA and TX are both near the top (2.2 and 2.8% respectively). If you a see a correlation with ALEC-Laffer rankings, then perhaps share with us the great pot you found in Colorado.
Some states I venture are driven by excess foreclosures, still. Others are driven by federal govt cutbacks, still (like VA, MD, and maybe Alaska). Yet others are probably driven by immigration (like FL, AZ). North Dakota, and Colorado, shale. Texas is probably some combination of shale, immigration, and guns. Because, everyone moves to Texas for guns and oil, right?
Don’t laugh, with four data points I can make up anything I like and not be wrong.
No, there is a US line on the graph that contains the information from all states. Please look again. Also, why the need for the tough-talk and belligerence? I was courteous to you, and you were condescending and hostile to me. There is no need for that…
XO, not all the right to work states are on this graph. Not all the *non* right to work states are on this graph. What is on the graph is just as important as what’s not. There are only 4 data points!
No, there is black line called “US”. US stands for United States. That line contains information for all 50 states together. So, that contains 50 data points, and the austerity states are doing worse that the whole country, after austerity etc. in 2011, but not before.
http://www.bls.gov/web/laus/lauhsthl.htm appears unemployment in California is 8.1 , but Wisconsin is 5.9….
Do not need post grad degree to see which has lower unemployment.
don klick, it seems to require a post grad degree to be able to ignore Wisconsin’s low unemployment rate, as I’ve pointed it out to Menzie myself.
It’s also not hard to see why California has such a high rate. Even though the state of California’s minimum wage is only $.75 higher than Wisconsin, several cities have enacted much higher minimums. San Francisco’s is over $10.
Patrick R. Sullivan: I have written a post for your benefit, with specific reference to fixed effects. I hope you will incorporate this information into your next analysis of panel cross-section time series data. At the very least, I will hope you will read an econometrics textbook so you know what you are writing about.
San Francisco’s unemployment rate is currently 4.6%. If the higher minimum wage is causing unemployment, we’re not seeing it (I live here). Part of the housing crisis here is being caused by businesses expanding too rapidly here as it seems every social networking company wants to put their HQ in the same few square miles (SOMA – South of Market).
don klick: I have written a post for your benefit, with specific reference to fixed effects. I hope you will incorporate this information into your next analysis of panel cross-section time series data.
don klick And you shouldn’t need a post graduate degree to notice that Menzie’s chart reflected the log change in employment, not the unemployment rate. Understand the difference? Gov. Walker’s promise was not to get the unemployment rate down to some target; his many times repeated promise was to increase total employment by 250k net new jobs. In any event, I believe Menzie’s point was that avowedly pro-business state governments don’t seem to actually do a very good job of increasing employment. Why is that? I believe that one reason is because many governors…and GOP governors in particular, seem to confuse public and macroeconomics with household and private business economics. So you see all of these clueless governors trying to solve macroeconomic unemployment due to the business cycle using tools that are only appropriate for structural unemployment. When you misdiagnose a problem you shouldn’t be surprised that you also end up using the wrong set of policy tools.
Here are the Philly Fed’s last 5 leading indicators for three states;
California Minnesota Wisc
Oct-13 1.84 1.66 1.66
Nov-13 1.32 1.17 1.47
Dec-13 1.28 1.38 1.88
Jan-14 1.47 0.89 1.52
Feb-14 1.38 -0.94 1.11
Mixed bag for California, but Wisc looks better than Minn. (next door).
Patrick R. Sullivan: Excuse me if I don’t understand your methodology, but what is the point of showing a time series of the leading indicators? I would think simply the most recent, incorporating the most recent data, would be relevant. Hence, the mixed bag is irrelevant.
In any case, the leading indicator tells one about the expected gradient, but not the level relative to other states. In order to determine that, you need iterate the growth onto the level of the coincident indices, as I have on several occasions.
Okay, let’s try another format
Oct-13 Cal: 1.84, Minn: 1.66, Wisc: 1.66
Nov-13 Cal: 1.32, Minn: 1.17, Wisc: 1.47
Dec-13 Cal: 1.28, Minn: 1.38, Wisc: 1.88
Jan-14 Cal: 1.47, Minn: 0.89, Wisc: 1.52
Feb-14 Cal: 1.38, Minn: -0.94, Wisc: 1.11
Yeah, Wi can get away with cutting education since most folks in the state are white middle class while California and Texas are not. A study by Steve Murdock who worked for the US Census states that Texas and California will have difficulties in the future because they are shifting from Whites who tend to have higher incomes and educatoins to Hispanics which have lower incomes and educations. Both states are limit for k thru 12 spending to get their Hispanic populations up to gear. Usually conservatives that complain about California’s high Hispanic population will ignore the difficulties that Texas’s high Hispanic population. As for Vermont it has both low poverty and low unemployment it doesn’t need to grow fast in jobs.
Peter Fisher of the University of Iowa did a much more extensive analysis of the ALEC data in December 2012 for the Iowa Policy Project and Good Jobs First, with results largely consistent with yours. He performed correlations with all 50 states as well as multiple regression analysis. ALEC policies produced no economic benefit, but they are all designed to decrease taxes on corporations and the rich while reducing workers’ bargaining power, causing increasing inequality.
Link: http://www.iowapolicyproject.org/2012docs/121128-snakeoiltothestates.pdf
My commentary on the report: http://www.middleclasspoliticaleconomist.com/2012/12/conservative-alec-economic-policies.html
Kenneth Thomas: I agree that Dr. Peter Fisher did a more comprehensive analysis than I conducted in this post; however, in an econometric addendum, I performed a different (not necessarily better) analysis (rankings vs. rankings, via an ordered probit). In that post, I cited Dr. Fisher’s work (see link near end of post). I also cited a peer-reviewed article by Kolko et al.