The Philadelphia Fed has just released leading indices for the states. Wisconsin growth is forecasted to decelerate from March growth rates, while Kansas forecasted growth is near zero since the beginning of the year.
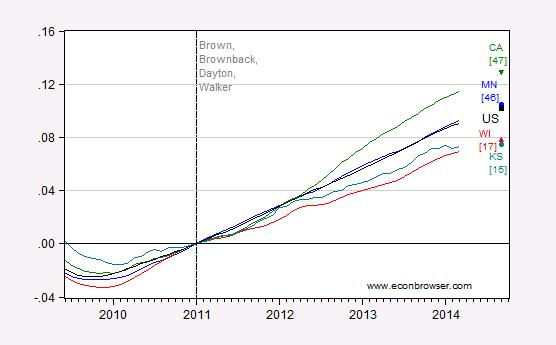
Figure 1: Log coincident indices for Wisconsin (red), Minnesota (blue), Kansas (teal),California (green), and US (black), all normalized to 2011M01=0. Observations for 2014M09 are forecasted levels using leading indices. Numbers in [brackets] indicate ALEC-Laffer 2014 rankings for economic outlook. Source: Philadelphia Fed coincident and leading indices for March, ALEC-Laffer 2014, and author’s calculations.
Notice Wisconsin is converging to Kansas’s dismal outlook. Wisconsin and Kansas are fairly highly ranked according the ALEC-Laffer index (2014 edition). In contrast, Minnesota, performing on par with the United States since 2011M01 was ranked 46th. And California, far outperforming Wiconsin and Kansas, was ranked 47th. As noted in this post, the correlation between the ALEC-Laffer rank and growth rank is negative, if anything. The forecasts do not upset this characterization.
In Figure 1, I have plotted the indices over a slightly longer period (2009M06 onward) to highlight the remarkable reversal in Wisconsin growth post-2011M01. Notice that Wisconsin growth was faster than Minnesota growth before 2011M01, and then decelerated relative to Minnesota thereafter.
Another notable development is the marked deceleration in the Kansas economy. Since January, growth has stalled, and the forecast is for more of the same. What’s with the Kansas economy? The recent report by the Kansas Governor’s Council of Economic Advisors is not very illuminating. Here is one take on the phenomenon from Coy/BusinessWeek:
A little more than a year has passed since the first phase of the Brownback tax cuts went into effect on Jan. 1, 2013, so it’s possible to make a preliminary assessment of their effects. The early verdict: not too good. The jury is still out on whether lower taxes will stimulate businesses to expand and hire over the long term. But the immediate effect has been to blow a hole in the state’s finances without noticeable economic growth.
This sounds remarkably similar to what happened in Wisconsin, at least in macro terms. (See also CBPP.)
I wonder when the failure to expand Medicaid in the red states will begin to show up in the divergence of economic growth. That’s a lot of Federal money those states are rejecting out of pure spite.
If you just look at the map from the Philly Fed, it’s obvious that tax cuts and that ideological approach generate no better and sometimes worse results.
This entire discussion and all these posts about Wisconsin are, to me, a brilliant example of the focus we give to “small effects”. If we saw sociology papers that reported effects of this magnitude, we’d scoff and say the results are just small effects. But put the same type of results in an ideological framework that insists results must occur, which sees results when they aren’t there, which excuses bad results for some reason or the other, then we completely forget these are small effects … and they must be small effects because if they were large, then we’d be able to see the results clearly and we’d rationally move in the direction of those results.
But look at the Philly map: you’re better off in the Northeast than the South in general. Take out energy states – notably ND and TX – and you still see no meaningful pattern. Or as I like to say to my southern relatives: if that system is so good, then why isn’t the south richer? It’s been 40 years and in that time entire nations have risen from poverty to affluence but the south still lags. In other words, the choice of tax system, etc. is a small effect relative to what other states do.
You an make an inital assessment one year after tax cuts? Really?
john, we had assessments on obamacare before it was even enacted. really!
And yet California’s costs and taxes and policies are not necessarily leading to real growth. If I drop a golf ball down a 10 ft. hole, I will get a larger rebound than if I drop the same golf ball down a 1 ft. hole. But the golf ball will still be lower in the 10 ft. hole.
http://www.forbes.com/sites/dalebuss/2014/04/27/it-makes-sense-for-toyota-to-leave-california-for-texas/
Bruce Hall: If you care to pull up the data (the URLs for the data set is provided under the Figure), you will see California dropped less than Wisconsin during the Great Recession, and yet is outpacing Wisconsin (I normalized both series to 2007M12 to compare). How exactly does your metaphor work? Assuming a black hole distorts the time-space continuum? All I ask is that people contact reality once in a while.
I’d have to answer that with “which economic data?” Certainly not employment. Certainly not city bankruptcies. California has certainly benefited from the high tech growth of Google and other similar companies in the “Silicone Valley”, but one must consider that these “money machines” are not typical of the state. Wisconsin is certainly a more staid state.
Regardless, in 2009, California experienced a negative 5.1% growth versus Wisconsin’s negative 2.8% In 2010, +0.3% versus +3.1%. In 2011, 1.2% versus 1.3%. In 2012, 3.5% versus 1.5%. In 2013, 2.3% versus 1.1%. In 2014, 2.3% versus 1.6% [of course, Wisconsin was affected by the severe winter which James Hamilton wrote about here: https://econbrowser.com/archives/2014/04/u-s-growth-stalls
I think the metaphor of the rebounding golf balls is quite appropriate.
http://www.usgovernmentspending.com/compare_state_spending_2014pZ0H
According to just released data from the BEA real personal income rose 3.4% in California in 2012 as compared to 2.3% for the US as a whole.
That would be consistent with the 2012 growth in the data I referenced. Also consistent with the larger rebound from the larger fall.
Bruce:
Isn’t the issue that Walker said that his policies would deliver growth and they have not. How do you explain that failure?
Robert–THAT issue (i.e., his policies would deliver growth and they have not)–is the ISSUE/problem with Obama. But then we all know this is a failure liberals are not interested in discussing so, instead, you do an Obama-like distraction by focusing on Walker. Unlike Obama, at least you guys are transparent.
Anon and lazy:
You are ducking the question raised in this post. I’d love to read your data about Wisconsin. If you want to discuss Obama, then wait until that issue is raised.
Robert, no doubt that Walker over-promised as Obama has done. The point I was making is that California is certainly not the shining example that Menzie was making it out to be. The U.S. economy is filled with mixed signals that, to me, indicate a fundamental weakness related to lack of job creation which has not and maybe cannot be addressed without policy changes. Here in Michigan, we have also experienced the California “drop a golf ball in a 10 ft. hole” rebound, but I wouldn’t say that things are rosy. It’s too easy to cherry-pick the statistics when we need to examine the underlying malaise. Loans to banks and zero interest rates shoring up the federal government debt are not finding their way into consumers and small businesses fast enough to offset the regulatory and tax burdens that are, in fact, growing. I suspect that the shakeout is far from over despite Wall Street’s enthusiasm.
Where are Illinois and Texas, or even North Carolina?
Robert,
I believe Walker’s primary goal was to pull Wisconsin out of the deep red ink and fix the budget problems. He inhertied a massive deficit and has balanced the budget. U seem mad about this.
anonymous, so walker reduced the deficit and balanced the budget during a recession. and resulting growth was lower than other states who did not do this-including the country as a whole. you should be angry for the lack of growth these policies provided.
I am not sure how you could surmise I am mad. I look for data to support arguments. When someone switches to another subject, I suspect he does not have any data to support his beliefs.
Here’s the map of LEADING indicators;
http://www.philadelphiafed.org/research-and-data/regional-economy/indexes/leading/2014/LeadingIndexes0314.pdf
Tells a different story than the one Menzie is fixated on.
Patrick R. Sullivan
Forget the map, try looking at the data in the Excel spreadsheet. The numbers are exactly as Menzie’s graph shows. The map’s light green covers a pretty wide range. The detailed information shows Wisconsin with a positive leading indicator, which I guess is better than a negative one (the kind you are likely to find in much of the Old Confederacy); but Wisconsin is also lagging Minnesota and the US overall. Maybe Walker should have spent less time worrying about the state’s budget and more time worrying about the state’s economic position. Walker seems to think that the purpose of state fiscal management is to try and run surpluses; i.e., the household model run-a-muck. Then again, if he really cared about the state’s fiscal position, why did he give all kinds of giveaways to his crony friends like the Koch Brothers?
Prof. Chinn,
Your graph showing little or no relation between ALEC “business friendly policies” ranking and economic growth was informative.
With commenter Ricardo, I’d like to see data for specific states, such as North Carolina or Florida (my state), that have put in place and boast about strongly (supposedly) pro-business policies.
I know that you can’t put fifty states onto your graphs above, but perhaps some other ones with comparisons with the US average and neighboring states with differing policies.
Thanks.
You can find statistics broken down by states at BLS. For Wisc; http://www.bls.gov/eag/eag.wi.htm
For Minn; http://www.bls.gov/eag/eag.mn.htm#eag_mn.f.2
Not too much difference. Both states have a civilian labor force of about 3 million with almost no difference in the number of employed. One thing that is noticeable is the steady decrease of unemployment in Wisconsin over the last half year, while Minnesota’s is basically flat.
I note with some amusement that Minnesota’s state minimum wage is only $6.15 (for really small businesses it’s only $5.25). Maybe that helps to explain the unemployment rate below 5%!
Patrick R. Sullivan: But for all workers subject to the Fair Labor and Standards Act, the minimum wage in Minnesota has been the same as Wisconsin’s: $7.25. You seem to imply the lower rate for certain workers in Minnesota means more workers face a lower rate in that state. As noted by Ivey/CapTimes, that is not the case: “… despite the minimum wage difference, some 94,000 people in Wisconsin, about 5.4 percent of the hourly workforce, earn $7.25 or less. That compares to 60,000 or 3.9 percent of workers in Minnesota, according to the Bureau of Labor Statistics.”
Would it kill you to consult some data, before commenting?
Would it kill you to cite something other than a piece by The Cap Times (‘Your Progressive Voice’), Menize? Or to actually read their source which is; ‘Characteristics of Minimum Wage Workers: 2012’.
My data was from BLS March 2014.
Patrick R. Sullivan: It is a truth held self-evident that if one is to complain about the use of a particular vintage of data (or citation of a particular vintage of data), one should know whether using a more recent vintage substantively changes the results. So, referring directly to page 6 of the 2014 BLS publication (which pertains to 2013 data), one finds that at or below minimum wage count in Minnesota at 64K, Wisconsin at 91K. Does this in any way change the implications? I don’t think so.
Hence your comment in a typical economics seminar would cast you in the light of the irritating gadfly who states ultimately irrelevant observations on the data, which only serve to highlight one’s own fatuousness.
By the way, I think we can excuse Mr. Ivey for using the 2013 issue (which detailed 2012 data) because…when he wrote the article in January, only the 2013 issue was available.
Once again, thank you for your comment.
How many businesses are leaving Wisconsin?
http://www.reuters.com/article/2014/04/28/us-autos-toyota-motor-texas-move-idUSBREA3R1AF20140428
Nissan and Honda had already left.
Toyota’s Jim Lentz says they moved because of, ‘…a friendly overall business climate and certain advantages for Toyota employees, from affordable housing and shorter commutes to the absence in Texas of a personal income tax.’
and tax breaks. which is great in year one, but in a few more years the communities will need the tax revenue for services to the new occupants. then they have a problem. we see this over and over again around the country.
The Philidelphia FED states: “Current and prior values of the forecast variables are used to determine the future values of the index.”
I usually do not take issue with statistical analysis because normally the numbers are just what they are but here this statement demonstrates the fallacy in the projection. The projection is based on history at a certain place and time different from what we will experience in the future. The past does not predict the future.
No one would but much weight into taking the past results of NBA teams over the years and “forecast” who will win this year or next year. The LA Laker would undoubtedly be favored. But the past is history in a different place and a different time. But what you can to is look at the makeup of the teams and how they have changed. The strength of the current players and the current environment. Few would doubt that your results would be much better than the historical analysis. But in demand side econometrics history rules. Laffer will be more accurate because he considers conditions rather than history.
ricardo,
“The projection is based on history at a certain place and time different from what we will experience in the future. The past does not predict the future.”
but you fail to grasp the economy is a more or less continuous function, as opposed to a basketball season which is reset at regular intervals creating a discrete function, wiping out past performance. in an economy, your past can haunt you (think debt) or help you (large profits). the economy is not reset and normalized on a yearly basis. our habit of talking about quarterly and yearly data can sometimes mislead our thinking. these historical interactions are less severe in the discrete basketball season. yes there is some carryover of players, but win-loss record, the important measure, is reset every year.
Where taxpayers are fleeing and where they’re headed to
Excerpt:
“The 2010-11 data shows that, as in the past, there is a large migration away from high-tax states to low-tax states. The biggest gainers were the two megastates with no state income tax: the net gain in taxpayer income from migration was $4.9 billion in Florida and $2.4 billion in Texas. The biggest losers were high-income-tax states: New York (-$3.3 billion), Illinois (-$2.0 billion), New Jersey (-$1.7 billion) and California (-$1.0 billion). That amounts to a net transfer of more than $7 billion to those first two states from the latter four.”
The question is, does a tax cut motivate businesses to hire, expand, be retained or attracted to a particular State, etc. Having worked for several decades with small business’ lending, in my experience business persons are concerned less about the accounts on their P&L as they move down from sales. So their principal concern is sales, then cost of goods, then operating expenses, then profit (before tax) and then taxes. On the balance sheet side they are concerned first with cash, then inventory, then receivables, then payables. then everything else. Large corporations have sufficient accounting staff that they can be concerned about all P&L or Balance Sheet accounts. So the difference is that the small business person is concerned about taxes when they need to be paid whereas the large business person is sensitive to taxation at most times. So, these two broad categories react differently to the stimulus of a tax cut.
So, why are businesses always bitching about taxes and regulations? The answer is to be found in the question, “what about government bothers you (or something similar)? The business person mentally sorts through the issues they face which have something to do with government and complains about taxes and regulation. If the question were “what is there about inventory that bothers you”, one would get an earful about unreliable suppliers, shortages, being overstocked in some items, rising costs for certain commodities, and on and on. If the question were “what concerns you the most” the answer in most cases would be either sales or whatever was bothering them at the moment (such as a raw material shortage or a jump in health care premiums.)
Based on my experience discussing these things with small businesses my conclusion is that those advocating reducing taxes in the hopes of increasing employment or increasing total tax revenue simply do not understand what issues are foremost in most business persons’ minds since they are almost only exposed to the “what about government” question. Consequently they make a false conclusion as it relates to the strength of the cause (reducing taxes and regulations) and effect (more employment, etc.)
Another fallacy in my experience is the notion that reducing after tax income (either through lowered profitability or increased taxation) will somehow demoralize the business person. Quite the opposite. Increased threat to the business usually causes the entrepreneur or officership to redouble their efforts, not throw up their hands in despair. I suspect that our overall lackluster growth rate and investment in CAPEX is somewhat attributable to fat and happy stockholders and executives whose gross margins are plump and whose cash reserves are generous without their having to take risks.