Gasoline prices in the United States have risen sharply recently, leading some newspapers to round up the usual suspects.
| New Jersey Historical Gas Price Charts Provided by GasBuddy.com |
But the reality is the price of crude oil has been remarkably stable over the last three years.

Price of Brent crude oil, in dollars per barrel, weekly Jan 7, 2000 to April 18, 2014. Data source: EIA.
The international price of crude oil ultimately determines the price Americans pay for gasoline at the pump. Seasonal factors can bring the price temporarily below the long-run relation, and this accounted for the temporarily low gasoline prices that we saw last fall and winter. Movements in gasoline prices back up this spring are basically a return to normal.
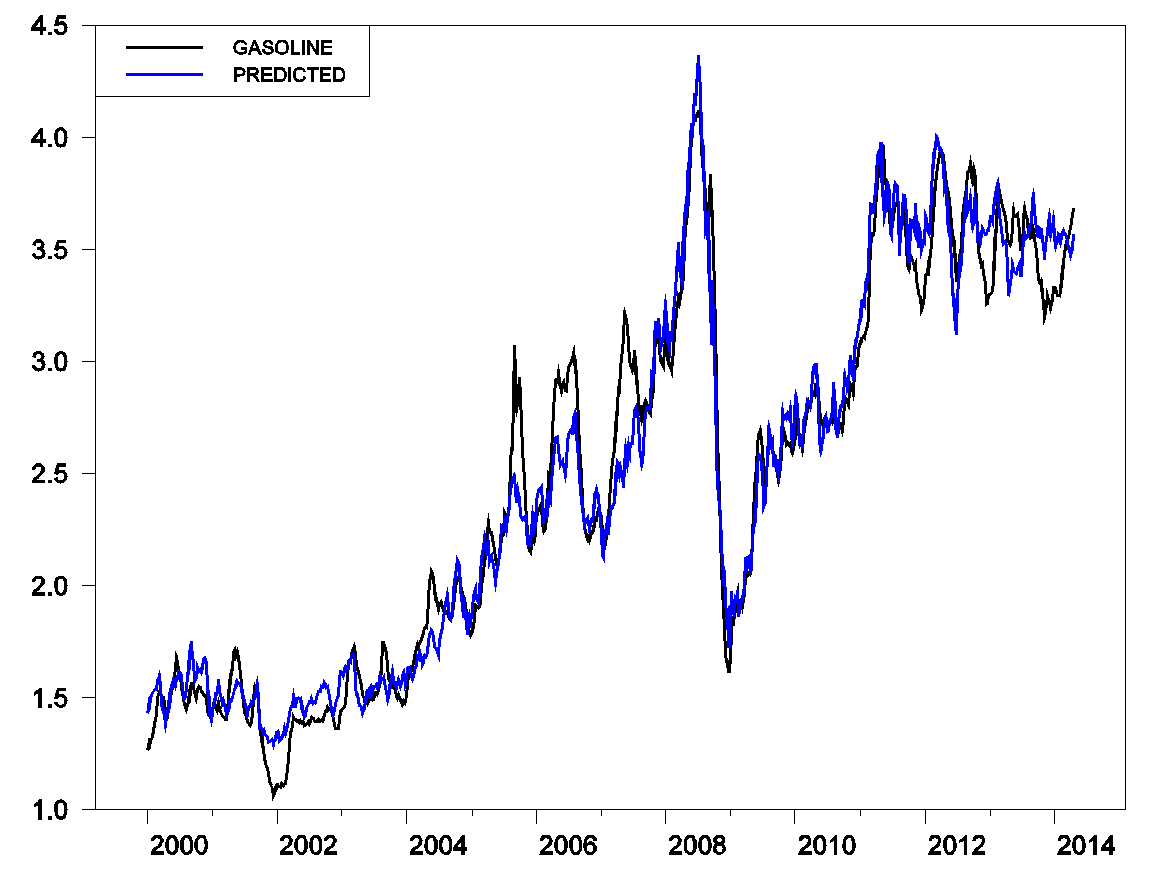
Average retail price of U.S. gasoline (black) and price predicted on the basis of price of Brent crude oil (blue). Black: average U.S. price of retail gasoline, all formulations, in dollars per gallon, weekly Jan 10, 2000 to April 21, 2014 (data source: EIA).Blue: 0.84 plus 0.025 times price of Brent, in dollars per barrel, weekly Jan 7, 2000 to April 18, 2014 (data source: EIA).
And crude oil prices have remained stable despite impressive gains in U.S. production of shale oil, referring to oil produced from tight geological formations using horizontal fracturing methods. These new drilling techniques have added 2.5 million barrels of daily U.S. oil production since 2010. Why hasn’t that new oil brought lower prices?
Here are some updated data on the answer I gave to that question last September. What the EIA reports as total oil supply grew by 5.7 mb/d between 2005 and 2013.
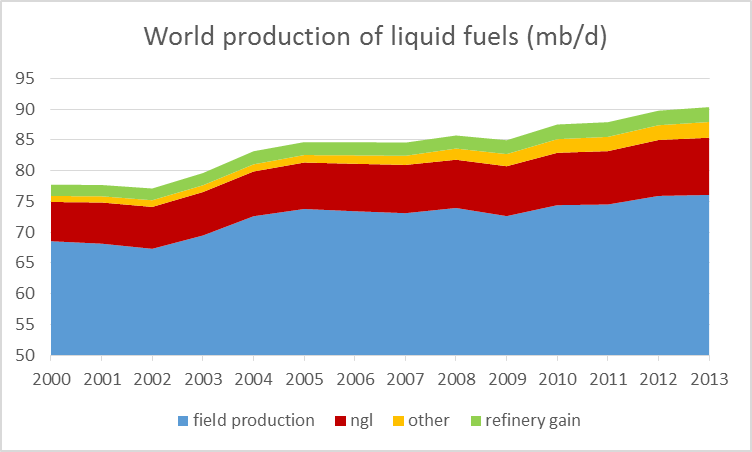
Annual world production of liquid fuels (in millions of barrels per day), 2000-2013. Blue: production of crude oil including lease condensate; brick: natural gas plant liquids; green: refinery processing gain; orange: other liquids (chiefly biofuels). Data source: EIA.
But about half of this increase came in the form of natural gas liquids like ethane and propane, whose uses don’t include making gasoline, along with biofuels, at best a marginal addition to net energy supply. The total increase in actual field production of crude oil globally since 2005 has only been 2.3 mb/d.
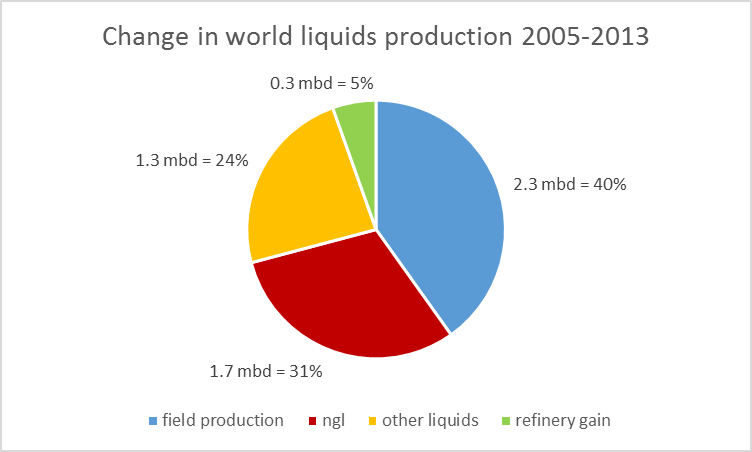
Change in annual world production of liquid fuels (in millions of barrels per day) between 2005 and 2013. Blue: production of crude oil including lease condensate; brick: natural gas plant liquids; green: refinery processing gain; orange: other liquids (chiefly biofuels). Data source: EIA.
U.S. production of oil from tight formations is up 3.5 mb/d since 2005, and yet total global field production of crude from all sources is only up 2.3 mb/d. In other words, more than all of the increase worldwide over the last 8 years is attributable to U.S. tight oil production. Without U.S. tight oil, world oil production would be lower today than it was 8 years ago.
2.3 mb/d represents 3% of 2005 world field production. For comparison, world GDP grew by 28% since 2005. If oil prices had remained stable, with that much more income we would have expected much more than a 3% increase in quantity of oil demanded globally. The price of oil had to rise sufficiently– namely, to above $100/barrel– to restrain global oil demand to grow at a very slow rate over the last 8 years.
The EIA has recently updated its assessment of how much more U.S. tight oil production might increase. They acknowledge considerable uncertainty about factors such as how much ultimately can be recovered from each well and whether productivity will be maintained as drillers move to new areas or place wells closer together. Their reference scenario anticipates the U.S. will add another 2 mb/d over the next 3 years after which production will plateau and then gradually decline, though the EIA also sees possibilities of paths significantly more optimistic and pessimistic than this.
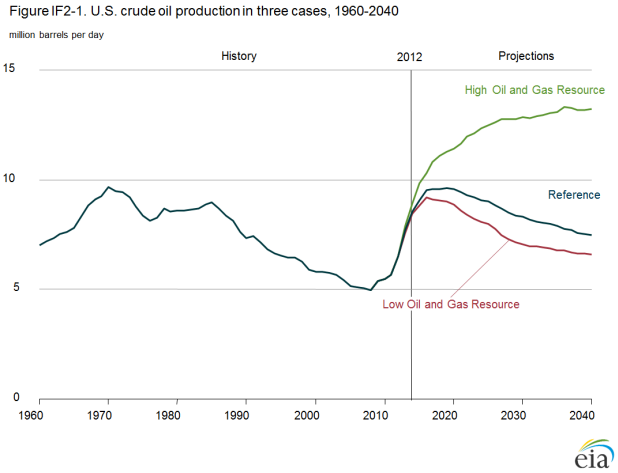
Source: EIA.
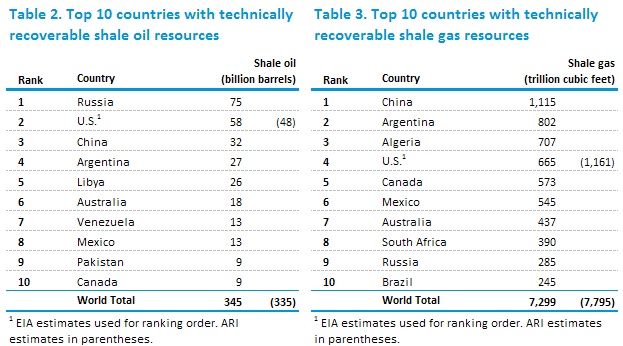
If the U.S. continues to be the only source of global growth in oil production, and if the world economy continues to expand at the pace it has over the last decade, oil prices are headed further higher. But how much promise does fracking hold outside the U.S.? The EIA believes Russia may have even more potential than the U.S., and Russia produced 120,000 b/d using horizontal fracturing methods in 2013. China may have about half the potential as the U.S. in shale oil and even more with shale gas, and is working hard to make that promise a reality. Argentina also has potential, but good luck with any capital you invest in that country. And turmoil in Libya is preventing shipment of even the easy-to-obtain conventional crude, let alone trying to go after the potential shale deposits.
Source: EIA.
Quantities aside, producing oil from tight formations remains an expensive proposition. Most of the companies in this business have negative cash flows, sinking more money into the operations than they are getting out. And it’s not the case that the companies are acquiring an asset that will continue to pay off for years to come– decline rates from individual wells remain quite impressive.
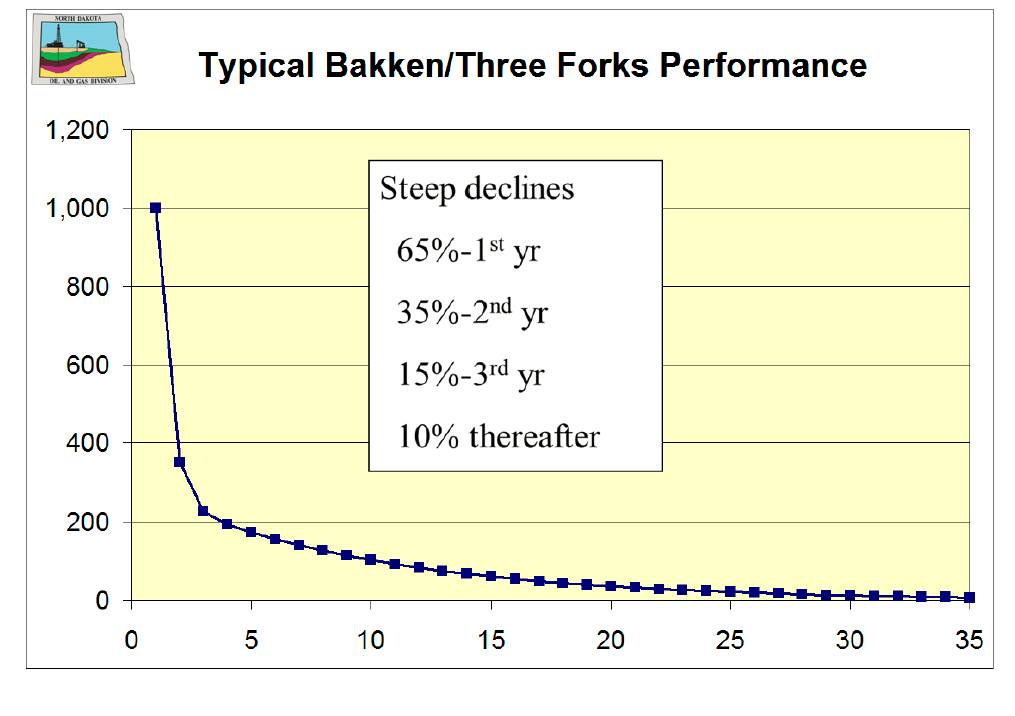
Production flows from typical North Dakota well. Horizontal axis: years after production peak. Source: North Dakota Department of Mineral Resources.
Peak Oil Barrel had an interesting graphic illustrating what those decline rates would mean for the path of North Dakota production if new wells stop being drilled.
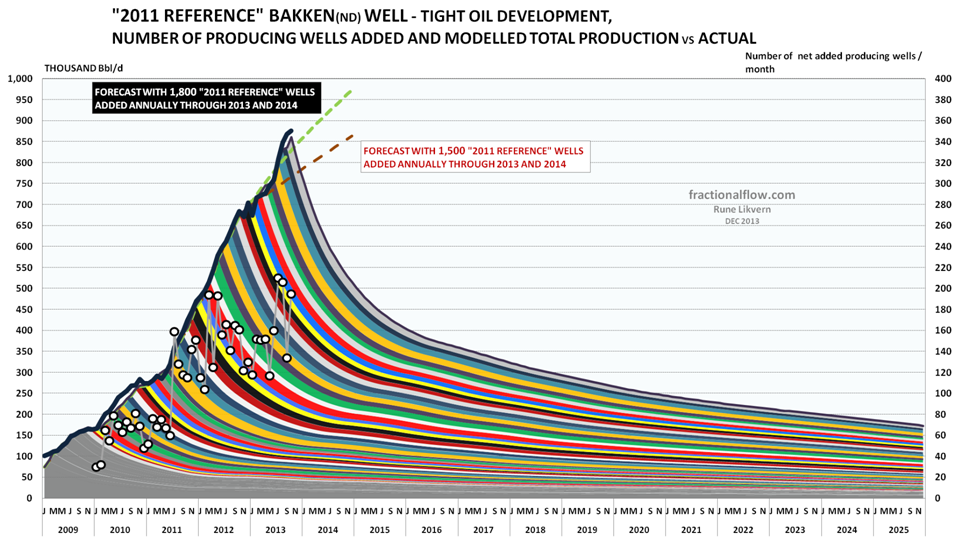
Source: Peak Oil Barrel.
For the next several years, the world should be able to continue to increase field production of crude oil, as long as the price stays at current levels. The real message from the new technology is this: oil prices have been remarkably steady over the last several years because of– not in spite of– the important added contribution of tight oil.
It’s the same “big picture” that has been drawn for four or five decades. What’s the matter with this picture? Hint: a word often associated with computers.
What is the per capita production of “oil” and the net exergetic availability per capita and to wages and real GDP and final sales? If you do the work, you will find that the total exergetics of liquid fossil fuels per capita and to real final sales per capita is 12-13% lower than the onset of Peak Oil in 2005.
The inference is that for US “oil” production to continue at the 5-year rate, the real 2007US$ price of oil will have to increase to $250 by 2020 and $525 by 2025, resulting in the price of gasoline of $7-$12.
But US real final sales per capita cannot grow with the 5- and 10-year average price of “oil” above $40-$50/bbl, as evidenced by the ~0% average growth of real final sales per capita since 2007-08.
The doubling time of production of “oil” to US reserves and consumption since 2008 implies that the $250-$525 cost of “oil” to permit the growth of production of “oil” by 2020-25 will crash the economy and resulting “oil” production over the Seneca Cliff long before this price is reached and the implied production of “oil”.
At the rate of “oil” production since 2008, and given proven reserves and consumption, the US will reach the irretrievable rate of depletion of “oil” reserves that we can afford to extract and consume by no later than 2017-20.
We are speeding at $100/bbl and near $4/gal off the Seneca Cliff, all the while telling ourselves that we are becoming “energy independent” because we are at the per capita level of “oil” production 50% below the 1970 level and all the way back to the levels of the late 1930s to before WW II per capita.
This means a last-man-standing war for the remaining resources of the planet at Peak Oil, declining net fossil fuel exergetics per capita, and population overshoot on a finite spherical planet, only Wall St., the oil company execs, White House, and mass-media influentials won’t tell us.
In the meantime, the Red Queen commands, “Drill, frack, irradiate, and draw down and pollute the aquifers as quickly as possible, baby! Off the Seneca Cliff we go and faster!”
But about half of this increase came in the form of natural gas liquids like ethane and propane, whose uses don’t include making gasoline, along with biofuels, at best a marginal addition to net energy supply.
This is true, but misleading. Biofuels require inputs of natural gas (or coal!) but that’s not important – we’re talking about the market for liquid fuels. Ethane is somewhat fungible with oil for petrochemical production, and refineries can adjust their mix production of outputs like gasoline.
if the world economy continues to expand at the pace it has over the last decade, oil prices are headed further higher.
I agree with Steven Kopits that consumers really aren’t willing to pay a lot more for oil. Higher prices will mostly serve to greatly accelerate moves to greater efficiency and substitution with electric vehicles (hybrids, plug-ins, EREVs and pure EVs).
Note that what the EIA calls crude oil is actually crude oil (generally defined as 45 or lower API gravity oil) + condensate (a byproduct of natural gas production), AKA as C+C.
When one asks one the price of oil is, one gets the price of 45 or lower API gravity crude oil. When one asks for the volume of global oil production, one gets some combination of Crude Oil + Condensate + Natural Gas Liquids (NGL) + Biofuels + Refinery Gains. It’s analogous to asking a butcher the price of beef, and he give you the price of steak, but if you ask him how many pounds of beef he has on hand, he gives you the total pounds of steak + roast + beef.
Shouldn’t the price be keyed to the actual volume of the product being priced?
Global Crude + Condensate (C+C) production increased at about the same rate as global dry processed gas production from 2002 to 2005, but then we saw a significant divergence between the rates of increase in global gas production and in global C+C production from 2005 to 2012, 2.8%/year versus 0.4%/year respectively. Crude oil is generally defined as 45 or lower API gravity oil.
According to the EIA, global gas production increased by 22% from 2005 to 2012, and I think it’s a reasonable assumption that condensate–a byproduct of natural gas production–increased by about the same amount, especially given the large increase in condensate production in the US.
The problem is that other than OPEC and Texas, no one appears to track crude versus condensate, but the Texas RRC shows that the Texas condensate to C+C ratio increased from 11% in 2005 to 15% in 2012. Note that OPEC, which accounted for 43% of global C+C production in 2012 showed no material increase in crude oil production from 2005 to 2012 (31 mbpd in both years).
If we cross correlate the OPEC (Crude only) and EIA (C+C) data bases for the OPEC 12 countries for 2005 to 2012, their Condensate/(C+C) Ratio doubled–from 3% in 2005 to 6% in 2012. OPEC accounted for 43% of global C+C production in 2012, which is a pretty good (and conservative) sampling of global crude and condensate production, especially when one considers the fact that the large increase in US condensate production would be in the remaining 57% of global C+C production.
In any case, the data bases that we have that track condensate versus crude, Texas RRC and OPEC/EIA, both show large increases in their Condensate/C+C Ratios from 2005 to 2012, 11% to 15% and 3% to 6% respectively.
If we extrapolated the OPEC crude versus C+C data, and assumed that OPEC was a representative sampling of global data, it would imply that global condensate production increased by about 2.1 mbpd from 2005 to 2012, which would account for all of the EIA’s reported 2 mbpd increase in global C+C production from 2005 to 2012.
My approach has been to assume that the global Condensate/(C+C) Ratio was about 10% in 2005 (partly based on an RBN Energy estimate that put the ratio at about 11% in 2010), and I assumed that global condensate production (a byproduct of natural gas production) increased at about the same rate as the rate of increase in global gas production, from 2005 to 2012. Based on these assumptions, global condensate production would have increased from about 7.4 mbpd in 2005 to about 9.0 mbpd in 2012, an increase of 1.6 mbpd, accounting for virtually all of the EIA’s reported increase in global C+C production from 2005 to 2012.
Based on the foregoing, the global Condensate/(C+C) Ratio would have increased from about 10% in 2005 to 12% in 2012, versus 11% to 15% for Texas and versus 3% to 6% for OPEC. I estimate that actual global crude oil production averaged about 65 mbpd for 2006 to 2013 inclusive, versus 67 mbpd in 2005. In other words, in my opinion global crude oil production probably peaked in 2005, but natural gas and associated liquids (Condensate & NGL) have (so far) continued to increase.
Following are estimated* values for global crude oil production (excluding lease condensate), 2002 to 2012, mbpd:
2002: 60
2003: 62
2004: 65
2005: 67
2006: 65
2007: 65
2008: 66
2009: 64
2010: 66
2011: 65
2012: 67
*Assumptions: Global Condensate to Crude + Condensate Ratio was about 10% for 2002 to 2005 (versus 11% for Texas in 2005), and condensate production increased at the same rate as the rate of increase in global dry processed gas production from 2005 t0 2012 (2.8%/year, EIA). Crude oil is defined as oil with an API gravity of 45 or less (per RBN Energy). Data rounded off to two significant figures.
Kurt Cobb has written a good article on crude oil versus other liquids:
http://www.resilience.org/stories/2014-04-13/did-crude-oil-production-actually-peak-in-2005
http://www.ogj.com/articles/2014/03/financial-questions-seen-for-us-shale-gas-tight-oil-plays.html
But then the industry is less than a decade old…Most business do not earn any profits for the
first or second year; not to mention capital intense industries..
Presently, the Bakken URRs are increasing and not declining, as drilling and fracking
efficiencies continue to improve…This also includes well production decline…Furthermore,
cost are slowly being reduced from the frightful $12m per well to below $9m.
In the end, what will matter are URR and the price for what it sold…I as an investor,
have confidence in most oilmen, rather than sideline speculators…
Two Graphs:
First graph is normalized global gas production, global NGL production and global C+C production from 2002 to 2012 (2005 value = 100%).
http://i1095.photobucket.com/albums/i475/westexas/Slide1_zps45f11d98.jpg
Second graph shows normalized estimated values for condensate and crude separately from 2002 to 2012 (2005 value =100%).
http://i1095.photobucket.com/albums/i475/westexas/Slide2_zpse294f080.jpg
An RBN Energy article on condensate:
Neither Fish nor Fowl – Condensates Muscle in on NGL and Crude Markets (February, 2012)
https://rbnenergy.com/Neither-Fish-nor-Fowl-Condensates-Muscle-in-on-NGL-and-Crude
http://insideevs.com/march-2014-plug-electric-vehicle-sales-report-card/
http://electricdrive.org/index.php?ht=d/sp/i/20952/pid/20952
Nick G, do you realize what pct of total US vehicle sales EVs+ (broadly defined) represent?
At the trend rate of growth of total auto sales to all EVs+, it will take 22 years for EVs to reach 25% of auto sales and 30 years to reach 50%.
That US real final sales per capita cannot grow with the 5- and 10-year average price of oil above $40-$50/bbl, I suspect that the rate of growth of EVs+ is already peaking, and the lack of growth of real final sales per capita means little or no acceleration of growth of EVs+ in the long run.
Hybrid sales are fairly stable, while EV sales have doubled in each of the last two years. None of these extrapolations are very meaningful, but if you want to think that way, then extrapolate the EV #s.
I don’t think anyone expects overall car sales to grow much – Americans have as many or more cars than they need or want. But market share of hybrids and EVs is pretty likely to have healthy growth, given that US Corporate Average Fuel Economy (CAFE) requirements are going to roughly double.
We’d see dramatic growth for HEV/EVs if oil was properly priced (that is, if it included the cost of pollution, security, etc), but instead we have to rely on regulations like CAFE, instead.
“The international price of crude oil ultimately determines the price Americans pay for gasoline at the pump…”
Your own graph contradicts your argument (g3); take the state-of-the-art WTO claims into account, and your world view is much too simple.
The price of oil, natural gas, and gasoline will be determined by diktat, as risk-on investing has turned to risk-off investing.
Global fiat asset prices are falling as the fiat money bubble has finally burst, Equity Investments, that is Nation Investment, EFA, and Small Cap Nation Investment, IFSM, and Global Financial Institutions, IXG, as wll as Credit Investments, that is Aggregate Credit, AGG, are trading lower from their April 9, 2014, highs, this coming on the failure of credit in China, in Russia, and in the US.
The failure of credit coming at the end of the week of April 25, 2014, constitutes the most significant economic event since President Nixon took the US off the gold standard in 1971, it pivots the world out of the age of credit and into the age of debt servitude, and is evidenced by the parabolic turn lower in Chinese Financials, CHIX, China Investments, YAO, as well as Regional Banks, KRE, the US small Caps, IWC, IWM, as well as Credit Providers Visa, V, and Mastercard, MC, the nation of Russia, RSX, ERUS, and Leveraged Buyouts, PSP, and manifests as the death of Major World Currencies, DBV, such as the Australian Dollar, FXA, and Emerging Market Currencies, CEW, such as the Chinese Yuan, CYB.
A new currency and governmental regime is being born out of the failure of credit and the death of currencies; it is the regime of regional diktat money and regional economic governance, something that is implicit in Daniel’s Statue of Empires, seen in bible prophecy of Daniel 2:25-45, where the two iron legs of global hegemonic power, these being the UK and the US, flow into the ten toes of iron diktat and clay totalitarian collectivism; these toes are the same reality seen in the governance of the ten horns, that is the ten world regions, and the totalitarian collectivism experience of mankind’s seven institutions, foretold in the Beast prophecy of Revelation 13:1-4.
The world economy will not be expanding; but prices may be headed higher on 1) global instability, 2) supply disruption, 3) lack of refinery capability, 4) diktat from regional leaders issuing mandates to refineries in the US, that is Valero, VLO, Marathon, MPC, Phillips 66, PSX, and Hollyfrontier, HFC; which may be restrained by diktat from exporting to certain countries and/or be told to whom and what price they will sell.
The price of energy, that is Crude Oil, USO, and its refined product, that is Gasoline, UGA, and its distributed product, that is Natural Gas, UNG, will be determined by diktat in the age of regional governance and totalitarian collectivism.
Regional leaders throughout the world, such as those in the US, in the Eurozone, will determine the economic value of things, and thus determine the distribution, and price of oil, gasoline and natural gas. There will be certainly be no free prices as desired by Austrian economists, and there will be no market determined prices as there has been by economic systems of Crony Capitalism, European Socialism, Russian Communism, and Chinese Communism. All of these isms are gone forever, and now there is the singular economic system, that is the singular ism of Regionalism.
“For the next several years, the world should be able to continue to increase field production of crude oil, as long as the price stays at current levels. The real message from the new technology is this: oil prices have been remarkably steady over the last several years because of– not in spite of– the important added contribution of tight oil.”
I might qualify this as, “For the next two years, the world should be able to increase field production…” The IOCs, I think, are headed for a hard landing, and I could more easily make the case for an oil shock in 2016/2017 than for an excess of oil. I’ll have a blog post on this around the weekend, responding to Phil Verleger’s response to my earlier post. (I hope that’s clear.) http://www.prienga.com/blog/
If you use supply-constrained forecasting, it is not given that shale oil has contributed to price stability. Instead, I might write, “GDP growth has been looking a bit better because of the important added contribution of tight oil.” Here’s a bit more on that: http://www.drillingcontractor.org/analyst-shale-oil-wont-threaten-deepwater-but-rising-costs-oil-prices-might-27629
And finally, instead of “the reality is the price of crude oil has been remarkably stable over the last three years,”, I might write “predictably stable”. A supply-constrained model (and is Jim not intimating that we are supply-constrained?) would anticipate that price volatility, in the absence of supply shocks, would collapse. And it has.
James:
1. The comments about cash flow are silly. Study the payback time for the wells. That’s garden variety upfront investment in something that pays back later. More time with the basic micro-econ and finance and less macro would serve you better. There is a reason why investment is flowing into that area and it’s nowhere as strange and unknown as Internet stocks or the like–hence why a substantial amount of conventional debt is being issued. The primary risk is really commodity price crash (but if that happens, it implies we have a favorable for consumers supply-demand balance anyhow). Infill drilling is not mysterious, nor are the 10+ year shapes of the decline curves critical to the investments (do the NPV, you will see). And we have enough data to show how the wells decline previous to that.
2. I agree with your point about gasoline prices, but you confuse things more by posting the first chart at a different scale to the second. Just show the ratio of gasoline to crude over time–that would be a good chart to learn from. 😉
I’m linking here to a summary of the BGR’s latest estimates of global fossil fuel resources and reserves. http://j.mp/FF_RR_2013
If we assume that the bakken decline rates shown above are the rate at the beginning of each year (in other words, the well’s peak production is on the first day), then we get a profile like this:
Bakken production model
Decline Production Average
0 1,000.00
1 65% 350.00 675.00
2 35% 227.50 288.75
3 15% 193.38 210.44
4 10% 174.04 183.71
5 10% 156.63 165.34
6 10% 140.97 148.80
7 10% 126.87 133.92
8 10% 114.19 120.53
9 10% 102.77 108.48
10 10% 92.49 97.63
11 10% 83.24 87.87
12 10% 74.92 79.08
13 10% 67.43 71.17
14 10% 60.68 64.05
15 10% 54.61 57.65
16 10% 49.15 51.88
17 10% 44.24 46.70
18 10% 39.81 42.03
19 10% 35.83 37.82
20 10% 32.25 34.04
21 10% 29.02 30.64
22 10% 26.12 27.57
23 10% 23.51 24.82
24 10% 21.16 22.33
25 10% 19.04 20.10
26 10% 17.14 18.09
27 10% 15.42 16.28
28 10% 13.88 14.65
29 10% 12.49 13.19
30 10% 11.24 11.87
31 10% 10.12 10.68
32 10% 9.11 9.61
33 10% 8.20 8.65
34 10% 7.38 7.79
Total 2,941.2
That means lifetime production is about 3 years of the original flow rate, and about 4.4 years of the first year’s total production. That seems to support the idea that negative cash flow (at least in the first year of production of each well) might be a viable business plan.
It actually might be even better than that. Shale gas wells show a “turn” after 5-8 years. They don’t maintain 10% drops throughout. But we really don’t know what will happen with Bakken oil wells. Just…there is uncertainty. USGS has some mathematics for their guesses on average decline curves, so might be better to look at that, then Rune’s guess.
Also, Rune messed up his Bakken predictions before (he predicted max of 650K +/- 50k and has not been forthright about admitting it. (And he ran hard with all the press attention when he had predicted the 600k-700k.) There is some wishcasting, rather than straight Bayesian best bet guesses. So…just take projections from the peak-o-sphere with a grain of salt.
Here’s Rune’s forecast:
“Now and based upon present observed trends for principally well productivity and crude oil futures (WTI), it is challenging to find support for the idea that total production of shale oil from the Bakken formation will move much above present levels of 0.6 – 0.7 Mb/d on an annual basis.
Authoritative research companies (like Bernstein Research) and widely acknowledged specialists/institutions like USGS and SPE have recently and in general arrived at identical conclusions by applying different sets of methodologies and from studying other areas.”
http://www.theoildrum.com/node/9748
I think the Peak Oil community has done a service by clarifying that we’re now in a Peak-Oil “Lite” situation (where supply growth is limited), but they should be very humble about their ability to forecast in any kind of detail.
Worse, I think that Peak Oil enthusiasts do significant harm with their apparent support for “drill, baby, drill”. The idea that Peak Oil will cause The End Of The World As We Know It is fodder for the oil industry’s relentless push for special treatment.
The worst thing is the idea that there are no substitutes for oil: we can and should kick the oil habit, as quickly as possible. It will make us more prosperous and more secure.