After the shocker of -2.9% growth (SAAR) in 2014Q1, all eyes have been on Q2. Macroeconomic Advisers released its estimate for May — a 0.2% increase on April (2% on an annualized basis).
Figure 1 presents the Macroeconomic Advisers and e-forecasting estimates, as well as the BEA official figures (3rd release).
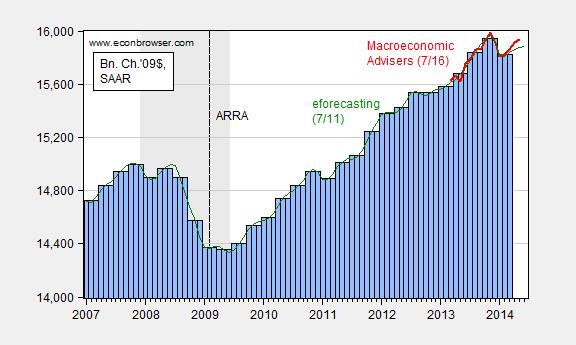
Figure 1: GDP from NIPA 3rd release for 2014Q1 (blue bars), Macroeconomic Advisers (red line), and e-forecasting (green line), all SAAR, in billions of Ch.2009$. NBER defined recession dates shaded gray. Source: BEA, Macroeconomic Advisers (7/16), e-forecasting flash estimate (7/11), and NBER.
Macroeconomic Advisers’ nowcast for the quarter is 2.9% (SAAR). The Atlanta Fed’s nowcast as of information available on 7/15 is 2.7%.
Side note – Philadelphia Fed now implements the Aruoba, Diebold, Nalewaik, Schorfheide, and Song GDPplus measure, which indicates a smaller than 3% decline for 2014Q1 (see Diebold’s discussion here).
The acceleration in the price of oil YTD has resulted in CPI accelerating from 1.5% at the end of 2013 to 2.6% YTD and 3.8% q-q annualized, implying real after-tax wages at or near 0% q-q annualized for Q2, decelerating dramatically from 3.8% in Q1.
The level of oil consumption to final sales at the historical recessionary threshold and the price of oil accelerating suggests that the Q1 contraction was not strictly weather related, notwithstanding the revision for health care spending.
With the post-2007 nominal GDP trend of 2.5%, real GDP at 1%, and real final sales per capita at 0%, the US economy cannot withstand an acceleration of prices beyond 1.5-2% without the increasing probability of 0% or contraction q-q annualized for after-tax wages and incomes, and thus for spending. At the post-2007 trend rate of real final sales per capita at 0%, the US (and EZ and Japan) economy is vulnerable to any number of “exogenous shocks” (chuckle) that will result in stall speed or q-q contraction for the economy, including energy, fiscal, geopolitical, and weather.
I have Q2 q-q annualized real GDP at ~2.2%, FWIW, depending upon the deflator the BEA decides to use in an election year. Irrespective of whether it’s 2.2%, 2.7%, or 2.9%, that’s no growth YTD, just 1.5% yoy, 0.8% per capita yoy, and no growth for real final sales per capita for three quarters running.
https://app.box.com/s/7ajnjylgw54zxjjnz2ea
https://app.box.com/s/efge728snlhly572u0pc
http://www.philadelphiafed.org/research-and-data/real-time-center/gdpplus/GDPplus_plot.pdf
Guess when the last two times that happened . . . ? Does anyone actually believe that The Chair is going to end QEternity in Oct under the circumstances . . . ? If so, The Dragon will have to take over as the proxy reserve printer for The Chair.
The acceleration in the price of oil YTD
The Brent benchmark is at about $108 at the moment, about where it was at the end of 2013. http://www.nasdaq.com/markets/crude-oil-brent.aspx?timeframe=1y
CPI accelerating from 1.5% at the end of 2013 to 2.6% YTD and 3.8% q-q annualized
It was 1.5% at the end of 2013, year over year. It was 2.1% in May (the latest data), year over year. The major contributor to the increase in April and May was food prices. http://www.bls.gov/cpi/cpid1405.pdf
I don’t see much evidence here for an oil shock.
If you do supply-constrained forecasting, the damage comes through volumes, not prices. Hence my book, Nick.
the damage comes through volumes, not prices
But what causes the changes in volume of consumption, if not prices?
The mechanics are that, if the oil supply is not sufficient for all, then oil consumption will be reallocated between the slow growing (OECD) and fast growing (non-OECD) countries. Essentially, the price rises to the global carrying capacity price, and the OECD slowly (or in a recession, dramatically) reduces oil consumption. Importantly, however, at the carrying capacity price, price does not increase with marginal cost. It increases with purchasing power. So you don’t see a big upward movement in price; rather, you’ll see a decline in consumption at a high, but relatively stable, price.
For the US, this is complicated by increasing shale oil production. Oil producers get to consume more oil. The brunt of adjustment (both in oil consumption and GDP) since 2011 has therefore been borne by the Europeans and the Japanese. You can see this very clearly in the GDP and oil statistics.
And to BC’s comment, if oil prices are stagnant, even at a high level, and exploration and production costs continue to rise, then the oil companies will be forced off their projects, and capex will fall. And that’s exactly what we’re seeing. It will peak out the conventional supply (which peaked in 2005 anyway).
It will not necessarily peak out the shale oil supply, which is subject to somewhat different dynamics. So we’ll see something of a recession in the heavy capex projects (already apparent in day rates for deepwater drilling units), even as onshore US continues to surge ahead.
But yes, if shales falter, you could peak out the oil supply, and right now, that looks on track for 2016/2017, depending on shale drilling results in the Permian (assuming the Argentines fail to get their act together–which seems likely to me).
the mechanics are that…
I think that confuses cause and effect.
First, price is the signalling system, right? People don’t reduce their consumption at low prices, they reduce it when price rises. So, clearly prices drive things. To suggest they don’t is to confuse people.
oil consumption will be reallocated between the slow growing (OECD) and fast growing (non-OECD) countries.
First, consumption will be reallocated to countries who interfere with price mechanisms, like oil exporters and countries like India and Egypt. That is enormously harmful to those countries, and eventually they’ll be forced, by out of control subsidy costs and obviously wasteful consumption, to eliminate the price controls and subsidies. Fortunately, such countries are now, at last, starting to free up prices. India has decontrolled gasoline, and diesel seems to be heading that way. Egypt is raising the price of petrol, though they’re doing it extraordinarily clumsily – they seem to be going out of their way to provoke the Egyptian public.
Second, consumption will be reallocated to countries who use it in more useful ways. The US is extraordinarily inefficient and wasteful: we could reduce passenger fuel consumption by 50% and barely even notice it.
the price rises to the global carrying capacity price
The price rises to the point where substitutes are clearly better. Trucks start to install aerodynamic bonnets. Countries implement regulations, like CAFE. Water shippers start to optimize fuel consumption. Freight customers start to shift to rail, which is 3x as efficient. Fedex starts to optimize routing, and buy electric and NG trucks.
Fedex optimizes routing and buys alt-fuel vehicles not because they can’t afford fuel: fuel is only 5% of their costs. It’s because they’re cost conscious, and they don’t want to leave “money on the table”.
price does not increase with marginal cost. It increases with purchasing power
Prices stop increasing because consumers don’t feel oil is worth that much. European drivers use 18% as much fuel as US drivers because they pay realistic prices. German drivers can afford to pay for fuel, they just don’t feel it’s worth it.
It would be nice if consumers were even more sensible about fuel consumption – oil would go away much faster. Hybrids, EREVs and EVs are already the low cost choice for Total Cost of Ownership (per Edmunds.com), so if cost were the driver….we would have reached the tipping point. Buyers of new light duty vehicles (cars, pickups, SUVs) sales just don’t seem to be very price sensitive. The minimum cost US vehicle is about $11k, while the average vehicle is more than $30k. The average new car gets about 25MPG, while 55-100MPG vehicles are available. New car buyers just aren’t paying all that much attention to minimizing costs.
Oil producers get to consume more oil. … You can see this very clearly in the GDP and oil statistics.
That gives oil supernatural power it does not have. The difference is that the US has followed better macroeconomic policies.
But, Steven, given the once-in-history structural constraints associated with Peak Oil, does not the persistently high price of oil result in increasing costs and diminishing returns to investment in extraction of lower-quality, costlier crude substitutes and thus affect the amount and rate of change of growth of supply?
Is this not the de facto definition of Peak Oil?
I have demonstrated that the 5- to 10-year rate of US real final sales per capita cannot grow with the 5- to 10-year average constant US$ price of oil above $40-$50/bbl, whereas costlier, lower-quality deep, tight, and tar “oil” requires $80-$100 (???) to profitably extract the “oil”. That is to say, we cannot have our costlier, lower-quality crude oil substitutes AND grow real final sales per capita.
http://peakoilbarrel.com/wp-content/uploads/2014/07/ccpercap1.png
The rising price of oil is not resulting in overall global growth of supply PER CAPITA, despite the boom/bubble in US and Canadian crude substitutes.
And this further implies that we cannot have profitable extraction of crude substitutes AND grow real final sales per capita AND build out a “renewables” infrastructure to necessary scale AND maintain indefinitely the fossil fuel infrastructure.
We need more supply, granted, but we cannot afford to extract it, burn it, and expect the economy to grow at the high price of oil required to profitably extract it.
Again, Peak Oil AND the Limits to Growth (LTG).
Apart from drought, what is the largest contributor to food prices? Hint: We eat oil via industrialized agriculture.
http://research.stlouisfed.org/fred2/graph/fredgraph.png?g=FQk
Cushing has risen from $98 to $108 from year end 2013 to June, a 21% annualized rate, and $101 to $108 for Q2, a ~30% annualized rate. That’s a shock.
http://research.stlouisfed.org/fred2/graph/fredgraph.png?g=FQn
Food prices are shown increasing 4.3% annualized YTD through May.
Energy prices are reported as increasing 23% annualized through May. Shock.
http://research.stlouisfed.org/fred2/graph/fredgraph.png?g=FQv
As a result, CPI is accelerating at 3.8% q-q annualized in Q2, up from 1.8% in Q1, which is faster than annualized nominal GDP and enough to reduce real after-tax wages and incomes to 0% q-q annualized for Q2.
Yet another oil shock and recession, only this recession is beginning from a 5- to 6-year real final sales per capita rate of 0-1% instead of the long-term average of 2-2.5%.
what is the largest contributor to food prices? Hint: We eat oil via industrialized agriculture.
No. Fuel prices have a relatively small impact on farm costs. Less than 4% of farm expenditures are on liquid fuel. Liquid fuel accounts for roughly 60% of direct energy, and “Direct energy accounts for 5-7% of farm expenditures”. http://www.farmfoundation.org/projects/documents/miranowski.ppt
Cushing has risen
The price of the West Texas Intermediate bwenchmark (priced in Cushing, Oklahoma) has little impact on consumer prices. Refineries buy imports, and sell distillates, based on the price of Brent (as well as a few others).
Energy prices are reported as increasing 23% annualized through May
Your chart doesn’t support that. You may want to be more precise about your baseline, and use year-over-year changes – annualizing is misleading given the volatility of oil prices.
CPI is accelerating at 3.8% q-q annualized in Q2
That’s misleading – we’ve had two months of slightly higher inflation. Year-over-year inflation is at 2.1%.
Nick G., it’s marginal costs at the rate of change of prices, including petrochemicals, transport, storage, refrigeration, etc., which includes not just production but “utilization”. Please, sir.
You’re ignoring the obvious net exergetic flows per calorie and per capita, which is quite common in my long experience.
Nick G.: Moreover, perhaps you missed the critical point that, at a 6- to 7-year average rate of real final sales per capita of 0%, and 1% since 2000 and 2009-10, the US economy is vulnerable to a q-q annualized contraction from an acceleration of prices beyond 1.5%-2%, particularly from an acceleration of the price of the primary energy source for modern civilization, admit it or not: crude oil and its costlier, lower-quality substitutes.
This is the nature of a debt-deflationary regime when effective demand after taxes and debt service is limited/constrained by excessive debt to wages and GDP, peak demographic cohort’s drag effects on demand, and our unique once-in-history situation today with Peak Oil.
Like most, you can deny the evidence, which is your prerogative and a natural human ape response, but you cannot deny the ongoing, long-term effects on the secular trend rate of real final sales per capita, which is at a secular speed limit of 0-1% vs. the long-term average of 2%.
If you’re in the self-satisfied top 1-5%, you might escape the effects for some years to come, which might be informing your perspective. But rest assured that the seething masses of human ape humanity below you will not escape the effects, and the top 0.01-0.1% above you have no sympathy and feel no obligation to shelter you from the mob with pitchforks, torches, and a zombie-like appetite for the flesh and succulent brain matter of “the rich”, or those they perceive as “rich” and fair game for a sumptuous, opportunistic meal. The zombies among the bottom 90%+ have little taste for Teslas, even the new models at $35,000.
Peak Oil.
an acceleration of the price of the primary energy source for modern civilization, admit it or not: crude oil and its costlier, lower-quality substitutes.
Ah, here’s the nub of our disagreement. Oil isn’t primary – just look at the diagram below. We see that oil is only 35% of US energy, and that it’s primary only in transportation. The US could replace all of it’s personal transportation (70% of all oil consumption) by expanding electrical generation by less than 20%. Over 20 years, that’s nothing.
There are plenty of good substitutes for oil: freight can move to rail, then electric rail; personal transport can move to hybrids, then to PHEVs, then to EREVs (mass transit, carpooling and rail can help); space heating can go to heat pumps; the *small* percentage of remaining applications can go to synthetic fuel and biofuel.
Germany, for example, has relatively few people who can’t afford oil – it’s more a matter of choosing not to use it because something else is a better value. Another example: the average Prius buyer in the US is more affluent than average: they buy something more efficient because they want to, not because they have to.
Oil doesn’t become unaffordable at a certain price, it just becomes overpriced compared to the (often better) alternatives.
————————————————————————————————
You might ask: is our economic model based on cheap oil?
Not really.
First, both the US and other developed countries got that way with “moderately expensive” energy, not cheap energy. Oil and electricity have been cheap in the US in the post-WWII period, but energy was rather higher in years before that: coal and electricity cost much more, adjusted for inflation. The US, and other countries, succeeded quite well in growing strongly even when energy was much more expensive, whether it was coal or oil.
Wind power is quite affordable (if perhaps not quite as dirt cheap as US post-WWII oil and electricity prices), scalable, high-E-ROI, etc, etc. So are nuclear, and solar even if they aren’t quite as cheap at the moment (coal is also plentiful and cheap, unfortunately), so I see no reason to expect energy to ever be more than “moderately expensive”.
The fact that energy pre-WWII was a much higher portion of GDP means that it was a much heavier burden on the economy. If wind and solar are a little more expensive, that means that the wind/solar sector has to be a little larger than otherwise to power the rest of the economy. This analysis suggests that this is not a big deal: that sector would still be a much smaller portion of the economy than pre-WWII.
Second, fossil fuels aren’t nearly as cheap as they seem. Pollution is an unrecognized, external cost. So are the military costs we’re seeing currently of roughly $500B per year. Those pollution costs aren’t sustainable (especially CO2), but unfortunately the military costs probably are (in fact, many corporate interests are quite comfortable with them…). Moving away from oil and other fossil fuels will actually be much cheaper in the long-run than BAU.
Finally, let’s assume that Business As Usual involved spending about 5% of our economic activity (perhaps measured by GDP) acquiring energy. If the cost of acquiring energy doubles, then we have to dedicate another 5% to that activity. GDP might go down by 5% quickly, in case we’d have a deep recession. Or, it might happen over time – if it took 10 years, then we’d see a reduction in economic growth of .5% per year, for 10 years. After that transition was complete, economic growth would continue. So, a reduction in “net energy” has a significant impact, but it’s not TEOTWAWKI.
Does unusually strong growth since 1945 show the value of cheap energy in that period?
No, US growth was faster before 1945, using moderately expensive, non-oil energy:
1800-1900: 4.13%
1900-1945: 3.53%
1945-2000: 3.17%
“real GDP” at http://www.measuringworth.com/growth/index.php
The 19th century economy was starting from a smaller base, but it’s tough to argue that the new kid on the block, oil, “goosed” the economy.
Oil is a bit more convenient – for instance, Churchill converted the British navy from coal to oil because they could “steam” just a little faster than the competition – but civilization would have been just fine without it. Rail would have kept it’s central role for freight and passenger traffic, cars and planes would have been less numerous and shorter range, and used batteries and ethanol, etc.
oops – here’s the US Total Energy diagram.
http://www.eia.gov/totalenergy/data/annual/pecss_diagram.cfm
So, the situation is that BEA can’t hit the side of a barn with a GDP number, but the system has improved so that we now have near real time ‘now casts’? And then how should I consider the quality of these versus BEA prelim and revised? Are nowcasts just as clueless, less so, or more so? If they are less so, then BEA should stop issuing prelim numbers, and maybe should stop issuing numbers at all.
And to top it off, Philly Fed tells us maybe Q1 wasn’t so bad after all. Are we surprised? Does BEA have a shred of credibility left?
Let me tell you where I am with BEA numbers just now. First, I simply don’t believe any prelim number. It won’t be revised; it will be changed. (Revised means +/- 0.3 percentage points. Anything bigger than that is ‘changed’.) Therefore, I have no idea why the profession bothers to analyze these numbers at all. Second, I have precious little faith in the revised numbers. Do I really think Q1 was -2.9%? Could be, but I doubt it. I think it’s more likely just another BEA screw up. On the other hand, I hope it comes out in the wash over several quarters. So I am still assuming that, if any given quarter is wrong, the aggregate over 4-6 quarters will tend to smooth it out. Will that last layer of confidence also prove misplaced?
Have you asked BEA to come and explain themselves yet? I see them as an institution facing a major crisis of credibility. They better come out and tell why things are going so wrong and what they need to do to improve. Frankly, Brian Moyer’s on the bubble. Money moves on his word; and right now, it’s not good.
Steven, spot on, sir. And, remember, eCONomists are not paid to be correct, especially about recessions, so they rarely are. They are only marginally more useful than journalists but much less useful than accountants and financial analysts.
Besides, eCONomics is politics. Politics, like business, is war by other means. War is the business of empire, and war is good business (for imperialists). Therefore, the real job of eCONomists is to provide evermore dubious intellectual rationalizations for the so-called neo-liberal imperial war economy, which today is referred to as “globalization”, i.e., the Anglo-American imperial trade regime.
The key takeaway from my post above is that the post-2000 and -2007 trend rates of real final sales per capita of 1% and 0% respectively result in the secular speed limit that puts the US, EZ, and Japanese economies (65-70% of world GDP) in a perpetually vulnerable state subject to energy, fiscal, geopolitical, and weather shocks, resulting in consecutive or periodic q-q annualized contractions.
The acceleration of the price of oil YTD, yoy, and q-q annualized back to $100-$110 with oil consumption to final sales of 4% has historically been a recessionary trigger, and the effect on the acceleration of CPI YTD and q-q annualized is reducing q-q annualized real after-tax wages and incomes to 0% for Q2.
I personally suspect that the US economy reached stall speed in Q3-Q4 and is in recession with the EZ as occurred in Q1 2001 and Q1 2008, whether or not the BEA’s data ever affirm recession.
A reminder that the yield curve does not invert ahead of recessions and bear markets during debt-deflationary regimes, as in the 1830s-40s, 1880s-90s, 1930s-40s, and Japan since the 1990s. Japan has had several recessions without a yield curve inversion since the last one in 1992. The US experienced 4-5 recessions from 1931 to the early to mid-1950s without a yield curve inversion. Therefore, eCONomists’ models that include as a primary variable the spread between the 10-year yield and T-bill yield (virtually all of them) will miss a recession during the ongoing debt-deflationary regime, which will likely last into the end of the decade to early 2020s.
Other unambiguous markers of a possible recession having begun are yoy contraction of state income tax receipts and corporate profits after tax, which occurred in Q1.
BTW, the 4-qtr. averaging is what the NBER does as part of their business cycle dating.
BC –
With respect to historical (ie, the past quarter’s) GDP, the principal role of the BEA is
1) the determination of required data (this should exist, and not be completed quarterly, obviously)
2) establishing the sources of that data
3) establishing reporting requirements, methods and channels
4) gathering the data
5) processing the data to provide a GDP estimate
This is a mechanical process (although no doubt mixed with some art). It is making sausage, not predicting how many will be eaten. I have no patience with the matter for just this reason. It’s all about process, and that process should be geared to providing a number within +/- 0.3 percentage points within 45-60 days.
Now, why is the BEA unable to do that?
Politics and an election year.
Let me disagree with this, BC. It’s not about politics. I emphatically believe that this is a managerial and technical problem. I am hard pressed to see how institutional haplessness at the BEA reflects well on the Administration.
At the BEA, it should all be about process. The numbers as they flow up to the BEA should all be subject to audit–BEA should have very little opinion to add, except for those items where they may have to make estimates.
I would like to know what is going on, and why these numbers are so weak, quarter after quarter. I am not asking about ideology and political affiliation. I am asking a technical and managerial question.
Why are prelim numbers so weak? What has to be done to bring them to meet the +/- 0.3 pp standard?
That’s what I want to know.
Steven Kopits: The 2014Q1 revisions were large relative to the usual ones. That doesn’t mean that there is no information in the advance estimates; see this post (you might recall this post, as you commented — although not directly on the subject of the post, so you might not remember).
So, you are proposing to ignore potentially useful information. I would say a more profitable approach is to take the point estimate (at least for the US), and allow for the margin of error. Those who are acquainted with statistical analysis would have little problem with that.
It is not good enough, Menzie. We are not some banana republic. These are the official, top line numbers of the government of the United States. If you’re telling me that the best BEA can do is x +/- 2 percentage points, that’s absolutely terrible. If Exxon came out and said, well, that’s our profit plus or minus 50%, the CFO would be gone in a week. Two days, tops.
And here we have big, big misses, 50% or more, quarter after quarter. How many times have I complained?
And moreover, you’re the one sawing off the limb beneath the BEA. Oh, Philly Fed says Q1 not so bad. So you don’t believe BEA, either. And why did Philly second guess BEA? Maybe they don’t believe them, either.
The standard should be x +/- 0.3 pp. If you can’t deliver it, don’t publish it. That simple. Credibility matters. Right now, Moyer (who looks like a nice enough guy) has none.
Now, did you ask Moyer to come and plead his case?
I can tell from the graphic that both Macroadvisers and e-forecasting have Q2 GDP below the Q4 peak, and we have Macroadvisers 2.9% growth estimate, but I don’t see a SAAR growth rate for e-forecast. The SAAR growth rate is the standard format for reporting GDP. Would make things clearer if we had a simple growth rate for e-forecast.
BananaGuard: e-forecasting indicates GDP in the 3 month period ending June was 1.2% above the level in the preceding 3 month period, SAAR.
http://www.bea.gov/newsreleases/national/gdp/gdpnewsrelease.htm
1.7% of the 4% Q2 annualized estimate was from inventories.
Real final sales were at 2.3% (1.6% per capita) SAAR, 0.6% YTD for real GDP, and ~0% per capita YTD.
The 2-qtr. deceleration for real final sales per capita from 2.7% to 0.7% to 0% is historically recessionary (or recession like).
And not only are the estimates wrong but the indicator they use to tell us about growth is seriously flawed. GIGO anyone?
My guess nominal began GDP accelerating in 2013 and the BEA missed it. That creates all kinds of errors in GDP and the deflator. They are out of touch with the BLS and the Commerce department in terms of data. They are out of touch with the Fed frankly, on the regional level(the FRB is out of touch as well, missing strong credit expansion in capital markets) and private sector survey’s. There may have to be a “intervention” with this at some point by Congress and the Admin. There may be foul play involved or just a hedonic mess.
You can’t call for 0 growth when jobless claims are at a 7 year low.
Rage, jobless claims are at the historical cyclical level at which investment to employment decelerates to 0% and contracts, effective demand for businesses and labor/households reaches the cyclical constraint, profits after tax contract, state and local receipts contract, the economy decelerates to stall speed or enters recession, the fiscal deficit bottoms, and the U rate bottoms.
It’s what used to be referred to as the “capitalist” business cycle (yes, quaint, I concede), or at least what used to reflect its cyclical characteristics, assuming that the system still exists, although I would not personally place a large bet on that assumption at this point.
«the situation is that BEA can’t hit the side of a barn with a GDP number»
But they cannot, because of a fundamental problem in “mature” economies: GDP is supposed to to be close to national VALUE ADDED, and in mature economies the vast majority of economic activity is government and services, and there are huge theoretical and practical problems with measuring the value added of government and services.
Some statistical bodies make up the numbers for value added in government and services, most hand-wave “estimates” that amount to making up the numbers only with a bit more finesse. Note: value added of government is probably less of a problem than that for services, and there are some strong hints signs large parts of the service sector are actually value subtracting (most of Wall Street for example), and exist mostly to provide what Graeber calls “bullshit jobs”.
The result is that a very large part of nominal GDP is fairly arbitrary. Note: even without all the usual tricks used to boost eastimate of real GDP, like systematic use of the Gerschenkron effect, using artfully underestimated deflators, …
I have the impression that in the recent narratives of some economists who obviously know better there is an attempt to redefine GDP from value-added to “monetary flows”, or some other equivalently easily manipulated metric, as if there were a talking point memo doing the rounds.
«These are the official, top line numbers of the government of the United States.»
Therefore they are both market-moving and a hugely political propaganda points, both internally and externally, and the chances of those numbers not being “influenced” are essentially zero. This regardless of the theoretical and practical issues with measuring value added in services and government (80-90% of economic activity).
We all know the many ways in which official numbers for other market moving or bottom line affecting indexes like unemployment and inflation are “influenced”, with cohorts of well-cared-for academics defending those manipulations as improving accuracy. Plus recent news have shown that private-sector provided index numbers that move markets of affect bottom lines have been manipulated by significant numbers of top market participants.
The Fed Board have their own surveys and numbers (which they are often reluctant to release) because obviously they are not fully satisfied with “official, top line numbers of the government of the United States”, plus serious economists use their own estimates based on proxies that are harder to “influence”; IIRC even Greenspan used proxies like sales of men’s underwear.
«If you’re telling me that the best BEA can do is x +/- 2 percentage points, that’s absolutely terrible. If Exxon came out and said, well, that’s our profit plus or minus 50%, the CFO would be gone in a week. Two days, tops.»
But only because Wall Street expects CFOs to know better than to *admit* that their reported profits are arbitrary numbers to a significant degree.
Great! Your comment really nails it. I have absolutely no confidence in those numbers. They were fabricated, and no one has the ability to really check if they are real. I shall point out that it is not just the evil US government who does this. This junk statistics happens on all sorts of levels. One of the best sources of manipulation lie in the real estate market, which is one most important characteristics of economic well-being of the population. They include in their sales also contracts that are often changed, when buyers make up their mind, and the correction comes almost one year after, when they don’t bother anyone. But who cares…
Are you an accountant, Blissex?
I have a degree in accounting; I was a Director of Financial Advisory Services at Deloitte; I sat on the boards of a number of publicly listed companies (albeit in Hungary), and I was the chairman of one for seven years.
Now, certain accounting policies have an arbitrary aspect. These include depreciation rates; loss recognition; expensing vs capitalizing; asset retirement accounting; and for the oil and gas business, the reporting of reserves. Some of these are dictated by the profession (GAAP / IFRS); some by law (expensing vs capitalizing for tax purposes; SEC reporting requirements); and some by corporate policy. These standards typically do not change quarter to quarter, although they may change from time to time. Accounts are prepared in accordance with these standards using very sophisticated software and armies of accountants; and financial reports are audited by armies of auditors. These numbers are not prepared or reported willy-nilly. There is a very standard process used by companies like Exxon.
Now, there is room for discretion and opportunity to reveal or disclose information. Loss recognition, for example, is subject to some discretion, which I have also used in my capacity as chairman of the board. This influences timing but not value. The booking of reserves is also a matter of some subjectivity. The US independents like Chesapeake have been criticized on just these grounds. They have paid top dollar for some leases, only to have these pop up as a big write-off later. Further, there is real debate as to which decline curves properly reflect ultimate recoverable resources per well. This is in part due to a lack of historical data for horizontally fracked shale wells. Both Jim and I have expressed reservations about the underlying economics of shale drillers.
On the other hand, Exxon issues its quarterly reports 45 days after the close of the quarter, and this involves consolidating entities from more than 50 countries from a vast variety of businesses. It is highly unusual, indeed it would be shocking, for Exxon to later materially restate these earnings. We had one such issue when Shell had to restate its reserves in 2004. This led to the resignation of its Chairman, Philip Watts. Which is exactly the point I am making.
I am not arguing that GDP numbers fully capture the economy, or that data definitions are not to an extent subjective. I do not believe I made any criticisms of including R&D in GDP numbers (although I had my doubts). I am asking why a number prepared using these standards is dramatically different that a number 90 days later prepared using the same standards. The size of the variance tells me that i) some data may not be available in timely fashion; ii) that the data is available but the systems to collect it are not; iii) that something may have changed which is making it harder for BEA to make estimates to fill in for missing data; iv) the skills of BEA staff have deteriorated for some reason (turnover); or v) the whole place is poorly managed.
That’s what I would like to know.