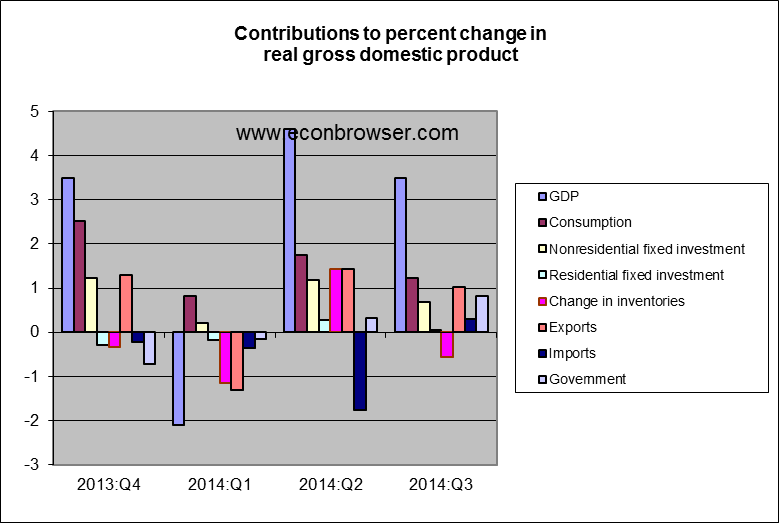
The Bureau of Economic Analysis announced today that U.S. real GDP grew at a 3.5% annual rate in the third quarter. That combines with a 4.6% annual growth rate now reported for the second quarter, giving us an average growth rate for the last six months that is solidly above the postwar average.

U.S. real GDP growth at an annual rate, 1947:Q2-2014:3. Blue horizontal line is drawn at the historical average (3.1%).
Almost all the components of GDP contributed, with solid gains in consumption, nonresidential fixed investment, and government spending. Even imports were down and exports were up, though some deterioration in that last category is a distinct possibility if concerns of a slowdown outside the U.S. prove justified. Inventory drawdown exerted a slight drag on GDP.
Our Econbrowser Recession Indicator Index, which uses today’s data release to form a picture of where the economy stood as of the end of 2014:Q2, fell back to 5.0%. The temporary spikes in the index that resulted from the falling GDP numbers for the second quarter and weak numbers for the end of 2012 look to have both been temporary aberrations. Recall that our indicator would have to rise to 67% before we would declare that a new recession had begun. Instead the data at the moment unambiguously signal an ongoing recovery.
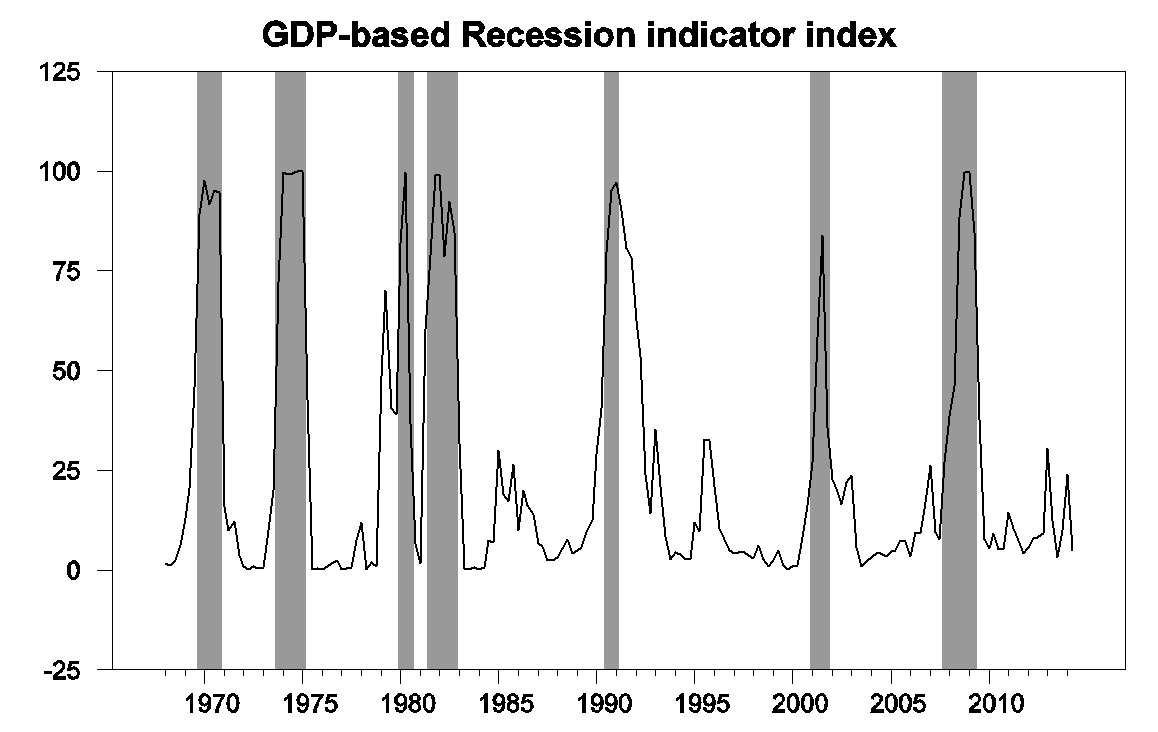
GDP-based recession indicator index. The plotted value for each date is based solely on information as it would have been publicly available and reported as of one quarter after the indicated date, with 2014:Q2 the last date shown on the graph. Shaded regions represent the NBER’s dates for recessions, which dates were not used in any way in constructing the index, and which were sometimes not reported until two years after the date.
MFR’s Joshua Shapiro had a pretty reasonable take-away:
Looking ahead, with growth abroad either slowing or already considerably slower than that of the U.S., it is highly unlikely that the net export deficit will continue to narrow. To the contrary, some retracement of third-quarter move is likely, and therefore trade ought to weigh on growth in the fourth quarter. Also, federal defense spending is unlikely to replicate its third-quarter strength in the fourth quarter. On the other hand, inventory accumulation will probably not subtract from growth as it did in the third quarter. Consumer and capital spending, meanwhile, are unlikely to vary substantially in terms of their contributions to growth. Net, net, it probably still seems reasonable to expect fourth-quarter growth in the 3.0%-3.5% range, although we will fine-tune our estimates in the coming days after having had a chance to go through today’s report in more detail.
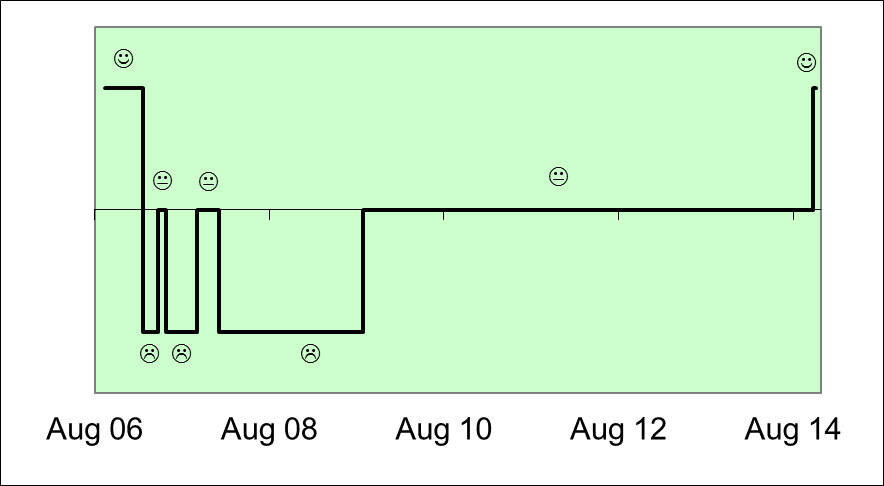
The 4% growth rate of the last 6 months may not continue, and storm clouds gathering over Europe and Japan may darken and bring at least some rain our way. But for now, I think it’s reasonable to conclude that the U.S. has entered a phase of solid but not spectacular growth. At least it’s enough to finally bring a smile to our Econbrowser Emoticon for the first time in 8 years.
| Date | Status |
|---|---|
|
Sep 13, 2006 | 
|
| Feb 21, 2007 | 
|
| Apr 25, 2007 | 
|
| Jun 27, 2007 |
|
| Oct 5, 2007 |
|
| Jan 4, 2008 |
|
| Aug 30, 2009 |
|
| Oct 30, 2014 | |
Please stay tuned to this station to see how long it’s going to last.
It will last for a while. Oil is going to remain cheap, which will help the global economy. And US oil production will continue strong, which will also help the economy. I think the next 12 months look quite promising.
By the way, the oil perspective holds out, expect the most improvement from the PIGS.
Question: don’t have time to dig into the numbers, so how much is housing related? I know it’s like 17-18% of GDP and it seems there’s been a substantial upswing. Secondary question: if so, how much of the growth is catching up in housing?
Bu-Bu- but Obama was supposed to destroy the economy!
At least that’s what Hannity and O’Reilly and Limabaugh say.
*GASP* You mean Fox News is lying?!?
😉
I would probably argue that the central driver of economic performance is shale oil production. That’s the big differentiator between the US and Europe. This happened more in spite of Obama, rather than because of him.
Nevertheless, at the end of the day, the President is either blamed or praised for the state of the economy. If the economy does as well as it might, Obama can claim the credit.
Employment-Population Ratio is still low:
http://data.bls.gov/timeseries/LNS12300000
Incentives matter.
For example, why build a business when it takes so much risk, work, responsibility, and dealing with career government bureaucrats?
It’s a lot easier to be lazy – work part-time, collect tax credits and other government benefits, take a couple of fun classes each semester, while receiving free money in grants & scholarships, etc..
Peak:
How many people in the US are lazy? All those who work part time, all those who collect tax credits, all those who take a couple of fun classes while receiving free money in grants and scholarships? What studies are you citing? Ooops, I forgot when you are speaking ex cathedra you don’t need supporting data!
Do you need a study to prove incentives matter?
My take on this: http://www.prienga.com/blog/2014/10/6/employment-to-population-ratios
Steven,
nice site. but i think the conclusions on your site are not quite correct. as you note, germany has had a nice runup on employment ratio, while france (and other euro countries) have struggled. you suggest if other countries followed germany’s reforms they would do nicely as well. that may not be true. germany has benefited immensely from a monetary policy directed to their advantage, while many of the other countries in europe had to struggle with higher interest rates than their economies suggested. had monetary policy been modified to benefit those countries, they would have done better and germany would have done worse. german success at the expense of the other euro countries was significantly influenced by euro policy.
Baffs –
I’ve looked at all the comps in Europe, that is, all the major northern European countries. If your hypothesis were true, we’d expect to see gains similar to those seen in Germany also the Netherlands, Austria, Luxembourg, and Belgium (and frankly, France). And we don’t. Therefore, we can conclude that, while the Northern Tier European countries may have benefitted, on average, from a somewhat undervalued exchange rate, nevertheless, the gains occurred markedly only in Germany. This suggests that policy was key.
Note also that the US is by far the worst performer in the group, compared to pre-recession times. Disability payments policy and the explosion in student debt explain a lot of the variance.
Finally, note that Italy has 23 fewer working age people employed per every 100 than, for example, Switzerland. Everything you need to know about Italian public policy can be summarized in that one statistic.
The graph is here: http://www.prienga.com/blog/2014/10/31/employment-to-population-ratio-detail
Perhaps a more relevant statistic is the difference in wage growth between the various euro countries in the years before the crisis. As you can see from the chart in This blogpost , Germany has had far less wage growth than both northern and southern eurozone countries. This has helped German growth partly at the expense of German workers because the growth in wages has been lower than the productivity growth. The other part has been at the expense of the rest of eurozone countries since low wage-growth means less inflation, less inflation compared to other countries within a currency area leads to a devalued currency compared to the others. This happened in Germany but not in the Netherlands or France so I guess it’s more consistent with the data you cite.
kopits, how much was policy and how much was the result of reunification of germany? they present a unique, interesting case as they absorbed east germany into a western economy. i think it is fair to say that germany was not in the same situation as many of the northern tier euro countries. however, it does appear that the northern tier (including germany) performed better than the southern tier during the past decade. it is fair to anticipate this performance difference was partially dictated by economic policy which was better suited to the north than the south. how would things be different if the policy had been directed towards the south? i guess when you talk about german reforms, you need to realize they had working conditions, due to the disparity between east and west germany, which are hard to replicate in the other euro countries.
German reunification was 1990. Hartz IV labor reforms were 2005. The improvement in the German employment-to-population ratio stems from 2005.
Baffling,
Re German economy after 1990.
The first decade was characterized by a loss of competitiveness of the German economy due to the very low productivity of the East German workers, therefore, it is always a little bit funny when people start the discussion after 2000, when the sh*t had already hit the fan in Germany. Hint: Krugman’s “Why Germany kant kompete” was published in 1999. 🙂
This approach is of course smart as it avoids unconvenient questions.
An interesting approach would be to compare the German and Austrain economy between 1990 and 2010, Austria has the same industrial structure as Germany, has been in a currency union with Germany since 1970, but had no reunification-like experience. As German expat living in Austria, I would expect that data show that Austria gained a lot of ground in the years 1995-2005.
kopits,
the hartz reforms existed because of the economics of reunification. germany needed to unify a capitalist and socialist economy, and this presented a situation which was different than the other northern tier countries. this unification did not happen overnight. my point is you are offering up the benefits of reform, but that occurred under very specific economic conditions that no other country in europe, or the world for that matter, experienced. to extrapolate those same effects to other countries is probably dubious. eurozone policy was most likely optimal for the german situation.
Baffling wrote: “this unification did not happen overnight. my point is you are offering up the benefits of reform, but that occurred under very specific economic conditions that no other country in europe, or the world for that matter, experienced.”
That is debatable. The problems that became really pressing around 1995-2000 due to the reunification had existed before and were already a problem in the 1980ies; e.g. the German unemployment system was neither flesh nor fish, relatively generous unemployment payments without real pressure to get a new job, many easy opportunities for early retirement etc. These developments were unsustainable even without the reunification.
The Harz “reforms” were a clear deterioration for long-term unemployed persons in Germany, you get less money and you are now a welfare recipient, i.e. social status changed too.
So when will all of this growth show up as higher wages for those not in the top 10%?
Thanks Professor, and thanks to the Federal Reserve even if they did it by accident. It does appear that the improvements in the economy are real, not because of President Obama’s policies but in spite of them (fracking, natural gas, and coal production).
The FED began to pull back on their monetary expansionary policies in 2011 and by mid-2011 the price of gold topped out. Gold began to signal that the currency had began to stabilize versus the economic activity. Surprisingly, the FED held firm in its slow end of QE and the price of gold continued a slow decline.
In late 2012 production began to pickup in the economy and the price of gold dropped significantly. But then stabilized in mid-2013.
Gold then held its value around $1,300 for nearly a year. Producers found that their forecasts were more reliable with the gyrations of windfall profits and loses due to currency fluctuations significantly declined.
One word of caution. It appears that gold is continuing to slide dipping below $1,200 in early October. Gold has slipped 37% since its high. If the FED does not stop the decline in gold we face a deflationary recession as in the Volker recession of the early 1980s and the Greenspan recession of 2000. The only problem is that the FED defines deflation as price deceases rather than an appreciation of the currency. By the time they detect deflation due to price decreases the currency will have been in deflationary mode for many months.
Contrary to what my Austrian brothers are preaching, the FED needs to seriously consider increasing the money supply to halt the decline in the price of gold. If the FED really wants to return to the amazing growth of what the uninformed call the Great Moderation, they need to fix their eyes on the price of gold, just as Greenspan did until 1995.
Steve,
How do you account for the fact that the spurt in the economy came while oil was selling for over $100/bbl and Brent was through the roof? It seems silly to say that growth has been caused by low oil prices. The current low price of oil is a reflection of the economy not a driver of the economy. The economy grew in spite of the high oil prices. That should be a signal as to whether oil is a driver or an indicator of economic activity. A case in point, notice the stability of the oil prices during the “Great Moderation” when the price of gold was stable. I do believe that oil is a component of the world recovery but that is dues to the oil companies finding ways to circumvent government obstacles and wedges, and increase the provision of oil to the producers.
Ricardo –
Oil producers get to consume more oil. The US did, after 2011, in significant part due to increased shale oil production. This also helped on the current account (see Jeffrey Frankel’s recent post here, for example). Therefore, while the European economies were grinding it out to reduce oil consumption, the US was under much less pressure. And that shows up ultimately in GDP. That’s my thesis.
As regards the Great Moderation. As Jim has pointed out, during that time oil prices were not correlated with GDP growth (save as compared to the 1979-1983 period of stagflation). Keep in mind that the framework I’m using is binding constraint analysis. Thus, when a resource is not a binding constraint, then it does not affect growth. During the Great Moderation, oil was not a binding constraint, and you can see that clearly on slide 31 of my Columbia presentation. (You can also see why Carter and Obama share a fate, and why Reagan does not deserve as much credit for ‘Morning in America’ as he got.)
Parenthetically, I would note my comment on Menzie’s last post (Lazear), that our current forecasting techniques are pretty useless in predicting GDP, even one or two quarters out. That suggests the entire methodological approach is flawed. Both Lazear and Menzie imply as much. I suspect that a binding constraint approach (which analysts already use anecdotally) would be more fruitful. With a binding approach method, you can call a turning point without having to change a trend line. The methodology turns the trend automatically. In essence, it treats an economy as an ecology. It will continue to grow, until it can’t. (Hence, there is no such thing as a lack of aggregate demand: Human desires are always boundless, and resources are always scarce. It’s just a matter of figuring out which one it is.)
But that’s just an aside.
Here’s my blog, if you want to entertain yourself with some graphs. http://www.prienga.com/blog/
I’ve been posting pretty regularly recently. Some oil, some macro.
Robert Hurley,
Peak is essentially correct he simply used words that allowed you to demagogue a political talking point.
It is not that people are lazy, they are very resourceful. The people of the inner city know the government subsidies and requirements better than anyone with a real job. They are masterful at maximizing their return from government programs. The primary problem is that Progressives have structured these subsidies so that they do not show up as income. For example food stamps and medical benefits are not counted as income for those subsidized. So income figures do not really report income and studies of inequality are bogus.
But government subsidies are still a trap for the poor. For them to receive these subsidies (that actually thrust them into the top 10% of income in the world) they face restrictions on their actual reported income and even worse their assets. Most states will not qualify anyone for food stamps unless they have less than $5,000 in assets. This means that the poor have to be creative in divesting themselves of capital, the one thing that most economists agree creates wealth. So consider, when the number of those receiving food stamps under President Obama grow from 27 million to 50 million, there was a massive destruction of capital, just so the applicants could qualify.
As an example let’s say I save $10,000 so I do not qualify for food stamps. Now if I spend $5,000 of that on equipment to allow me to start a home business I still do not qualify for food stamps because my assets are to great, but if I spend $5,000 on a big screen TV I do qualify for about $8,000 per year in food stamps. By shifting from being productive to being a couch potato I have made $3,000 and even gained a big screen TV. These people are very intelligent – they are trapped in slavery to the state, but very intelligent. They CAN do the math.
Ricardo. I am lucky enough to actual talk to poor people through volunteering with youth who have dropped out of school and with a faith based community organizing group. I retired from a successful career where I had little contact with the poor. Although my experience is anecdotal, it is based on reality and not ideology. So unless you have data to prove your assertions, they have no credibility to anyone but another ideologue. Alternatively, you could try living on what people getting food assistance get for a month and get back to me with your observations based on reality.
Please cite the studies published in reputable journals that show the data supporting this. Please cite the papers you have had published in reputable journals showing the data you have obtained from your boots on the ground time with the poor. The World Awaits your revelations.
One of the largest components of GDP growth, about 0.66 percentage points, was military spending. Apparently the only way we can get Republicans to do the right thing regarding fiscal stimulus is to start more wars. What a waste of spending and labor that could more profitably be spent on infrastructure, education, etc.
Since SAAR q-o-q is so unreliable, for the US I go by table 8 in the release, the quarter over same quarter of previous year. That came in at a fairly ho-hum 2.3%. So I’m still waiting for evidence of the acceleration. The SAAR q-o-q’s have given us several of these acceleration signals in the past four years. Is this the one that pans out? I’m doubting it.
Robert,
I have worked with the laboring class and poor since 1978. I know first hand how intelligent they are. My experience is also anecdotal but my example is sound. What numbers do you have to refute it? I have demonstrated how the law works and how those who apply for subsidies calculate.
I have a specific example of a young girl and her boyfriend who lived together for four years. She hated taking government assistance because her father was in the military and taught her it was wrong. She tried to get a job and pay her own way but after only a few months she saw that she was working away from her children and bringing home less money than if she stayed home and cared for her children herself.
A couple of years ago her boyfriend went to Texas and found a job on an oil rig. He started making good money and so she moved to Texas where they were married. They could finally afford to get married.
I believe you have a good heart and would like to help people but your support for our current system locks the poor into poverty. It is not welfare but state slavery.
The average monthly food stamp benefit is $133 a month. Please explain why people would prefer that to working. Even with the food stamp program out local food bank has seen unprecedented demand. This is in a mostly white middle class neighborhood. You asserted they are lazy but give no documentation aside from two people. As for welfare, if you earn more than $1,000, you don’t qualify. So your claim that people would rather get benefits rather than work makes no sense . Also, I think you would be surprised at the number of youth I deal with who want to own their own businesses. Far from encouraging people to avoid work, the system provides a minimum of support so meager that no one would take it over a job paying a living wage
Robert Hurley, you say: “…people would rather get benefits rather than work makes no sense.”
Here’s some reality:
Some people collect disability benefits and yet are capable of working. They do some work “under-the-table” (and don’t pay taxes).
Some people collect unemployment benefits, although they could get a job much sooner.
Some people refuse to work much overtime to avoid paying more taxes.
Some people go to college primarily for the money.
Etc.
If you pay people not to work, they won’t work.
We’ve seen an explosion in “entitlement” spending with a decline in economic growth.
If you want more, people have to produce more.
And, when it becomes harder to build a business, because of regulations and taxes, there are fewer jobs.
Waiting around for someone to provide you with a job may not produce a job.
Incentives matter.
peak
“some people…”
you need to support your argument better than this. how much is “some people” and how many of the “good people” are you willing to throw under the bus to punish these “some people”. there will always be “some people” taking advantage of the system, unless they are a very large percentage of the people under consideration, “some people” should not be dictating the policy towards the rest of the people in need. its the throwing the baby out with the bathwater issue.
Baffling, realistically, people tend to be rational.
You can’t blame them for that.
peak, i can challenge somebody who uses “some people” as a number significant enough to alter policy. my point is you can always find “some people” who are bending and breaking the rules as written. however, the number of “some people” is probably very small when compared to the population as a whole, and they should not be dictating policy.
The assumption that US oil production will continue to grow strongly is suspect.
Currently world oil supplies exceed demand and falling commodity prices imply that world oil demand will remain weak.
I doubt that $80 oil or $3.00 gasoline will stimulate enough additional oil demand to eliminate the oil surplus.
If that is an accurate assessment of the current oil world demand and supply situation it implies that prices will continue to fall until low oil prices cause production to also fall.
Historically, in the US falling oil prices helped the consumer but in the US the negative impact on oil output was exported.
At oil under $80, at the margin fracking becomes unprofitable. So if world oil output still need to contract to balance world supply and demand it implies that US fracked oil is likely to quit expanding and most likely will fall.
Consequently, I have very serious problems with the argument that US oil output will continue to expand rapidly. If so, in contrast to the historic norm, the US is likely to experience both the positive and negative impacts of lower oil prices.
Remember, in the long run it is to Saudi Arabia’s interest to keep oil prices below the level that will attract major new sources of supply.
Larry Summers:
“If total income were independent of efforts at redistribution, there would be a compelling case for reducing incomes at the top and transferring the proceeds to those in the middle and at the bottom. Unfortunately, this is not the case. It is easy to conceive of policies that would have reduced the earning power of a Bill Gates or a Mark Zuckerberg by making it more difficult to start, grow and globalize businesses. But it is much harder to see how such policies would raise the incomes of the remaining 99.9 percent of the population, and such policies would surely hurt them as consumers.”
To explain what I wrote earlier, the reason 2q and 3q GDP results look so strong is that 1q looked so weak. Growth has been trending at an average annual rate of around 2.2% since 2010 and we remain smack on that trend. All that has happened was an unusually weak 1q14 that has since been proved anomalous. 3q14 output was 2.3% more than 3q13.
If you look deeper inside the spend-side data, the only thing recently pushing up growth relative to trend has been the end of austerity, which is a one-off (you can’t end austerity twice). The personal consumption and business investment trends are stable, while the residential investment trend is slowing down. Again, look at table 8 in the release, which shows the trends much more clearly by cutting out most of the q-on-q noise. Production-side data of course will tell another story but we don’t have that yet.
i first read this three days ago and it still bothers me…i’m not questioning your propriety recession index or any of your conclusions, just that opening where you’ve combined the 2nd and 3rd quarters to come up with “an average growth rate for the last six months that is solidly above the postwar average” that’s solidly above average only because they’re coming off of a dismal first quarter, and to look at those two quarters in isolation looks a hell of a lot like cherry picking…after the first quarter contraction of 2.1%, our year to date growth for the nine months of 2014 works out to 1.473%, or at a little less than a 2.0% annual rate…to be honest, you should have at least made note of that…
Joseph
October 31, 2014 at 10:12 am
One of the largest components of GDP growth, about 0.66 percentage points, was military spending. Apparently the only way we can get Republicans to do the right thing regarding fiscal stimulus is to start more wars. What a waste of spending and labor that could more profitably be spent on infrastructure, education, etc.
Are you mentally ill? Which commander in chief started the “wars” that increased military spending this last quarter??
“Are you mentally ill? Which commander in chief started the “wars” that increased military spending this last quarter??”
I think you are missing the point. Republicans who have said no to all forms of stimulus spending — no to infrastructure, no to renewable energy, no to pollution reduction, no to education, no to unemployment insurance, no to food stamps, no to payroll tax cuts — seem to have an insatiable appetite for deficit spending just as long as it goes to military contractors and is used to kill Muslims somewhere in the world. Republicans’ complaint is that Obama is not spending money fast enough on military adventures.
About Italy: With approximately 25% of the total economy being unreported, statistics about employment rates, per capita income, etc are vastly misleading, The same holds true for every country that has significant levels of what is called the “informal economy”.
It’s odd that hardly ever gets discussed – that dark matter of the economic universe…
the Census report on Construction Spending for September estimated that our seasonally adjusted construction spending for the month would work out to an annual rate of $950.9 billion of spending overall, 0.4 percent (±2.0%)* below the revised August estimate of spending at a $955.2 billion annual rate and well below estimates of a 0.6% increase from originally published figures….construction spending for August was revised from the originally reported $961.0 billion to $955.2 billion and construction spending for July was revised down from $968.8 billion to $960.0 billion, so construction spending for the entire third quarter is considerably lower than previous estimates and will likely result in downward revisions of GDP components for residential construction, private structures, and public investment…..