And California and Minnesota surge ahead of the US. I know this sounds like a broken record, but the numbers are the numbers. And reader Patrick R. Sullivan suggests I move to Kansas, based on a Tax Foundation analysis (the same Patrick R. Sullivan who refuses to admit that his assertion that the depth of the downturn in Canada was less than that in the US during the Great Depression is wrong.) Here’s at least one reason why I don’t plan to. From today’s release of leading indices by the Philadelphia Fed, combined with last week’s release of coincident indices.
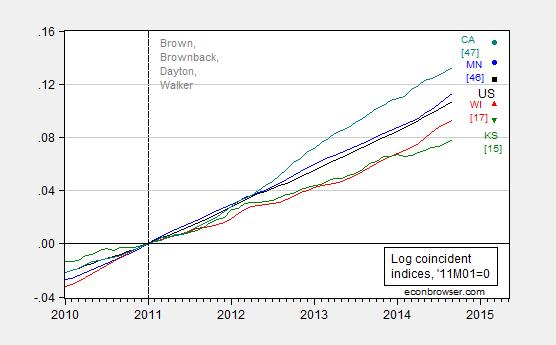
Figure 1: Log coincident indices for Minnesota (blue), Wisconsin (red), Kansas (green), California (teal), and US (black), and forecasted levels for March 2015, all seasonally adjusted, normalized to 2011M01=0. Numbers in [square brackets] are ALEC-Laffer rankings from Rich States, Poor States 2014. Source: Philadelphia Fed leading indices, coincident indices, ALEC RSPS2014, and author’s calculations.
That is, Kansas manages to do even worse than Wisconsin(!!!) Note the inverse correlation between the ALEC-Laffer ranking and relative cumulative growth. That inverse correlation holds for the fifty states (discussed in this post).
Note the Tax Foundation has a less than stellar record with the data… (see also here). But then, it’s not surprising that data-challenged people tend to cite data-challenged sources.
Update, 11/2 4:45pm Pacific: Reader Tom argues that I have misled by normalizing on 2011M01 (when Governors Walker and Brown took office). He argues I should normalize on business cycle relevant dates. In the interests of transparency, I am plotting herewith coincident indicators divided by population (interpolated), normalized on (1) last trough, (2) last peak, (3) 2011Q1 (where I have converted to quarterly frequency). Note that by dividing by population I am accounting for differing trends in population growth, which Tom argues is important.
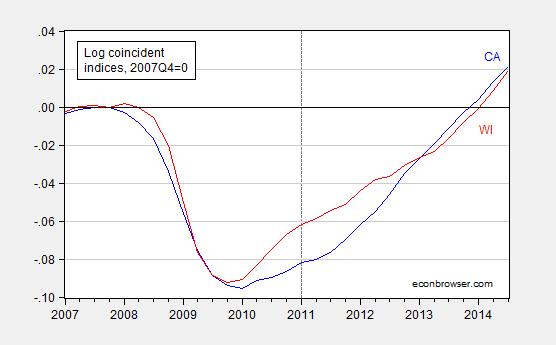
Figure 2: Log coincident index for California (blue) and Wisconsin (red), divided by population, interpolated from annual using quadratic match, all normalized to 2009Q2. 2014 population figures are projections. Source: Philadelphia Fed, BLS via FRED, state authorities California and Wisconsin, and author’s calculations.
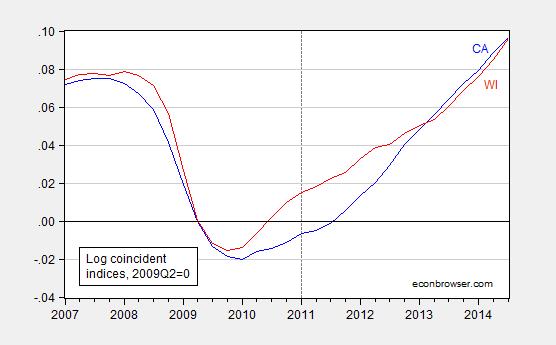
Figure 3: Log coincident index for California (blue) and Wisconsin (red), divided by population, interpolated from annual using quadratic match, all normalized to 2007Q4. 2014 population figures are projections. Source: Philadelphia Fed, BLS via FRED, state authorities California and Wisconsin, and author’s calculations.
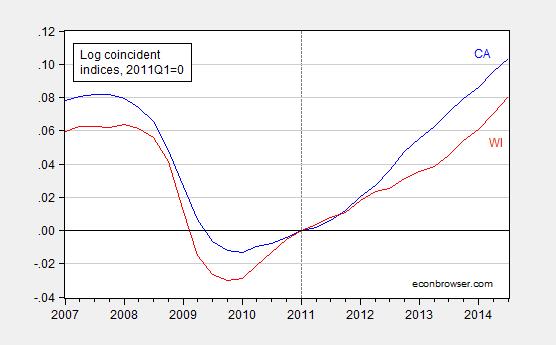
Figure 4: Log coincident index for California (blue) and Wisconsin (red), divided by population, interpolated from annual using quadratic match, all normalized to 2011Q1. 2014 population figures are projections. Source: Philadelphia Fed, BLS via FRED, state authorities California and Wisconsin, and author’s calculations.
Notice that until 2011Q1, the gap between WI and CA is widening. The gap shrinks thereafter. That could be completely coincidence, or a function of the extremely contractionary fiscal policies undertaken in Wisconsin, combined with the arguably elevated levels of policy uncertainty in this state — note the deceleration in Wisconsin growth right around end-2010. For the record, the legislation termed the “Budget Repair Act” or “Act 10” was submitted to the Wisconsin legislature on February 14. It therefore appears reasonable to me to mark 2014Q1 as a point when fiscal policies are changed.
According to that RSPS report:
California is 49th in net migration.
Texas is 1st in net migration.
“California spends nearly 200 percent more
per mile of highway built than most states.68 In
contrast, high efficiency allows Texas to employ
30 percent more highway employees per 10,000
of population than California.”
Texas, mane!
luke, you do realize it costs much more to build infrastructure through mountains and seismic zones of california than the flat prairies of texas? alot of your differential is buried in this distinction, as well as the significant cost of construction within the constrained metro areas of california. natural geography and demographics are the primary drivers in the “efficiency” you mention.
Texas is a larger state and has many unique ecosystems. The Texas population is less densely packed than California and therefore the demand for roadway in Texas is much higher; also, the net migration in Texas is much higher than California – implying more new communities in Texas (which eats into the labor supply available to build roads). Higher demand should imply higher cost. But you are right that there is some unique geological constraints in California.
luke,
“Higher demand should imply higher cost.”
But you are stating the cost per mile of road construction-not overall cost. that is why your analysis is incorrect. you have normalized to the mile of construction built-not the total number of miles to construct. the hundreds of miles of “prairie” highway in texas is much cheaper to construct than even a few miles of california congestion, particularly on a per mile basis. again, your numbers were quoted as per mile and not absolute terms.
Supply and demand curves are not always linear (and often never are). A shift in demand can create non-linear changes in cost per mile of roadway construction.
Well, I am more interested in the political business cycles hypothesis that you had a few weeks ago, as Wisconsin has picked up a bit since the beginning of 2014. Strangely, Brownback is also in a tight race, but he seems not to be priming the pump in KS. I think the key thing is that he does not have presidential ambitions.
It seems that the political business cycles hypothesis needs to include progressive ambition. My revised hypothesis:
H1: Governors running for President will increase fiscal stimuli in re-election years.
Your focus on this graph and attacks against “data-challenged” commenters is mysterious. You have chosen a graph that is favorable to your hypothesis, but this is simply correlation. Here is a graph from Fred of per capita real GDP that shows that Kansas did not have a recession in 2008 unlike CA and the US as a whole.
http://research.stlouisfed.org/fred2/graph/?g=Pio
You can download that data and determine if the integral still comes out in favor of CA – it’s too close to tell from eyeballing it. If you wanted to “prove” that CA has better policies than KS then you would have to present a model. A regression discontinuity is a simple framework that leans more heavily on the data than a structural model, but then you’d have to show more data prior to 2010 which is not favorable for your hypothesis.
Brownback and his policies start in 2011. These graphs compare before and aftter changes between states that had austerity to those that did not. All states’ data is included, due to the US line. This is a near perfect test of the effects of pro cyclical fiscal policy in a recession. And the results are clear as day, expansionary austerity does not work in a recession. Menzie deserves a lot of credit for his commitment to this exceptional blog research project.
Why do we need to keep explaining that over and over again?
That is not valid either as the policies did not go into effect the day of his inauguration (although there are certainly expectation effects). That is the problem with not having a model, what is your counterfactual? This does not control for the trend in the two time periods. A regression discontinuity one method of controlling for the change in policy. You would exclude the quarter before and after the policy implementation and compare the trends.
Tom: You do know you have just proved my point about being data challenged. Or at least you are visually challenged. The graph you provided via FRED includes US GDP per capita, and California real GSP, and Kansas population. I’m not sure what I’m supposed to take from that. Here is that graph, preserved for posterity, in case the graph you generated in FRED disappears.
You might find a plot of the actual Gross State Product data for Kansas here of some use. Sure looks like they got hit by the recession (Figure 2), unless my eyes deceive (Figure 3 is also of relevance).
By the way, a note for data presentation in the future: even if you’d managed to get Kansas per capita GSP in, mixing and matching annualized quarterly and annual growth rates is going to artificially reduce the apparent growth rates generated using annual data.
Try again!
The snark is unnecessary. It was done quickly while at work and has errors, but it appears you’ve entirely missed the point. Here is the corrected graph for per capita, which is obviously what I was trying to do if you had looked at the series themselves. Yes your other point about mixing and matching frequencies is valid, but again – haste. You’ll see the correct graph is not amenable to your hypothesis either.
http://research.stlouisfed.org/fred2/graph/?g=PCb
The point is that you’ve chosen one particular set of graphs to show over and over. There is no model and you have not explored other graphs that may not be amenable to your hypothesis. In particular with respect to earlier time periods. You point to an earlier post showing personal income, Fred only has per capita personal income but that is necessary if we are going to compare to CA.
Here is a graph of the index since the peak:
http://research.stlouisfed.org/fred2/graph/?g=PCa
And here is one with an index since the trough:
http://research.stlouisfed.org/fred2/graph/?g=PC9
In neither case does CA come out as an unambiguous winner and the visual impression is much different depending on where you set the starting period.
Tom: I have added three graphs, using (per capita) coincident indices generated by the Philadelphia Fed to be calibrated to real GSP. They are, following your suggestions, normalized to recent business cycle turning points. Since I am using coincident indices, I have three additional quarter’s worth of data relative to your annual plots. The message I obtain using this higher frequency and extended data is somewhat different than what you obtain.
It’s not that much different. Here is an alternative hypothesis. CA and KS have the same long term trend interrupted by temporary deviations due to the business cycle. CA entered the recession earlier and exited later. That phase shift results in a gap in growth. CA then has catch up growth to return to trend. KS and CA then both reach long-term trend around 2013Q1 and grow together thereafter.
My explanation explains the whole graph, yours only explains the change in slope around 2011Q1. What is your explanation for the change in slope again around 2013Q1?
In any case, without a model you cannot identify which of our theories is closer to the data. To repeat from our earlier correspondence for the benefit of your readers:
If a State has a more volatile business cycle then it will have a more severe downturn and a more pronounced recovery than a State with a more benign business cycle, all else being equal. That fact needs to be controlled for when evaluating any specific policy or administration. Merely comparing the different recoveries will ascribe too much to the policies enacted during that time (i.e. spurious correlation, the economy would have recovered anyways and you haven’t identified the marginal improvement due to a specific policy change).
I believe the newer graphs that control for the business cycle present a more complete picture and I thank you for posting them.
Now that’s hilarious! Perhaps the point Tom was trying to make is that it appears that people have been departing Kansas in a panic since Brownback decided to run for governor. Oh, wait — correlation is not causation.
MULawPoll @MULawPoll Follow
New Marquette Law School puts Walker at 50%, Burke at 43% among likely voters. #mulawpoll
1:20 PM – 29 Oct 2014
Just wait til the tempermental heiress gets in office;
http://watchdog.org/179822/mary-burke-trek-sales/
‘Burke apparently was fired by her own family following steep overseas financial losses and plummeting morale among Burke’s European sales staff, multiple former Trek executives and employees told Wisconsin Reporter.’
Of course, Mary’s story is that she wasn’t fired, it was just that the family reorganized the business and eliminated her job. What’s a girl to do, but go snowboarding.
Patrick R. Sullivan: I am still waiting to hear you admit you were in error regarding depth of the downturn in Canada vs. US during the Great Depression. As you recall, you stated unequivocally:
And this statement is wrong.
I’m thinking of this epitaph for my tombstone; Menzie Chinn is still waiting…to make a valid point.
Patrick R. Sullivan: I am still waiting to hear you admit you were in error regarding depth of the downturn in Canada vs. US during the Great Depression. As you recall, you stated unequivocally:
And this statement is wrong.
Patrick R. Sullivan: The veracity of the source leaves something to be desired. But I am not surprised you cite it.
See the Milwaukee Journal Sentinel editorial board on Mr. Ellerman.
I linked to the same article in a previous comment that Patrick R. Sullivan linked to. Given Menzie’s response to Patrick’s link, I’ll make some further comments.
Burke has made her supposed business experience a key argument to demonstrate her competency to run the government of Wisconsin. Voters are now finding out the truth about that, and, very predictably, the Democrats and their media allies have shifted into high gear to discredit Gary Ellerman, the initial source of the new information. Menzie of course dutifully links to the article discrediting Ellerman.
The article pretends to be even-handed and then goes strictly partisan by demanding that Walker fire Ellerman, which obviously would establish an association with Ellerman that Walker does not have, therefore damaging his candidacy. But the article of course doesn’t demand the same standard on the Democratic side. For example, the article doesn’t demand that Burke ask that Debbie Wasserman Shultz be fired for using domestic violence imagery to describe Walker’s policies. Nor does the article demand Burke herself stop, as the Washington Post noted, using ads with swastika imagery to attack Walker. The article Menzie links to pretends to be objective journalism, but it’s just a disguised partisan attack ad that the Burke campaign did not have to pay for.
The Democrats, and their media and academic allies, are trying to distract the voters by pretending that Ellerman is the only source of the new information. But that’s not true. Tom Albers, former President and CEO of Burke’s company, confirmed Ellerman’s account in a radio interview.
As Albers explained in the interview:
“I had made the decision a couple of months ago that I would not come forward on my own with information about Mary Burke. The only thing that’s brought this to a head is the article in which Gary Ellerman threw my name out there as someone who had conducted a review of Mary Burke’s performance in Europe. I decided that instead of saying ‘no comment,’ I wasn’t going to lie. I would tell the truth.”
Albers went on to say that
“I have not talked to Gary Ellerman since 1997, so I had no idea that he was going to use my name in that article, but it kind of opened the flood gates here when he did…I don’t know of anything in that article that was untrue.”
According Albers:
“Her performance in Europe was not good. We were losing a lot of money for us at the time. I don’t remember the amount, but it was considered significant based on where we were at that particular point in time. And also, we were encountering personnel/people problems over there. The people were threatening to leave the company. Many of them were.”
“Her way of managing was kind of a ‘her way or the highway’ kind of approach to things,” and her subordinates “felt that she wouldn’t listen to them and was just imposing things on them that didn’t make sense.”
“So because of all that—which had gone on for a while, obviously—John Burke went to his father basically saying, ‘We need to make a change over here.’ Obviously, being a family situation, this was extremely sensitive and very difficult to pursue. So Dick Burke came to me and said, ‘Before anything is done here, would you go over there and give me your thoughts on what the situation is like?’”
“I pretty much came back with the same conclusions that John Burke had made; and that was that we had major people problems over there and were in a situation where we could lose a lot of people. We were losing a lot of money and I couldn’t see where Mary Burke was going to turn this thing around.”
“The family—and by that I mean Dick and John Burke—finally agreed to bring her back. And so, to say it bluntly, she was fired.”
And when you hear Mary Burke describe what happened, it’s pretty obvious what really happened. Mary Burke’s account of what happened is:
“The truth is that after getting five additional offices up and running and managing seven operations, we decided to restructure and there was no need for my position and two of the people reporting to me could directly report to people in the United States. I was part of that decision to restructure and did that and then decided to leave.”
I love her “tell” when she says “the truth is.” When people begin with that, you know the truth’s not coming. Indeed, they “restructured” and then Mary Burke went on an extended snowboarding trip. Is snowboarding expertise sufficient experience to govern Wisconsin? Apparently, quite a few of the state’s citizens think so.
What! County party chairman says bad things about political opponent? Stop the presses! Surely this has never happened before. Bring out the fainting couch and smelling salts.
Joseph,
Read my comment more carefully. The former CEO and President of the company corroborated completely the county party chairman’s account. Imagine how poor her performance must have been if her own father had to take action to remove her. And yet she’s been telling voters that they should entrust her to run the Wisconsin government based on her experience and accomplishments in business.
Hæmorrhaging Kansas. Wilting Wisconsin. But what, Menzie, about Maine?
Gov. LePage.
Same playbook, verbatim, as the governors of K and W.
Correlation?