Nonfarm payroll employment clocks in substantially above consensus (321,000 vs Bloomberg: mean 230,000, range 140,000 to 275,000), solidifying trend growth. Previous months’ estimates revised upward. Wages continue to rise, but labor costs in productivity adjusted terms are stable.
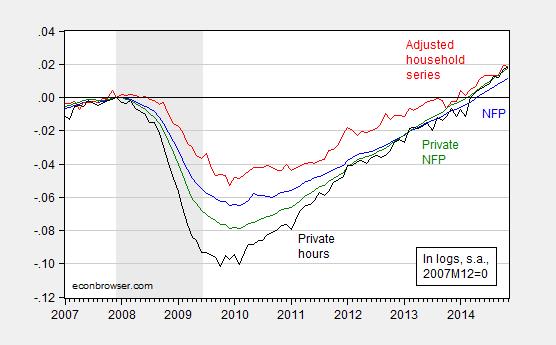
Figure 1: Log nonfarm payroll employment as estimated by the BLS in the establishment survey (blue), and as estimated by the BLS in the household survey, adjusted to conform to the NFP concept (red), and private nonfarm payroll employment as estimated by the BLS in the establishment survey (green), and index of average weekly hours for production and nonsupervisory workers as estimated by the BLS in the establishment survey (black), all seasonally adjusted by the BLS, normalized by the author to 2007M12=0. Recession dates as estimated and defined by the NBER Business Cycle Dating Committee shaded gray. Source: BLS via FRED, BLS, NBER, and author’s calculations.
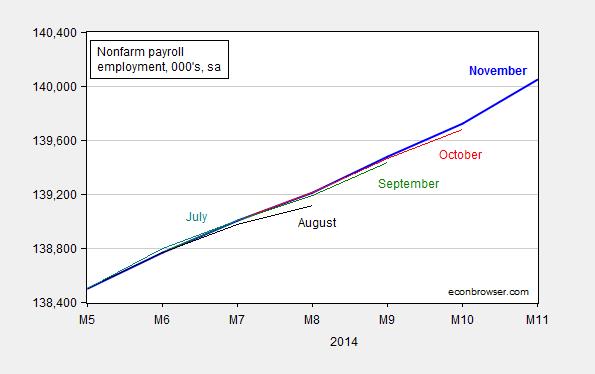
Figure 2: Nonfarm payroll employment as estimated by the BLS in the establishment survey November release (blue), October (red), September (green), August (black), and July (teal). Source: BLS via FRED.
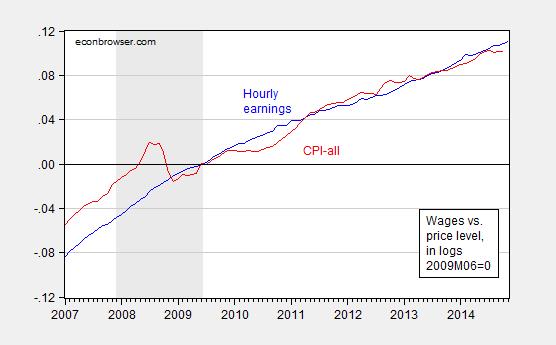
Figure 3: Log average hourly earnings for production and nonsupervisory employees, as estimated by the BLS in the establishment survey November release, and log CPI-all (red), both normalized to 2009M06=0. Recession dates as estimated and defined by the NBER Business Cycle Dating Committee shaded gray. Source: BLS via FRED, NBER and author’s calculations.
While hourly pay appears to be rising faster than the CPI-all (including energy and food), it’s important to recall that inflationary pressures from the labor sector will only manifest in overall price inflation only if (i) unit labor costs also increase, and/or (ii) inflationary expectations become unanchored (of which there is little evidence thus far). Figure 4, derived from the costs and productivity release (revision released a couple days ago) indicates little upward pressure — see the green line below.
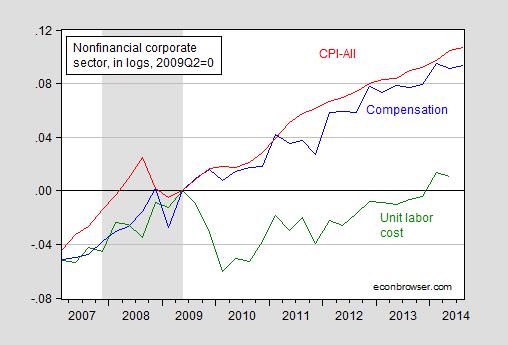
Figure 4: Log estimated compensation for nonfinancial corporations (blue), estimated CPI-all, quarterly average of monthly data (red), and estimated unit labor cost index for nonfinancial corporations (green), all normalized to 2009Q2=0. Recession dates as estimated and defined by the NBER Business Cycle Dating Committee shaded gray. Source: BLS, and BEA via FRED, NBER, and author’s calculations.
Note that unit labor costs are now only 1.1% higher than the previous peak in 2009Q2 (in log terms). I mention this because of the comments by Joint Economic Committee Chair Brady (R) on the employment release:
“This month’s report is good news for American workers,” Brady said. “As the job market improves, the Federal Reserve must begin to normalize monetary policy.”
“In the 1970s, Washington policymakers relied on the Fed’s easy money to compensate for anti-growth tax and regulatory policies. The result was double-digit inflation,” Brady said.
The Chair makes no reference to inflationary expectations, trends in realized inflation, and the trajectory of energy prices (which differ quite markedly from those in the 1970’s). But then, Chairman Brady has a penchant for warning about inflation when none is in sight [1], [2].
See discussion by Furman/CEA, Stone/CBPP, McBride/CR (1), McBride/CR (2), Portlock/WSJ RTE, Zumbrun/WSJ RTE.
I think we’ll set a test of inflation and interest rates coming up in the summer. As we move off of oil as a binding constraint, the next one is either capital or labor.
It might be worth a post looking at the impact of the collapse of oil prices on sources of liquidity, ie, petrodollars. The flows are going to reverse markedly to this group, ie, they will rapidly show up as uses, not sources, of excess liquidity.
To be completely fair to Chairman Brady, many members of the FOMC have been warning about a pickup in inflation “just around the corner” for uhhh… since the Fed started expanding it’s balance sheet. Actually before, that – many were worried about a pickup in inflation in Sept 2008. Dallas Fed prez Fisher, along with Plosser and some others, are serial offenders. Although recently, even the Dallas Fed President has been less hawkish than usual.
The key question for 2015 will be whether the Fed is willing to wait to see a normal labor market before raising rates, to buy some recession insurance with the risk of slightly above target inflation.
The current rise in labor cost is interesting, especially if you look at the recent quarterly data.
2013 IIII…….-3.1%
2013 IV……..-2.1%
2014 I……….+11.4%
2014 II……….-3.7%
2014 II……….. -1.0%
If you exclude the first quarter jump that was due to shock of severe winter weather, the last few quarters averaged minus -2.2.
This average of falling unit labor cost is probably a better basis for evaluating the basic trend than the data you show
P.S. the spread between unit labor cost and the non-financial business deflator is a great determinate of corporate profits or earnings.