Today we are fortunate to have a guest contribution written by Jeffrey Frankel, Harpel Professor of Capital Formation and Growth at Harvard University, and former Member of the Council of Economic Advisers, 1997-99.
Oil prices plummeted 43% during the course of 2014 – good news for oil-importing countries, but bad news for Russia, Nigeria, Venezuela, and other oil exporters. Some attribute the price drop to the US shale-energy boom. Others cite OPEC’s failure to agree on supply restrictions.
But that is not the whole story. The price of iron ore is down, too. So are gold, silver, and platinum prices. And the same is true of sugar, cotton, and soybean prices. In fact, most dollar commodity prices have fallen since the beginning of the year. Though a host of sector-specific factors affect the price of each commodity, the fact that the downswing is so broadly shared – as is often the case with big price swings – suggests that macroeconomic factors are at work.
So, what macroeconomic factors could be driving down commodity prices? Perhaps it is deflation. But, though inflation is very low, and even negative in a few countries, something more must be going on, because commodity prices are falling relative to the overall price level. In other words, real commodity prices are falling.
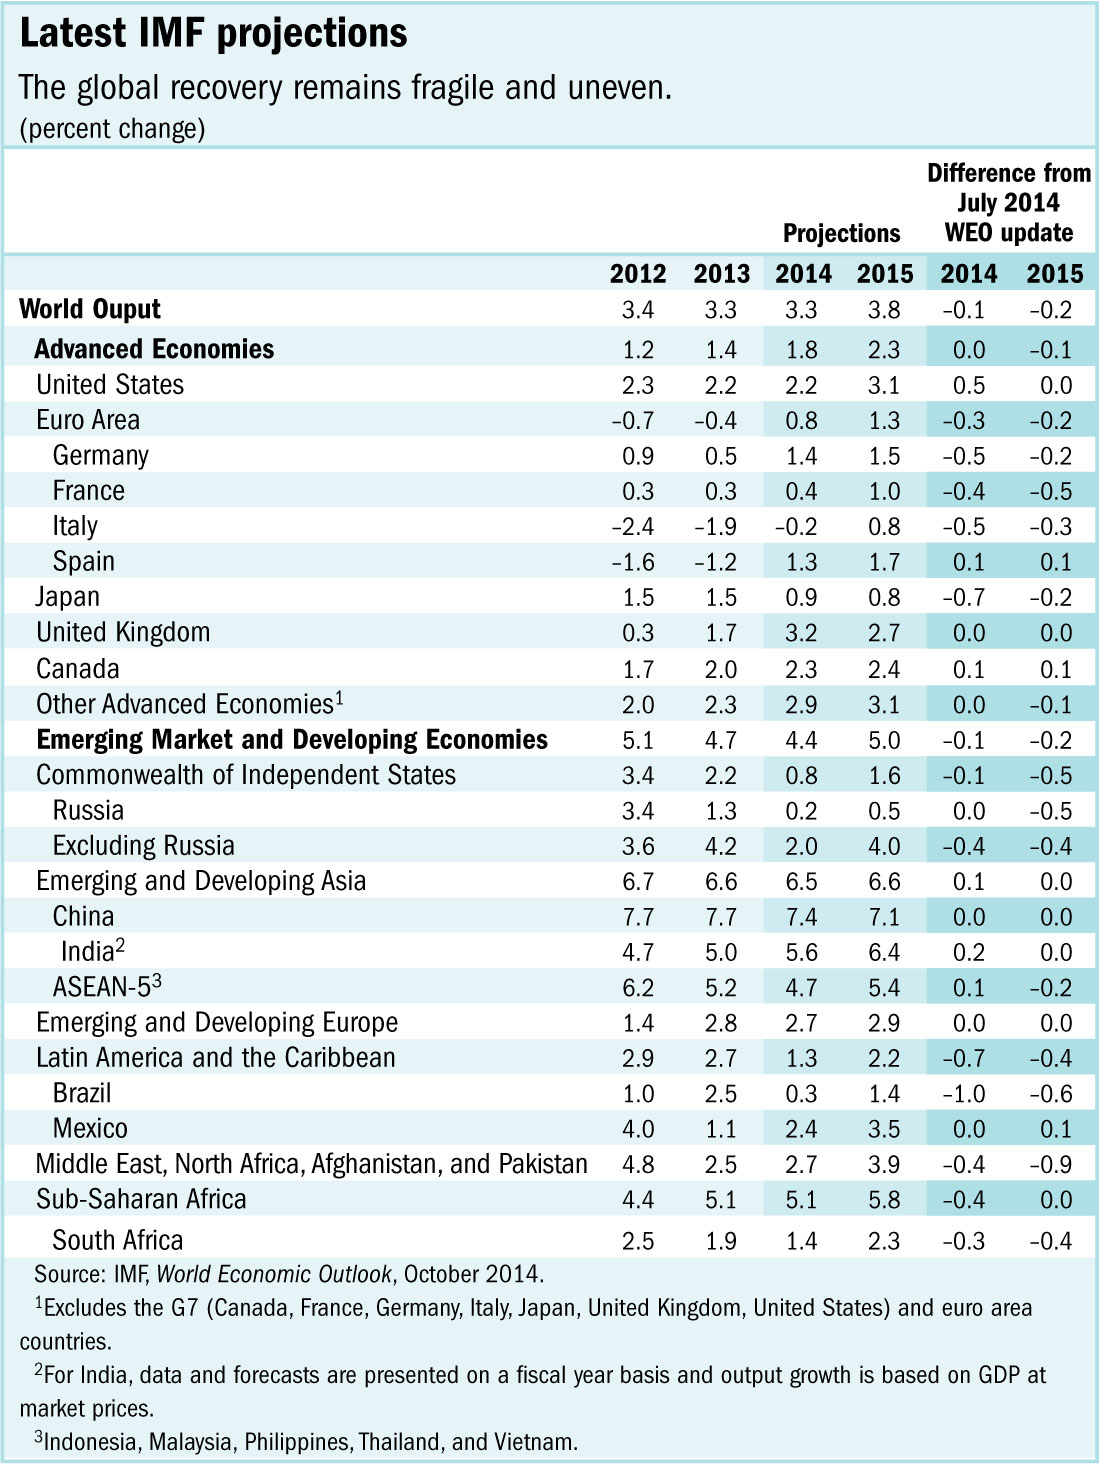
The most common explanation is the global economic slowdown, which has diminished demand for energy, minerals, and agricultural products. Indeed, growth has slowed and GDP forecasts have been revised downward in most countries.
But the United States is a major exception. The American expansion seems increasingly well established, with estimated annual growth even exceeding 4 % over the last two quarters. Private employment has risen by more than 200,000 for each of the last ten consecutive months. And yet it is particularly in the US that commodity prices have been falling. The Economist’s euro-denominated Commodity Price Index, for example, has actually risen by 4 per cent over the 12 months; it is only the Index in terms of dollars – which is what gets all the attention – that is down 6%.
That brings us to monetary policy, the importance of which as a determinant of commodity prices is often forgotten. Monetary tightening is widely anticipated in the US, with the Federal Reserve having ended Quantitative Easing in October and likely to raise short-term interest rates sometime in the coming year.
This recalls a familiar historical pattern. Falling real (inflation-adjusted) interest rates in the 1970s, 2002-04, and 2007-08 were accompanied by rising real commodity prices; sharp increases in US real interest rates in the 1980s sent dollar commodity prices tumbling.
There is something intuitive about the idea that when the Fed “prints money,” the money flows into commodities, among other places, and so bids their prices up. But, what, exactly, is the causal mechanism?
In fact, there are four channels through which monetary policy affects real commodity prices, via the real interest rate (aside from whatever effect it has via the level of economic activity).
- First, the extraction channel: high interest rates reduce the price of non-renewable resources by increasing the incentive for extraction today rather than tomorrow, thereby boosting the pace at which oil is pumped, gold mined, or forests logged.
- Second, the inventory channel: High rates also decrease firms’ desire to carry inventories. (Think of oil held in tanks).
- Third, the financialization channel: Portfolio managers respond to a rise in interest rates by shifting into treasury bills and out of commodity contracts (which are now an “asset class”).
- Finally, the exchange rate channel: high real interest rates strengthen the domestic currency, thereby reducing the price of internationally traded commodities in domestic terms (even if the price has not fallen in foreign-currency terms).
US interest rates did not really rise in 2014, so most of these mechanisms are not yet directly at work. But speculators are thinking ahead and shifting out of commodities today in anticipation of future higher interest rates in 2015; the result has been to bring next year’s price decrease forward to today.
The fourth of the channels, the exchange rate, has already been at work. The end of Quantitative Easing in the US has coincided with moves by the European Central Bank and the Bank of Japan in the opposite direction: toward enhanced monetary stimulus through their own versions of QE. The result has been an appreciation of the dollar against the euro and the yen. The euro is down 10 % against the dollar over the last year and the yen is down 13%. That explains how so many commodity prices can be down in terms of dollars and yet up in terms of other currencies at the same time.
[A version of this column was published at Project Syndicate.]
The post written by Jeffrey Frankel
“But speculators are thinking ahead and shifting out of commodities today in anticipation of future higher interest rates in 2015; the result has been to bring next year’s price increase forward to today.”
Did you mean price decrease?
Yes, I did indeed mean “decrease,” in that 2nd-to-lat paragraph. Thank you for pointing this out. I will have to get it fixed.
JF
B.B.: You are correct. I have corrected the error as of 2:50PM 12/20.
And the practical use of Jeff’s theory would be : buy cotton in dollars and sell it in euros, and you are a rich man.
Love whose simple linear economic models for a complicated world.
Johnny:
No; that’s not right, I am afraid. The “simple linear economic model” includes the following equation:
US Price (in $ per pound of cotton) = European price (in euros per pound of cotton) / Exchange rate (in euros per $).
It follows that even if the commodity price is down 6 % in $ while up 4 % in euros, one could not get “rich” by buying cotton in the US and selling it in Europe, because the dollar has appreciated 10% against the euro at the same time, offsetting the changes in local-currency prices. This is precisely what one would have expected. Things don’t always have to be complicated.
JF
BTW : my post about the ruble yesterday : Rosneft ROSN was at 198, today at 210. equ. plus 128.900 USD for me. Was right again.
Menzie, can you hear me ?
Amazing how you lie about job creation just like everyone else in the libtard media . The fed cooks the books including 401 k earnings, Itune sales and other stupid stuff included into GDP you failed to mention. Also you left out some very important facts about the jobs report last month which I expect from a idiot like you. 150,000 full time jobs where lost! another 156,000 f t and p t jobs where lost in the 16 to 24 age group so would you care to explain to me what that does to your b s jobs theory?
Frankel wrote: The fourth of the channels, the exchange rate, has already been at work. The end of Quantitative Easing in the US has coincided with moves by the European Central Bank and the Bank of Japan in the opposite direction: toward enhanced monetary stimulus through their own versions of QE. The result has been an appreciation of the dollar against the euro and the yen. The euro is down 10 % against the dollar over the last year and the yen is down 13%. That explains how so many commodity prices can be down in terms of dollars and yet up in terms of other currencies at the same time.
I am not exactly sure why Frankel wrote about “channels” one thru three. As he notes interest rates have been low so if these items had an impact on commodities it should have been to raise their price and we all know that is not happening. So these “channels” appear to not be supported by the data.
His channel number four is the answer to his question. When the FED appreciates the dollar as it has since 2011 and other CBs depreciate their currencies, as the euro and yen have been doing, you have changes in the purchasing power of money. This is not rocket science. The theory that the ECB and the BoJ are following is the same failed theory that has been followed by the ECB, BoJ, and the FED in the past. With the FED breaking with the other two CBs we can witness the result. The Krugmanesque technique of massive debasement of the currency has been disproven over and over but there are those who are wedded to illusions.
The stabilization of the dollar along with the decline of commodity prices to more realistic levels will go far in generating economic growth. The FED appears to be doing the right thing even if it is by accident. Contrary to many doom-sayers 2015 could actually be a banner year, a stable currency, low commodity prices, Republican control of both houses of congress to curb government excess and begin talks of rewriting the tax code. I am finally encouraged. Even President Obama will have a hard time preventing recovery.
“When the FED appreciates the dollar as it has since 2011”
Where do you get this nonsense? Are you seriously this misinformed or seriously trolling?
Well, I have lots of comments on this.
“US interest rates did not really rise in 2014, so most of these mechanisms are not yet directly at work. But speculators are thinking ahead and shifting out of commodities today in anticipation of future higher interest rates in 2015; the result has been to bring next year’s price increase forward to today.”
The oil supply has overwhelmed demand. That simple. At the link below, see the graph entitled “US Shale Crude, Condensate, and NGL Supply Growth, kbpd / year”. That will show you graphically what has happened.
http://www.prienga.com/blog/2014/12/10/exxon-calls-peak-conventional-oil
It was assumed that Saudi would offset any increase in non-OPEC production by cutting its own. This faith proved misplaced, for the reasons outlined here:
http://www.prienga.com/blog/2014/11/11/understanding-saudi-oil-policy-the-lessons-of-79
and here,
http://www.prienga.com/blog/2014/11/26/opec-decision-on-production-cuts-in-the-balance
(By the way, Saudi policy is technically incorrect at present.)
Here’s commentary on the US current account and exchange rate, both of them are suggestive of a strong US dollar:
http://www.prienga.com/blog/2014/12/6/oil-and-the-trade-deficit
http://www.prienga.com/blog/2014/10/1/a-supply-constrained-view-of-the-production-surge (near the end of the post)
And on relative monetary policies in the US and Europe. If you’re looking for what separates US from European GDP growth after 2011, you won’t find it in monetary policy.
http://www.prienga.com/blog/2014/10/17/did-the-ecb-tank-the-euro-zone
So here’s what I think. I think US GDP growth in 2015 could reach 3.9% or more. And I predict the unweighted average of the PIGS (Port, Gr, Sp, Ire) will exceed this level.
Dave,
You have been trained by the floating dollar crowd and so you do not see deflation until prices begin to fall. Deflation is not falling prices but appreciating purchasing power of the currency. Price fall months after the currency begins to appreciate. By the time you see it in prices it actually could have reversed with a floating currency.
A graph of gold will give you a good view of the state of the dollar. You may be able to see it on this KITCO graph. The price of gold gives you the best indicator (not perfect but better than any other) of the purchasing power of the currency. Gold hit a high of $1,795 in November 2011. If you had been following here you would have noticed that I began to call an appreciation of the dollar in 2012.
Currently gold is near its 10 year average low. If the FED continues to push it down we actually could see some negative impact due to deflation, but gold appears to have slowed its price decline (appreciation) since mid-year 2013. I have been pleasantly surprised that Janet Yellen has held things relatively stable. Her background and writings made me believe she was a huge stimulus expansionist. She has actually been pretty good; much, much, much better than Bernanke – what a disaster!
Ricardo
Yellen may be great, be terrible, or just middlin, but only one thing is certain, it is way too soon to know.
Ed
Good and timely article Menzie. We observe lots of evidence that many market players are anticipating rate hikes. The opportunity cost arguments are reasonably straightforward.
It compliments nicely the unexpected supply growth story. Is not macroeconomics interesting? Tougher than nails to empirically disentangle it all.
Frankly I believe that the zero interest rate policy explains in part the slow growth rates in recent years as it signals trouble in the 3rd unofficial mandate of the US central bank: Bail out the federal government.
Rising rates will signal enhanced US fiscal stability, and increase economic confidence.
Westslope: I would like to take credit for the article, but the credit rightly belongs to Professor Frankel.
Yes, Menzie, I understood that Jeffrey Frankel authored the piece. I was thanking you for posting it. Apologies for the lack of clarity.
Westslope: Ah, my mistake. Apologies, and thanks much!
I agree with Steve re dollar vs euro – the dollar is strengthening more for relative growth reasons than monetary policy differences. The ECB has not done QE, only talked a bit about maybe next year. The market is not anticipating anything big there. Vs the yen there is a clear monetary policy difference driving yen depreciation.
Sure the strengthening dollar is a factor in commodity price falls, but not a huge one. And with oil, US production increases are largely behind the dollar strengthening, so it’s a bit of a chicken or egg question. The common thread across commodities is that production grew faster than demand. It’s a fairly typical cycle, with production coming on in a delayed response to high prices right as rising bad credit is leading to tightening in the main commodity consumer economy, China.
I focus on the CRB: Raw Material Price Index for several reasons. One, it avoids the risk that at any given time their may be unusual factors impact the price of one particular commodity price. But more importantly, the year-over-year change in this index has a 0.8 correlation with the year -over- year change in world industrial production. Thus,on a real time basis it is a great concurrent-leading indicator of oil demand and it has given me many timely buy-sell signals for oil.
Interestingly, in Mid-December, as oil was bottoming, this index dropped to new cyclical lows. It is suggesting that the current rally in oil is a bear trap.
“Second, the inventory channel: High rates also decrease firms’ desire to carry inventories. (Think of oil held in tanks)”
Nope, this is plain wrong. Commercial crude inventories in the US closed the year up almost 3%, while commercial product inventories were up 4% y-o-y (EIA and Oil&Gas Journal). Atthe. same time, China’s reserves seem to have increased by a huge amount. This goes to show that demand from inventories has been pretty much reactive to price swings than ‘proactive’.
I do not doubt that demand-side pressures are at work — in fact, they appear to be even stronger than thought, as they manage to offset significant inventory buildups and keep the price low.