West Texas Intermediate sold for $105 a barrel at the start of July, but ended last week at $58. The most important factor has been surging U.S. production. But another reason oil prices have slid so much is weakness in demand for the product, which may be related to a slowdown of overall world economic growth. Here I comment on the importance of that second factor.
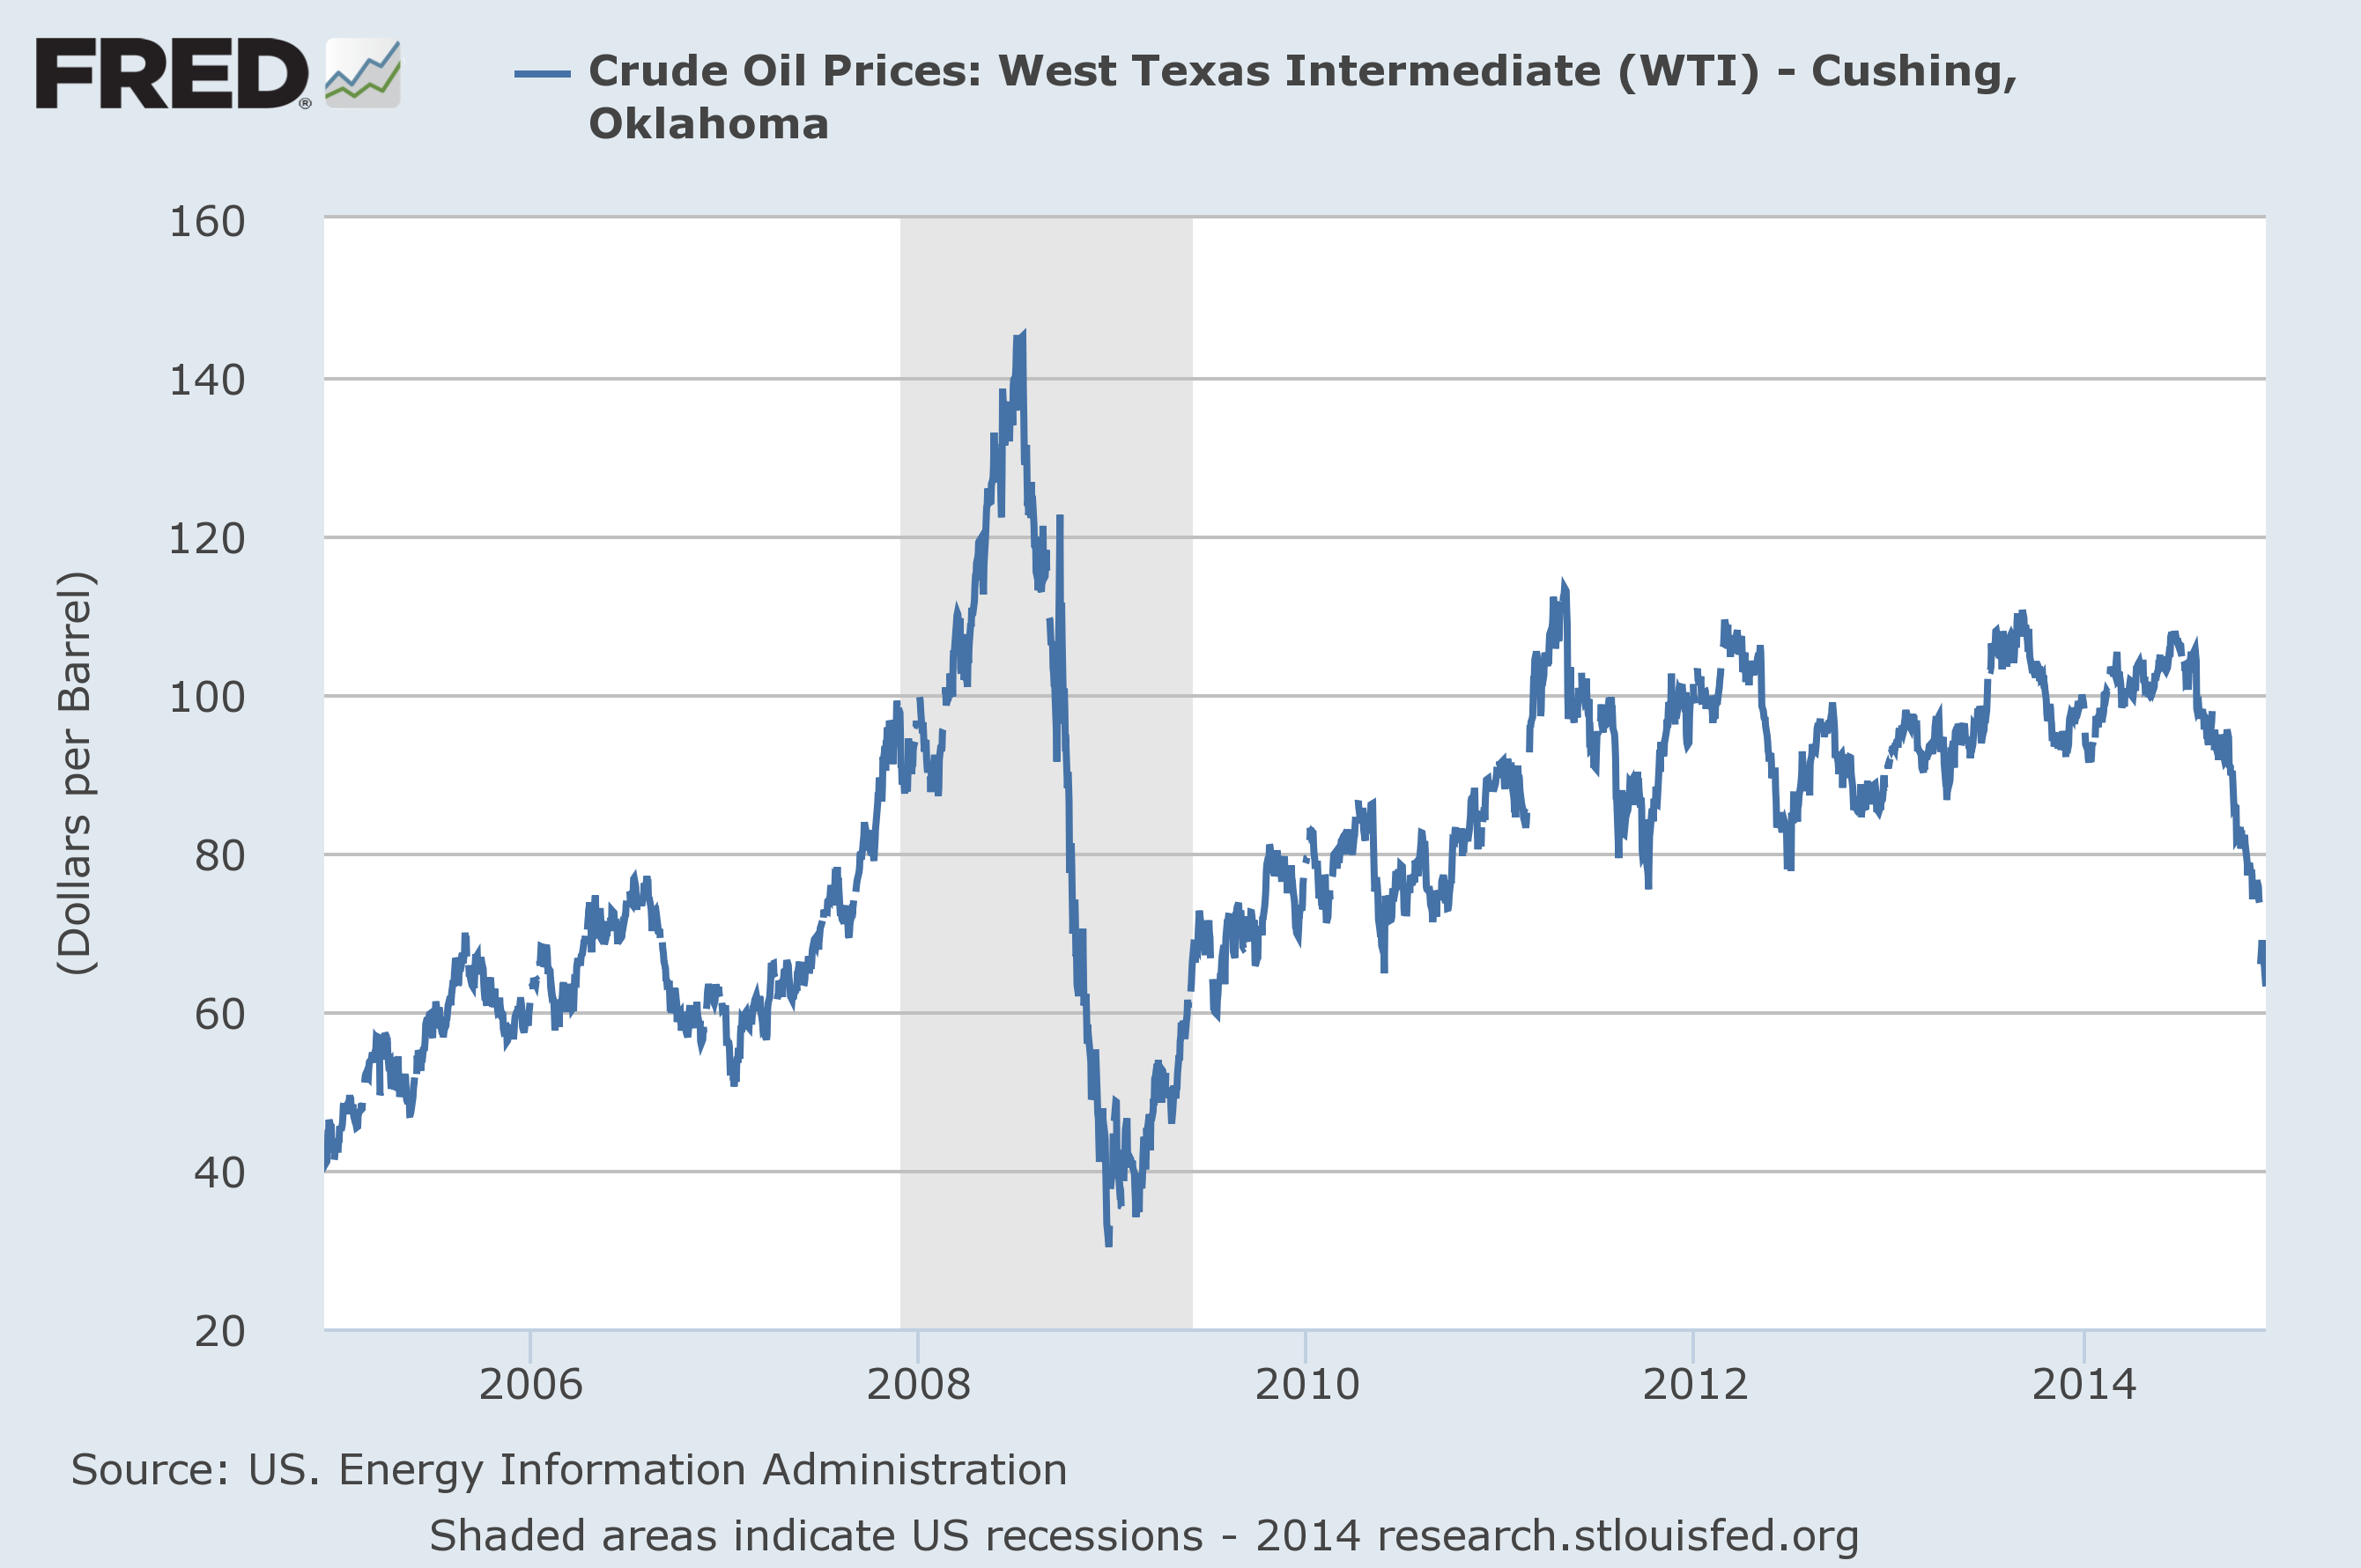
Price of crude oil (West Texas Intermediate, dollars per barrel). Source: FRED.
For example, the price of copper fell from $3.27/pound to $2.93, a 10% drop over those same six months. This of course has nothing to do with the success of people in getting more oil out of rocks in Texas. Softness in demand for commodities like copper and oil may be one indicator of new weakness in the world economy.
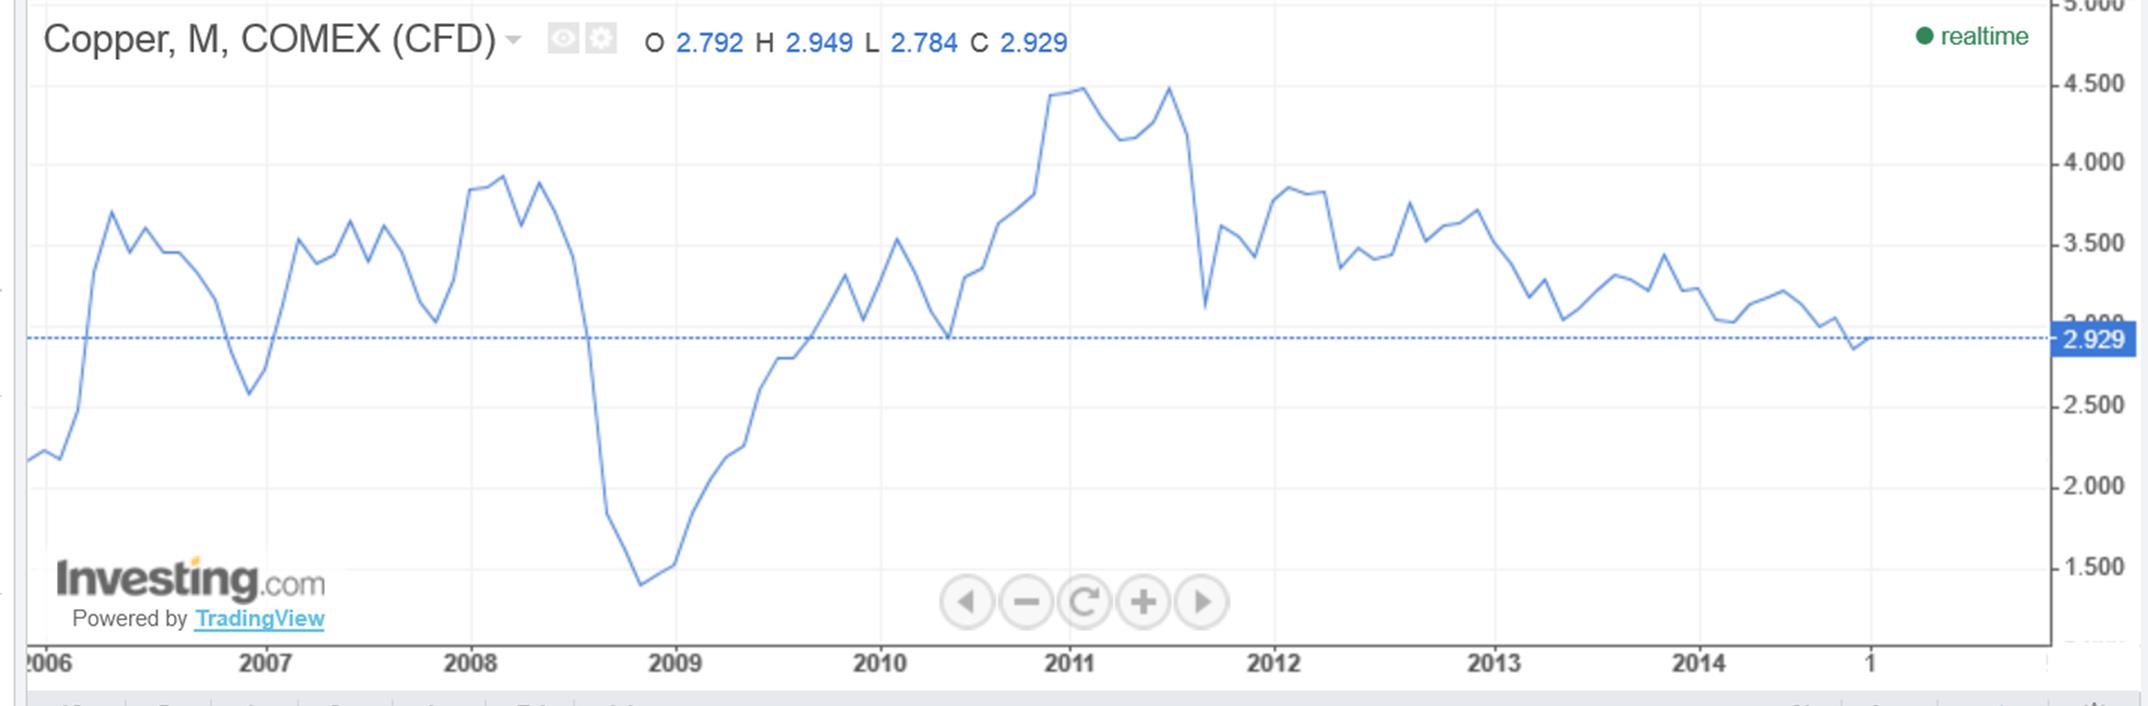
Price of copper (NYMEX, dollars per pound). Source: Investing.com.
The yield on 10-year U.S. Treasury bonds is also down almost 50 basis points over the period, for which I believe the most plausible interpretation is again weakness in the world economy.

Nominal interest rate on 10-year Treasury bonds. Source: FRED.
And the dollar is up 11%, which I attribute to the same cause.
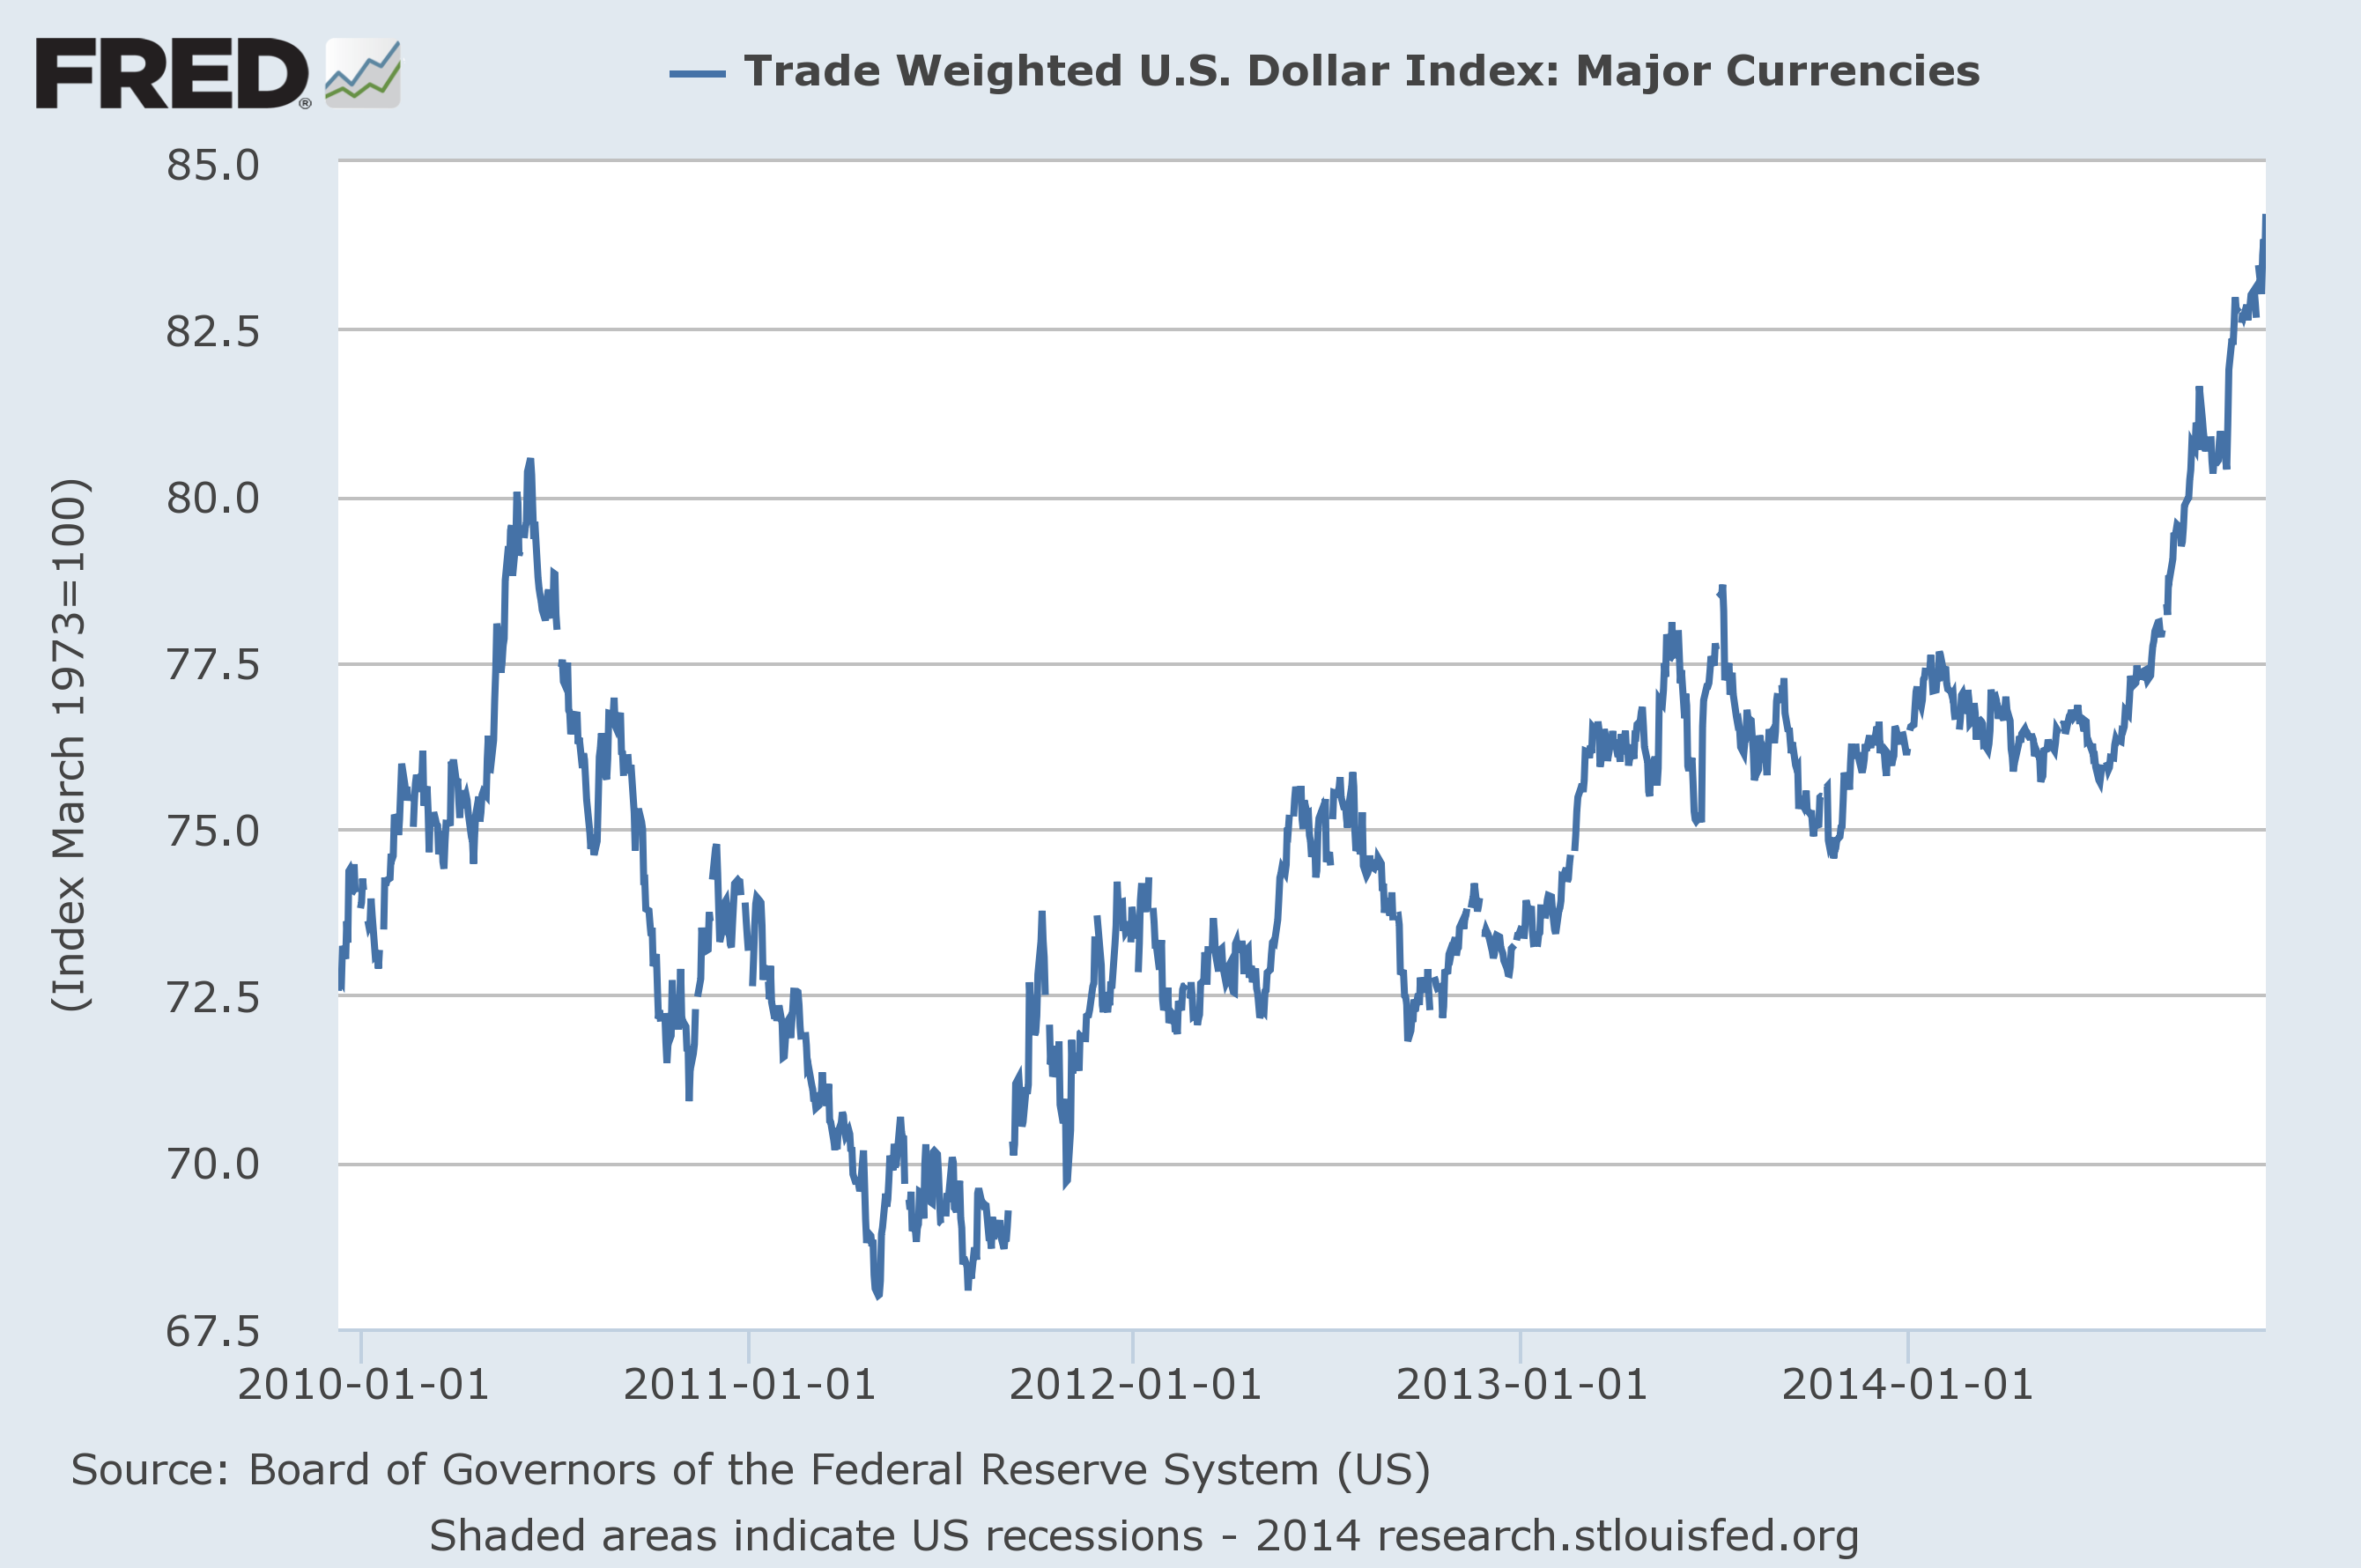
Trade-weighted index of the U.S. dollar. Source: FRED.
To get an impression of the quantitative importance of these developments, I regressed the weekly change in the natural logarithm of the crude oil price (here’s why I use logarithms for this) on the change in the 10-year yield and the change in the logs of the copper price and the value of the dollar using data from April 2007 to June 2014. Here are the results of that regression, with t-statistics in parentheses as calculated using a Newey-West adjustment with 5 lags:

I then used the coefficients from that historical relation to see how much of the drop in oil prices since this summer we would have expected to observe, given the observed drop in copper prices and the 10-year yield and the rise in the value of the dollar. Those predicted values are plotted as the dashed line in the figure below, with the actual price of oil in solid black. Even if we knew nothing on the production side of the oil market, we would have anticipated the price of oil to have fallen from $105/barrel in June to $85 dollars today on the basis of these other three potential indicators of world economic activity.
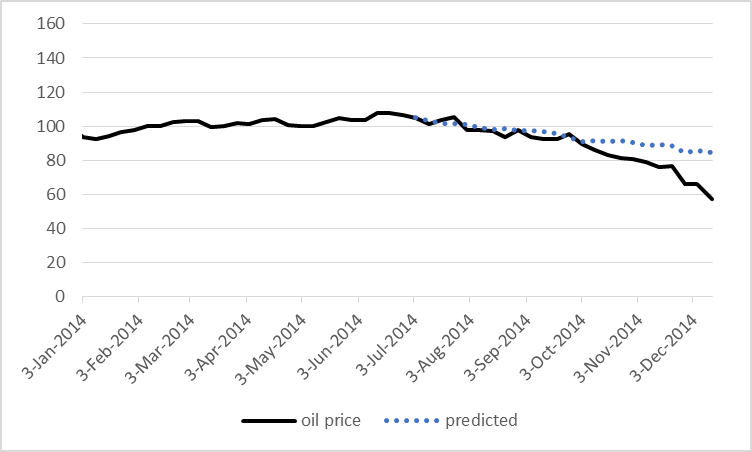
Actual price of West Texas Intermediate (in black) and value predicted on the basis of the above regression (dashed blue).
In other words, of the observed 45% decline in the price of oil, 19 percentage points– more than 2/5– might be reflecting new indications of weakness in the global economy.
Looks about right. Making such judgments is difficult given that the past to which you’re comparing also had other changing factors besides the strength of global growth. The surge in American production isn’t new. I think the concept most useful for explaining this to the layman is the marginal barrel. Output growth and demand growth seemed to be moving roughly in line since 2011, until suddenly in 2h14 it seemed that a big imbalance was suddenly revealed. That can be explained partly by the rather big chunk of Libyan production that did come to market suddenly, but mainly by the susceptibility of commodity markets to dramatic price drops to accommodate what may seem a rather small amount of marginal additional supply.
The story I don’t see getting covered here is how this puts American producers into a price war with each other. Everyone’s writing, wrongly, that Americans are in a price war with the Saudis. But the Gulf states are in fact just passively maintaining stable output and letting the Americans duke it out among themselves. And it’s getting bloody over there in Texas and ND. On the other hand those who emerge from this still walking will be very efficient.
Another amplifying factor is that oil net exporters have been increasingly their own sources of growing demand. Thus when oil prices collapse, their economies slow, their oil consumption growth slows, and they end up providing more net exports to the world market than previously projected, further pressuring prices.
Who knows what will happen next year, but we know what happened from 2008 to 2009. Annual Brent prices rose from $72 in 2007 to $97 in 2008, and then fell to $62 in 2009 (the monthly price fell from $132 in July, 2008 to $40 in December, 2008).
Here are the production, consumption and net export numbers for the (2005) Top 33 net oil exporters for 2007, 2008 and 2009 (mbpd, total petroleum liquids + other liquids). I call the combined net exports from the (2005) Top 33 net exporters Global Net Exports of oil (GNE).
2007: 62 – 17 = 45 mbpd
2008: 62 – 18 = 44
2009: 61 – 18 = 43
So, (2005) Top 33 consumption was flat from 2008 to 2009, but primarily because of Saudi cutbacks in production, GNE fell from 2008 to 2009. Note that GNE were 46 mbpd in 2005, versus 43 mbpd in 2013, and the supply of GNE available to importers other than China & India fell from 41 mbpd in 2005 to 34 mbpd in 2013.
Of course, the key question is what will the Saudis do in 2015? Note that the annual price of Brent for 2014 (probably around $99) will be quite similar to the 2008 annual price ($97).
It’s important to remember that as annual Brent crude oil prices rose from $25 in 2002 to $55 in 2005, Saudi net exports increased from 7.1 mbpd in 2002 to 9.1 mbpd in 2005. As annual Brent crude oil prices rose from $55 in 2005 to the $110 range for 2011 to 2013 inclusive, Saudi net exports have been below the 2005 rate for eight straight years. They have been either unwilling or unable (I think’s it’s the latter) to exceed their 2005 annual net export rate (in 2014, they net exported 8.7 mbpd). I estimate that the Saudis have already shipped, through 2013, about 40% of their post-2005 CNE (Cumulative Net Exports).
Unseen so far…What portion of commodity price decline is played by the aversion to prison from price fixing?
A point of trivia:
Years when the price of oil fell 40% or more YoY: 2008, 1986, 1931, 1921, 1897, 1878, 1873, and 1866.
With the single exception of 1986, each of the previous episodes occurred with the economy in recession, a stock bear market (among the biggest ever), and price deflation (albeit, except in 2008, under a classic gold or gold-exchange standard).
There is a technical projection from a bearish triangle implying $45-$50, with support/stop at $53/$39.
The collapse in the price of oil and the energy junk bond meltdown underway suggests that the global economy is much weaker than the headline data imply.
Moreover, along with capacity utilization reaching 80%, the surge in US industrial production since June and September appears wholly unjustified, whereas the cyclical change rate appears that the Juglar cycle is peaking.
I don’t know, look at the price, end of recession/beginning of recovery in most of those years, including I would say, 1986.
That’s correct. Domestic oil consumption will tend to fall with oil export revenues. Some of that oil production will be re-directed to export markets, at least pro forma.
An excerpt from a recent analysis by Steven Kopits:
I agree with Steven about a “Crash and burn” scenario, and note that the trillions of dollars spent globally on upstream capex since 2005 have only kept us on a post-2005 “Undulating plateau” in actual crude oil production (45 and lower API gravity crude oil), while we have (so far) seen a continued increase in global natural gas production and associated liquids–condensate and natural gas liquids (NGL). Note that Texas only accounted for 3% of global Crude + Condensate (C+C) production in 2013, but the Texas RRC shows that just the 2005 to 2013 increase in Texas condensate production would account for one-eighth of the 2005 to 2013 increase in global C+C production. (And note that when the EIA talks about “Crude oil,” they are talking about C+C.)
Some Thoughts on Net Export Math Vs. Net Cash Flow Math
As I have periodically noted, given flat to increasing oil consumption in a net oil exporting country, and given an ongoing production decline, the resulting net export decline rate will exceed the production decline rate and the net export decline rate will accelerate with time. We actually see something similar for the net cash flow from producing properties.
Let’s arbitrarily assume that we have five properties, each generating a net cash flow of One Million Dollars per month, after direct Lease Operating Expenses (LOE), and not counting General & Administrative (G&A) costs. Let’s assume that LOE percentages range from 10% to 50%, so the gross cash flow would vary for each property, but the net cash flow, after LOE, would be the same.
Let’s then assume that gross cash flow at the wellhead drops by 50% for all five properties, and let’s then look at the resulting decline in net cash flow for each property.
Again, we are assuming that the initial condition is that each property generates a net million dollars per month.
LOE = 50% of Gross, and gross declines by 50%, net declines by 100% (goes to zero)
LOE = 40% of Gross, and gross declines by 50%, net declines by 83%
LOE = 30% of Gross, and gross declines by 50%, net declines by 71%
LOE = 20% of Gross, and gross declines by 50%, net declines by 63%
LOE = 10% of Gross, and gross declines by 50%, net declines by 56%
One can see how a 50% decline in gross cash flow really hammers higher operating cost older properties, e.g., the North Sea and the North Slope of Alaska, and this is without taking into account G&A costs. Here is how Euan Mearns described the North Sea employment situation: “Here in Aberdeen a massacre is in progress.”
Of course, a projected lower price profile hammers the discounted Net Present Value (NPV) and EUR for all types of producing properties, especially high decline rate tight/shale plays and higher cost older properties.
In any case, it seems to me that the Saudis are targeting not only high cost US tight/shale producers, but also higher cost older properties, like the North Sea and the North Slope of Alaska. One also wonders about the older, higher cost Western Siberia properties in Russia.
It is not the Saudi’s by themselves doing the targeting, on which point of targeting I am in agreement. It is a larger far more powerful behind-the-scenes force. Of which, by dint of their immense wealth, the Saudi’s are of course a part. The real story of what’s happening to crude, and why it is happening, cannot be understood outside this larger context.
Oh, I have lots of problems with this analysis.
But, OK, let’s consider weakness in the global economy. Who’s weak?
US: In 2015, we looking at the best year since the heydays of the Clinton administration
PIGS: Best year since the mid-2000s
UK: Best in years
Northern Europe: Clear weakness associated Russia (see my post, here: http://www.prienga.com/blog/2014/11/14/q3-euro-gdp-stagnation-russia-or-oil) Hard to see how this plays out.
India: Looking pretty good.
Norway, Scotland, Venezuela: All will be in outright recession this year. (Did I predict that for Scotland? Look it up.)
China. Well, China. Guess what, guess who is grossly under-consuming oil per pro forma expectations? What to make of it? I can tell you that Xi is following the wrong strategy for the country. A strategy which is “viable” for a country like Russia (a country currently flirting with recession, financial crisis, sanctions, and war) is not appropriate for China. Commodity exporters can be autarkies, because exporting oil is really not that big a deal. For manufacturing powers, however, commercial relations–the free flow of goods, money, people and ideas–are critical for competitiveness. Xi needs to relax and take with some confidence that doing good will equate with doing well. For China, that’s the path forward. In any event, are we going to have a recession in China? You tell me.
So, as I survey the global landscape, I see some limited weakness in northern Europe, weakness in the oil exporters, and something–who knows what?–in China. But the rest is going to have a pretty good year, and the US, a really good year. Personally, I am far from convinced of the ‘global weakness’ argument, with the specific caveats as noted above. By the way, it might be worth commenting on US trade patterns. It looks to me like we’re going to be sucking in a good amount of non-oil imports. What does it imply? See the post here: http://www.prienga.com/blog/2014/12/6/oil-and-the-trade-deficit
I would note, however, that we are beginning to see efficiency gains coming through, particularly in gasoline usage. So weakness in demand may be confused with weakness in the economy, which may not be true.
Steven,
I heard, and it seems reasonable, the estimated net increase in global vehicles this year is about 50,000,000 vehicles (net increase being new sales less vehicles scrapped). Of course, it’s possible that the second half increase will be less than the first half increase, but in any case, based on the annual estimate, globally we are adding one million net new vehicles about every seven days. (Incidentally, the last number I saw indicated that electric and plug-in hybrid vehicles will account for 0.5% of new car sales globally in 2014.)
Globally, population is reportedly increasing by about 220,000 net people per day. So, globally we are adding about one million net new people every five days.
What I find “interesting,” given these numbers, is my estimate that we are depleting the remaining supply of post-2005 Global CNE (Cumulative Net Exports) at an accelerating rate. I estimate that in 2006 we burned through about 3.5% of post-2005 Global CNE, and I estimate that in 2013 we burned through about 5% of remaining post-2005 Global CNE.
I estimate that we have already burned through about 28% of post-2005 Global CNE, from 2006 to 2013, inclusive. Note that by definition, it’s not whether we have depleted remaining post-2005 Global CNE, it’s only a question of by what percentage.
Steven, looking at the proportional aggregate of the rate of real GDP per capita for the US, China, EZ, Japan, and Brazil, the change rate decelerated to the historical “stall speed” as long ago as Q4 2013 to Q1 2014.
Growth of investment and production in the shale sector, along with energy-related transport, is heavily skewing higher US industrial production (IP), so much so that it is giving a distorted picture of the US industrial sector and economy overall outside energy, transport, and ancillary sectors.
Also, US auto sales are being driven by another subprime credit bubble, this time for auto loans. Without the growth of subprime auto loans, the US would be selling 12-13 million vehicles instead of 16-17 million. Delinquencies for subprime auto loans have already begun to rise as of Q1 2014.
Now that oil has experienced a recession-like collapse, it is quite likely that energy investment, production, and employment will similarly decline in 2015, disproportionately dragging on US IP, especially in terms of YoY comparisons next year.
I think Bill McBride pretty much summarizes my sentiments: http://www.calculatedriskblog.com/2014/12/the-futures-so-bright.html
Steven Wrote: “I would note, however, that we are beginning to see efficiency gains coming through, particularly in gasoline usage. So weakness in demand may be confused with weakness in the economy, which may not be true.”
Failing oil prices are likely to contribute to a recession in the US. CapEx in Drilling and production will decline sharply on non-performing projects. Drillers are like to stop hiring and start laying off workers in 2015. The US is also likely to get hit with a big reduction in Healthcare (which is about 20% of US GDP) do to rising insurance premiums and deductibles (http://www.businessinsider.com/why-health-care-spending-in-gdp-obamacare-2014-6) The EU region has never left recession and is poised for further weakness since 1. Money is leaving the EU (do to fears of future banker bail-ins), 2. No QE to address excessive debt levels and EU banks not lending. Asia is only holding up because of massive construction bubble in China. http://www.ft.com/intl/cms/s/0/895604ac-10d8-11e4-812b-00144feabdc0.html Asia has an awful debt to GDP ratio and is completely unsustainable. For the US to grow it needs another credit bubble (like the past two: Internet and housing) which of course only causes future long term problems.
“I am far from convinced of the ‘global weakness’ argument, with the specific caveats as noted above”
Commodity prices have also fallen significantly. if energy consumption decline was just because of improving efficiency, why would copper prices fall by more than 1/3 in the past year? If the economy was growing, it would have been part of the drive for efficiency as the demand for electrical and communications infrastructure would have increased. http://www.nasdaq.com/markets/copper.aspx?timeframe=1y
FWIW: Employment is up because companies are converting full time workers into part time workers to avoid the Obamacare rules (http://www.forbes.com/sites/theapothecary/2014/09/17/take-it-from-a-restaurant-executive-obamacare-is-shifting-workers-into-part-time-jobs/). For every full time job lost, 1.5 to 2 part time jobs are created. The Money Velocity is also near all time lows. This does not show any economic growth in the US but a continuation of economic contraction http://research.stlouisfed.org/fred2/series/M1V. Labor force participutation is lower in 2014 than in 2013 http://data.bls.gov/timeseries/LNS11300000
Let me disagree categorically.
The US is a net oil importer. Low oil prices are good. And remember, the world still needs US shale oil production growth. That’s all the growth there is.
See here: http://blogs.platts.com/2014/12/10/low-prices-unconventional-oil/
Here’s consumer confidence. See how it’s literally soared since oil prices have fallen. That’s what two months of low oil prices can do for you.
http://www.calculatedriskblog.com/2014/12/preliminary-december-consumer-sentiment.html
1. Higher Oil prices created perhaps over 1 million US jobs (my guessimate). Not just the Drillers, but the truckers, the machinists, restaurants, carpenters building housing for the workers, and other services used by the workers.
2. The money used to finance drilling and production was financed using credit (ie mini credit bubble). That punch bowl has suddenly been removed. It looks like the High yield bond market is about to have a big correction soon. This could easily trigger a significant broad market correction crushing consumer sentiment.
3. US PMI just plunged to a 11 month low http://www.zerohedge.com/news/2014-12-16/us-manufacturing-pmi-plunges-11-month-lows-misses-most-record
4. US Holiday sales are down 11% from 2013. Sears has announcing its closing another 200+ stores and some retailers are probably going to go out of business in 2015 (ie JCPenny). This is during the time of the Consumer Sentiment survey was in progress. Why didn’t Holiday sales increase significantly if consumers were more confident?
5. Lower prices are unlikely to last in an economic recovery. Demand will quickly out pace production. As you reported and discussed, the only resources available to increase production is the very expensive oil and few of the Big Oil companies are interested in increasing CapEx. How can lower prices be sustained when the cost to bring new oil to market is perhaps in the $100 to $130 bbl range?
In my opinion the Consumer sentiment index is not a realistic source since they only contact a very small number of people (about 500) for the survey. The only reason I see that consumer are more confident is that subprime auto loans are back and the FHA/Freddie/Fanny have lowered the down payment requirement. US home sales increased in the Fall, presumably because the Fed was talking about rate hikes that pulled demand forward as more people acted to make sure they lock in rates before the Fed raised them. I think a significant reason for the decline in oil prices is because the global economy is weakening. I am sure lower prices have made consumers more optimistic but I doubt it will have any lasting impact on consumer spending and wages.
Thanks for all your insight. For what its worth, I do believe you are one of the smartest people in the room.
I think these lower prices will turn in to disaster. This is going to leave a long term bad sentiment in investors and they are not going to be eager to invest in expensive oil projects having gotten burned in the shale oil bubble. I think when oil prices start to rise they will be very reluctant to jump back in again, making it difficult to prevent significant global production declines. Without big CapEx investments I don’t see how the world can prevent a signficant decline in production. If exisitng production has an average decline rate of about 7% a year perhaps we could see declines as fast a 4% to 5% without investor support for CapEx.
If you want to know the impact of oil prices on capex, here’s a simple rule of thumb:
Capex will drop 1% for each $1 drop in the price of oil, with each percent drop worth $10 bn of capex. 40% drop equals $400 bn drop in capex. My estimate is roughly twice that of Goldman, but they’re working from their 380 list which only covers new projects and high capex, visible ones. Mine is more inclusive, and about right (maybe a bit on the high side).
The oil system cannot sustain a 40% drop in capex for any length of time.
Since the depth of the 2008 recession part time employment has grown slower than full time employment. Consequently, part time workers share of employment has fallen significantly. If you look at part time employment as a share of employment it looks very much like a normal economic cycle — surging in the recession and falling back during the recovery.
The Forbes article you cite shows part time employment in isolation and massively misinterprets the results.
You want to see your political biases confirmed so badly that you accept that poor analysis on face value.
In the BLS June 2014 Jobs report, the US lost 523,000 Full time jobs and created 799,000 part time jobs:
http://www.zerohedge.com/news/2014-07-03/june-full-time-jobs-plunge-over-half-million-part-time-jobs-surge-800k-most-1993
Most new jobs are retail, low wage jobs:
http://www.bloomberg.com/news/2014-10-03/food-economy-restaurants-supermarkets-fuel-job-growth.html
Its likely lots of these jobs will disappear after the holiday season as retail business usually add more full time jobs during the holidays to accommodate the seasonally increase consumer shopping. I am sure that rising healthcare premiums and higher deductables will have a significant impact on employment in 2015. I am sure that people will cut back on healthcare expendures as their deductible rise. They will likely also have less discretionary income when their premiums also increase. Starting in 2015 businesses with 50 or more employees are mandated to provide healthcare insurance for their workers. Its hard to believe that retail and other low margin businesses will not switch to many workers to part-time jobs in order to avoid higher outlays.
The state Hawaii has had a healthcare mandate and it cause most retail business to limit workers to 20 hours per week:
http://articles.latimes.com/2004/oct/24/local/me-hawaii24
“The law, however, has had an effect on how employers structure their workforces. Researchers at the University of Hawaii recently concluded that the law has made Hawaii employers much more reluctant to hire part-time workers for 30 or 35 hours a week, the standard in the rest of the country.
Instead, Hawaii has a disproportionate number of employees working just under 20 hours. The study found those workers were less likely to have health insurance than were employees in the rest of the country working comparable hours. ”
Recall that during the last two periods of strong employment growth there was a bubble behind them. In late 1990’s it was the Y2K and Internet bubble, and in the 2004-2008 it was the housing bubble. With the exception of the mini-bubble in domestic drilling and perhaps smart phone sales, there is nothing to drive the economy into growth. While the dip in gasoline prices will help the economic its likely to be hurt as drillers start cutting spending and jobs. Without the investment in drilling its difficult to see how low oil prices are sustainable and necessary to produce any long term economic growth. Perhaps early 2015 will not show any immediate declines but by the second half of 2015 the US will probably be back in recession.
TechGuy, you might not have noticed, but it’s not June 2014 any longer. It’s December 2014. Since then, the number of part-time jobs has declined by 605,000, ( http://www.bls.gov/news.release/archives/empsit_07032014.pdf versus http://www.bls.gov/news.release/empsit.t08.htm ) while full-time jobs have increased by 1,278,000 (same June .pdf versus http://www.bls.gov/news.release/empsit.t09.htm ).
And yes, BLS puts out new data every single month, whether or not a blogger at ZeroHedge sees fit to mention it.
Good comment. I remember what you taught me about gasoline usage a while back. Interesting that you notice efficiency is finally impacting usage.
If history is a good indicator, then this article is fair warning. http://www.macrotrends.net/1311/asset-price-bubbles-since-1976 Maybe there will be a big buying opportunity in the stock market soon.
That’s the impression I get.
My brother likes to say “cash is a position”.
P/E are high and earning are unsustainable. HY debt is in danger from oil price.
Interesting things said on twitter this weekend.
My brother’s feed:
@jeffcnyc
In The New Yorker:
http://www.newyorker.com/magazine/2014/12/22/low-can-oil-go
My wife is really impressed with quotes like these. If I’m on NPR, or the BBC (in January) or The New Yorker, then I must be cool. Oil & Gas Investor, Platts, Offshore or World Oil–well, that’s for nerds. But if I’m in the New York–or even better, British!–press, then I must be significant. (Anyone want to guess my wife’s ideological predilection? Now, if I could only become the oil markets consultant to Downton Abbey or film a special with Benedict Cumberbatch–then I’d know I’d made it.)
An analysis of Exxon’s 2015 Energy Outlook, supply-side only.
http://www.prienga.com/blog/2014/12/10/exxon-calls-peak-conventional-oil
I think this is actually a pretty good analysis of shale market dynamics.
Professor,
Great analysis, again!
Thanks for including the price of copper in your analysis. Gold would be more accurate but copper does represent what is happening with commodities. Gold is better because it is the link between the appreciating dollar and the declining price of commodities.
Jeffrey (and Steve) I also agree with your analysis but with a slightly different twist. The price of oil has blown through its point of balance with gold. Gold has stopped its significant decline but gold has dropped below much of the marginal cost of production for marginal producers. This is similar to what happened in the mid to late 1ate 1990s. Falling oil prices will constrain supply. Demand should be moderate to strong in 2015 so with a constrained supply the price should increase.
Watch the price of gold. An increase in the gold price will indicate currency pressures on the price of oil and a return to a price above $100 is probable. As Jeffrey notes Texas only accounts for about 3% of production, but because oil is denominated in dollars a change in the purchasing power of the dollar is amplified greater than WTI production.
I use the CRB: Raw Materials Index rather than the price of copper and it just broke through to new lows last week.
The y/y change in the CRB: Raw Materials Index has an 0.8 correlation with the year/year change in world industrial production.
This CRB index has given me numerous very timely buy-sell signals for oil.
It would be interesting to use iron ore as a control. It has been down approximately the same as oil, and fallen much more than copper. Fe 62 probably captures Chinese economic conditions better than copper.
True. “Dr Copper” earned his degree largely by being more of a homogeneous fungible commodity than any form of iron ore or steel. The iron and steel market is much more segmented. Only really within the last several years have you seen liquid enough spot and futures markets to closely track the price trend.
The industrial metals and oil are cratering for different reasons, and I sympathize to some extent with Steven though I think his and Bill McBride’s outlooks are too optimistic and too American-centered and not much shared around the world. We’re not the reliable sop of marginal oil supply we used to be, which is one reason why the price has to come down so far, to herd us back into the SUVs.
FWIW Michael Pettis, an econ professor at Peking University’s Guanghua School of Management says that much of the recent demand in commodity has been driven by large scale hording in China. He claims that there are huge mountains of various commodities stored in every major port city in China. Maybe because of distrust in the Chinese banking system or maybe just the natural materialism of communists or maybe, probably, something else but the Chinese prefer to store their wealth not in bank accounts but in hard assets. So the huge number of empty office buildings as well as mountains of commodities.
Specifically Pettis called the collapse of iron ore prices two years ago. At its peak, China was importing 60% of the iron ore mined. No one in history has ever came close to consuming this high of a % of global ore production, not the US post-WW2, not the UK in the middle of the 19th century. And in fact China was not consuming the ore, but hoarding it. And according to Pettis, for a variety of reasons (detailed in his blog and book) that hoarding is coming to a halt. The result is the end of the global commodity bubble.
Which means that the collapse of commodity price may not be tied to a slow down in global economy but to a change in the way the Chinese store their wealth.
However, I dont know if oil is a part of this. It’s recent price decline sure as hell looks like the other commodities. OTOH oil can not just be dumped on the ground in huge piles, its storage takes real capital. And China is under consuming oil for its GDP at the same time it was clearly over consuming iron ore, copper, cement, etc.
Jib
I have been curious about China and its steel production capacity since China went on its binge of building steel plants. I would say that China has been in great danger of severe over capacity. But that is not my question.
I am curious about the quoted statistic that China is importing 60% of world iron ore production. Since China already is by far the largest producer of iron ore, is it possible that the correct statement would have been that China consumes 60% of world iron ore, but not necessarily importing 60% of all iron ore? Adding China and Australia production account for about 60% between them.
Ed
Deflation in oil price is great. Everyone I know loves it. If only the CPI would deflate too.
There must be a better, more effective way to stimulate the economy than printing. People hate inflation.
ekim
“If only the CPI would deflate too.”
if cpi deflates, that would most likely indicate the economy is contracting. so while mild inflation has some harmful effects, do you think that is worse than deflation of the economy? the events of the past seven years gives you a real world experiment on the effects of deflation.
Note that the entire rise in inflation as reported in the CPI earlier this was entirely due to housing and healthcare.
the CPI for goods has been negative on a year-over-year basis for almost two years.
My brother joked about possible deflation next year, a couple of months ago.
I think there needs to be a distinction made though between price and asset value corrections and prolonged, drawn-out expectations of declining prices.
Equities are ridiculous right now. I wouldn’t be investing if I even had the money to.
jib
Answering my own question, yes China does account for 60% or so of all iron ore imports. However, domestic production dominates usage of iron ore, there and everywhere. Just looking at the export/import market, only Australia and Brazil could suffer extensive problems if price or size of export reduce.
Ed
JDH: How can the estimated coefficients in a reduced form equation estimating price inflation possibly be meaningful when there are no supply variables on the rhs? It would be fine if the estimation period were limited to a six month or shorter interval where supply could be assumed to be roughly constant. But supply was manifestly not constant for the period over which the equation is estimated. Thanks in advance for your thoughts on this. I hope to learn something.
JBH: I believe it’s reasonable to assume that weekly changes in these 3 variables are correlated with changes in global demand for oil but uncorrelated with changes in the global supply of oil.
JBH, it shows the demand vector and the supply vector is implied by the difference in the oil price.
It is important to keep track of what is the marginal source of oil.
In the early 1970s it was the North Slope and North Sea.
So oil had to rise far enough to make those sources worth developing.
Once those sunk cost had been committed they continued to produce oil even though prices were falling.
Now, the marginal source of oil is tight oil and the Canadian tar sands.
Oil prices have been high enough to lead to major investment in those sources.
Now that the sunk cost is in place they will continue to produce oil even though new investment will be unprofitable.
Good summary spencer. Politically inept producers such as Venezuela are also probably producing ‘on the margin’ so to speak but figuring out how resource-cursed petro-states will respond to crashing oil prices is another matter. Elites in resource-cursed petro-states tend to be believe that they can outwit price signals and free markets in general.
Canadian heavy oil projects are hard to turn around quickly but tight light oil projects are another matter. North American tight light oil projects can be stopped and started much faster. Add to the mix more stringent flaring restrictions in North Dakota and US tight oil production could slow relatively quickly.
My worry as an investor specialized in overseas junior and intermediate exploration companies is that tight oil extraction costs in North America have been coming down and will decrease even faster in response to this negative output price shock. Take a look at how North Americans have historically responded to open access rules in fishing, for example: more innovation, more public subsidies and more often than not fish stock collapse.
It will be interesting to see how the upstream sector fares in the second half of 2015.
Spencer,
Spot on! But if the price of oil falls below the cost of production not including capex the marginal producers cannot continue to produce.
JDH: How does the regression model fare when quarterly data is used in place of weekly data?
The regressors are not entirely exogenous but then I am not sure how to get around that problem.
Westslope: Don’t know, I didn’t try it.
Fair enough. JDH, your generous efforts and hard work are always appreciated.
Somehow I missed the Newey-West estimator in the past but caught up a little just now. It is a popular gmm/HAC estimator and in principle corrects for auto-correlation but not insufficient orthogonality between regressors.