A few weeks ago I offered some calculations suggesting that lower demand for oil might account for about $20/barrel of the dramatic decline in the price of oil since last summer. Here I point to some other evidence consistent with that conclusion.
Last week the IMF’s Rabah Arezki and Olivier Blanchard produced a very useful assessment of the role of supply and demand in the recent oil price decline. They note for example that the IEA’s current estimate of world oil demand growth for 2014:Q3 is 800,000 barrels/day below what the organization had been anticipating as of last June.

Source: IMFDirect.
The suddenness of this shift suggests that economic weakness in Europe, Japan, and China made a contribution. In the case of the United States, some of the long-run demand response to the price run-up of the 2000s is still underway, as seen for example in the continuing improvements in fuel economy of new cars sold in the U.S.

Average fuel economy of new passenger vehicles in miles per gallon (from EIA).
But Steve Kopits calls attention to Don Pickrell’s documentation of some important long-term trends in U.S. demand as well. The American population is aging, and older people drive less.
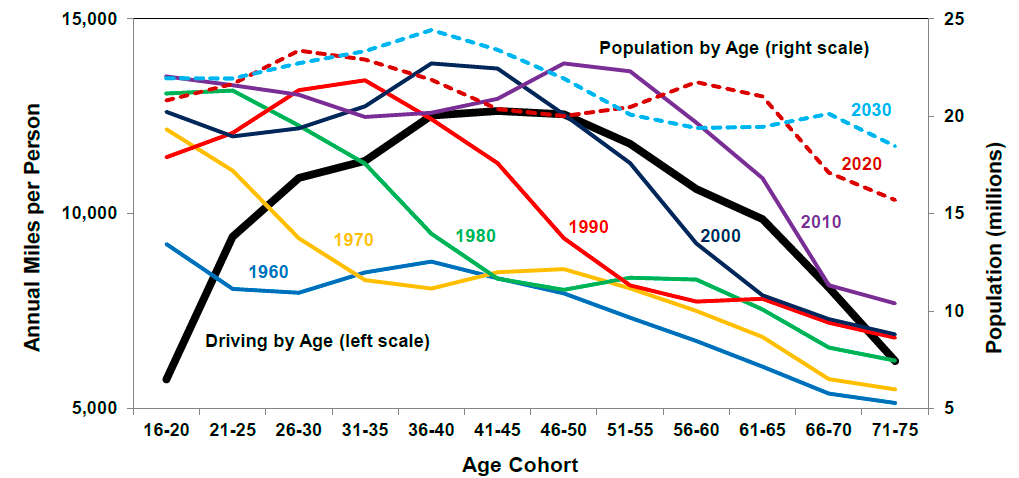
Source: Pickrell (2014).
In addition, people who don’t have jobs don’t drive as much. Much of the decline in the U.S. labor force participation rate seems due to long-run developments that were in evidence well before the Great Recession.
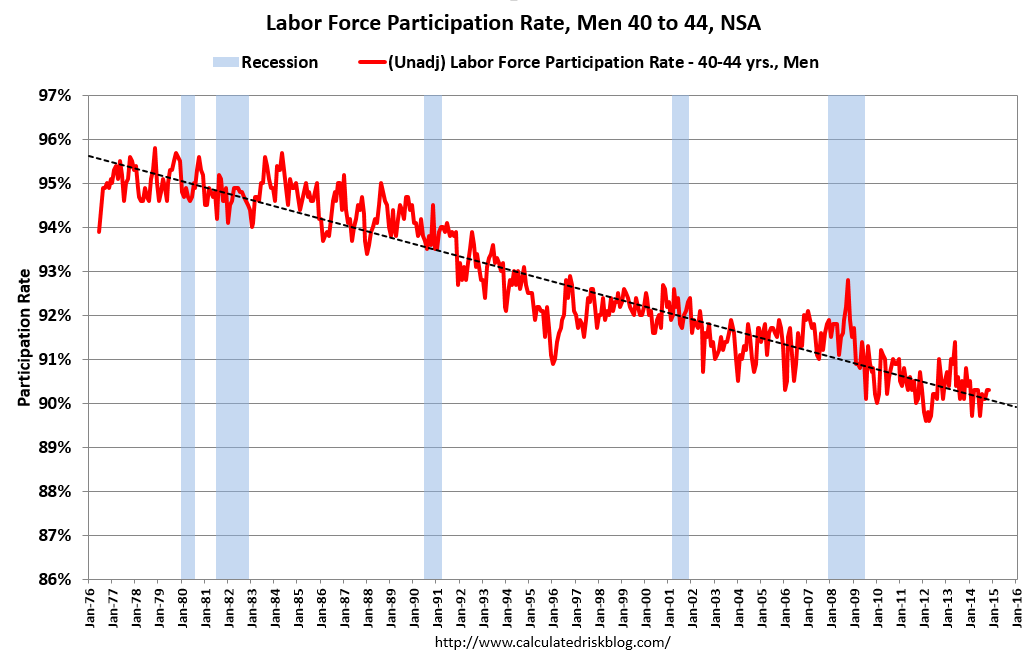
Source: Calculated Risk.
Another contributing factor to an excess supply of oil was a return of Libyan production between July and October. But the latest estimates are that some of this was lost again last month. And this weekend Libya’s largest oil port was attacked, raising the possibility that more of the country’s exports will again be disrupted.
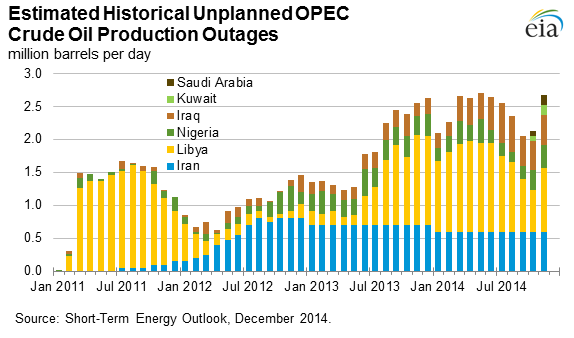
Source: EIA.
But the biggest factor in producing an excess supply of oil has been the success of the U.S. shale oil production. U.S. inventories are well above what’s expected for this time of year.
Source: EIA.
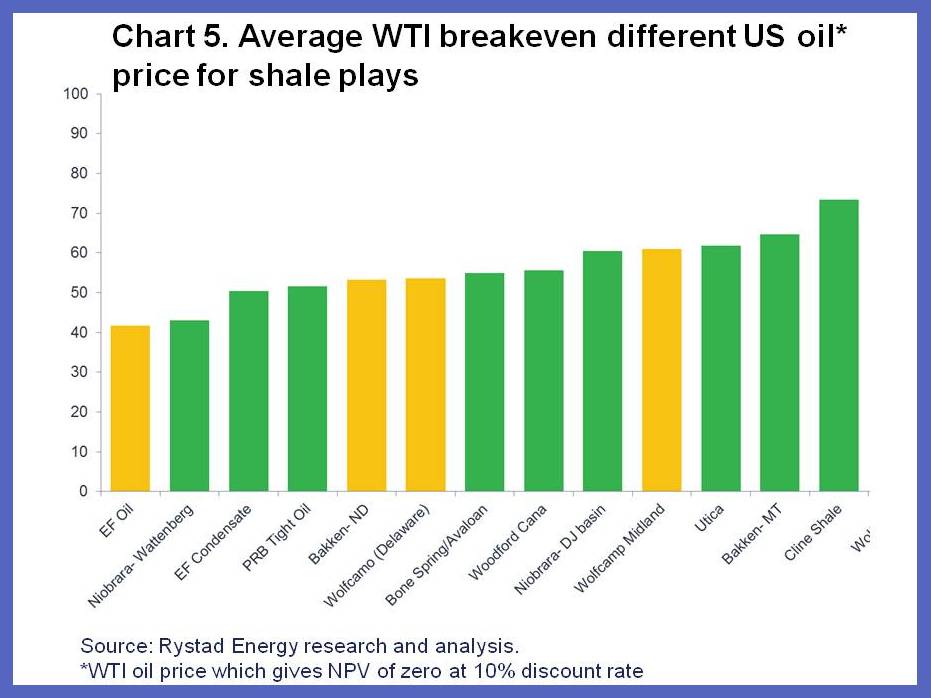
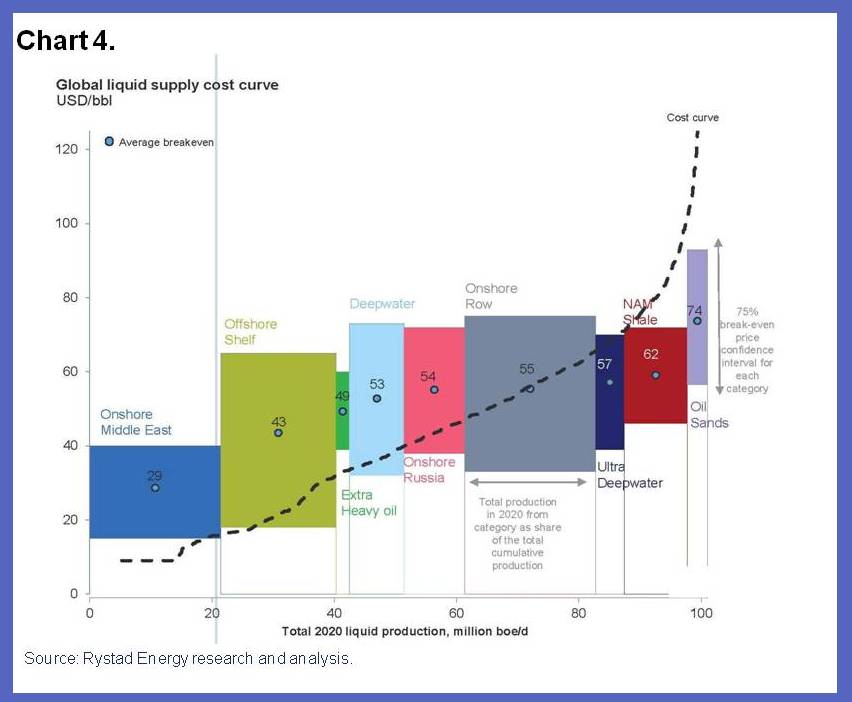
At what price would supply and demand be back in balance? I won’t even make an attempt to predict short-run developments for the wild cards like Libya, Iraq, and China. But in principle, the U.S. supply situation should be simpler. At current prices, some of the higher-cost producers will be forced out. It should be a textbook problem of finding the point on the marginal cost curve at which there’s an incentive for the marginal producer to meet desired demand; given a quantity Q demanded on the horizontal axis, find the price P associated with that Q from the height of the vertical axis on the marginal cost curve. The problem is, nobody knows for sure exactly what that marginal cost curve looks like, and sunk costs for existing wells make it hard (and painful for the oil producers) to find out.
Source: IMFDirect.
Longer term, I think we can anticipate ongoing geopolitical disruptions in Africa and the Middle East and a resumption of demand growth from emerging economies. That is why I believe that before long the world will once again want that higher-cost oil. But December 2014 doesn’t seem to be the time to try to sell it.
Source: IMFDirect.
Probably worth reading my article from the UAE’s National.
http://www.thenational.ae/business/energy/past-has-lessons-for-turbulent-oil-market
JDH Any theories as to why diesel prices have not fallen nearly as fast as gasoline and crude oil prices?
It’s that the hydro-carbon mix from Oil Shale doesn’t produce much, if any diesel.
Understanding Unconventional Oil
The conventional oils that dominated the twentieth century may differ from
one another in color, thickness, sulfur content, and other impurities, but
they are a relatively homogeneous lot, flowing from relatively easily accessible
deposits in limited locations around the world. The makeup and geography of
tomorrow’s oil, however, will be dramatically different from the black gold that
gushed forth at Spindletop, Texas, back in 1901.
Much of the new crude is low quality stuff with a lower energy content per barrel. There are no more Spindletops to be found.
I agree, and here is a chart showing how product yield varies with API gravity:
http://i1095.photobucket.com/albums/i475/westexas/Refineryyields_zps4ad928eb.png
Note that they describe 42 API gravity crude as “condensate,” whereas I would put the dividing line at about 45 APi gravity, but in any case, note the huge decline in distillate yield, just going from 39 to 42 API gravity.
And in my opinion, it’s very likely that actual global crude oil production (45 and lower API gravity crude oil) probably effectively peaked in 2005, while global natural gas production and associated liquids, condensate and natural gas liquids (NGL), have so far continued to increase.
Regarding oil prices, who knows what will happen going forward, but monthly Brent prices bottomed out at $40 in December, 2008, and monthly Brent prices rose at an annual rate of 33%/year from December, 2008 to December, 2011. However, by December, 2008, Saudi Arabia had already started cutting production, which does not seem to be a patter that they are currently emulating. However, Saudi net oil exports have been below their 2005 annual rate for eigtt straight years, through 2013.
The following char illustrates the normalized data for Saudi Arabia, from 2005 to 2012.
http://i1095.photobucket.com/albums/i475/westexas/Slide21_zps74c9ebac.jpg
Saudi 2012 total petroleum liquids production was slightly higher than 2005, but because of rising consumption, their net exports and ECI Ratio (Ratio of production to consumption) were both below their 2005 rate, for seven years through 2012, a pattern which continued in 2013.
Based on the 2005 to 2013 rate of decline in the Saudi ECI Ratio, I estimate that the Saudis have already shipped, through 2013, about 40% of their post-2005 CNE.
I suspect that the Saudis have been unwilling or unable (take your pick, more likely the latter in my opinion) to exceed their 2005 net export rate of 9.1 mbpd (million barrels per day), and they have been waiting for a decline in global demand, as an opportunity to maintain their production and net exports, as a way to curtail future production by high cost US tight/shale producers, and by high costs producers in mature producing areas like the North Sea.
However, in my opinion, that’s against a backdrop of a huge rate of depletion in remaining post-2005 Saudi CNE. There is one school of thought that the Saudis are very much aware of the ongoing rate of depletion in their post-2005 CNE, and they are acting now to curtail production from higher cost producers, as a way to increase the future selling price for their remaining CNE.
Saudi exports are collapsing as they are diversifying downstream via projects like Sadara, Satorp etc. Going into 2016 they should be down to 5mbpd, similar to 2009.
It’s not that hard to do some research on world pricing of crude versus API and sulfur content. And it’s kind of cool and interesting for someone with an micro bent. Papers have been written on it. You’ll find pretty quickly things like Tapas (44 API) selling at a premium to Brent (38 API).
http://www.aip.com.au/pricing/marketwatch.htm
Or like Arab 50 API oil selling in Asia (a distant market and subject to world competition) at a premium to Brent.
http://www.bloomberg.com/news/2014-05-04/saudi-aramco-raises-all-june-crude-price-differentials-to-u-s-.html (scroll down and not the “super light” grade)
Undoubtedly there is a point at which API gets too high and the crude has less value. There is some curve. Would be interesting to write about it. But also crudes that are too heavy are worth less (despite “having more energy”). The whole conceit though that 45 or 50 or even 55 API crude is dishwater, has no value, does not affect world supply-demand basis is just silly though.
Also, it’s very well reported the API quality of Bakken oil. Even the Eagle Ford, which has more condensate has been well reported. There are EAI estimates of the US composition of crude by API.
You could also then discuss regional differences and get into the effect of the export ban and differentials and the like and the very pretty teaching point on econ (supply demand impact of the regulation, transport costs, refinery differences, refinery switching ability, etc.).
P.s. I wonder why Hamilton allows you to just repeat the same flawed points and never disagrees with them or corrects them. The one that gets me the most is the “triangle of doom” which confuses a price-time trend with a P-Q curve. But this API grassy knoll stuff is up there too. If someone wants to debate the substitute capability of NGLs, fine. Very valid discussion. But 47 API versus 37 API? Puh-leeze.
CNE = Cumulative Net Exports for at given time period, e.g., post-2005 CNE
I think it’s because of the ratio of every barrel of crude is smaller for diesel so the demand is still higher. I’m speaking of the US because we don’t Refine nearly as much diesel as does Europe for example.
2slugs: for the same reason that premium hasn’t fallen as fast as regular.
I think the discussion of demand needs to go a lot deeper.
If we want to look at what aspects of the demand story might have started the drop in price, we need to go back before the recent demand downgrades. The story there is a slowdown in consumption growth in China, Europe and Japan (to below zero growth in the latter two).
If we want to look at why the price drop has been so steep, we need to look at why demand is still being downgraded despite the price drop. It’s important to understand that the IEA’s demand projections are simply consumption projections – that is, of supply plus or minus inventory change. The IEA isn’t projecting some sort of theoretical demand at some theoretical price. So demand projection downgrades amid a price drop are a very big deal. What the IEA is effectively saying is that, so far, the oil price drop appears to be destroying more demand than it’s creating.
One reason is that oil producers have become a major driver of oil consumption growth. When prices fall, they become more conservative in how they consume their own resources. The biggest recent consumption projection downgrades have been from Russia.
Also, many EMs cap prices of oil products, including such big net oil importers as China. In these countries, the drop in the oil price has not been passed on to consumers. Instead, governments are taking advantage of the oil price drop to reduce subsidy outlays.
James,
I keep thinking that Libyan oil-production figures are announced but I have yet to see data on Libyan exports, and it’s exports that would contribute to excess supply on the global market. Have you any information about Libyan oil exports? Are they really likely to have played a role in this ongoing fall in oil price?
What you do to track Libya exports is look at production data and subtract out the small, stable portion that’s domestically consumed. I don’t know any source that tracks recent export trends specifically, as the domestic consumption isn’t variable enough to bother.
Compare September-November production numbers included here: https://www.iea.org/oilmarketreport/omrpublic/currentreport/#Supply
… with June- August production numbers here: https://www.iea.org/oilmarketreport/reports/2014/0914/
Scroll down to the tables headlined “Opec crude production.” You should see a very big jump up in September, definitely big enough to trigger a price decline.
Of course this was previously shuttered production coming back on line. The real underlying driver of the current glut is increasing production in the US, some of which was until September temporarily masked by war in Libya. And some of the US output growth is still being masked by war in Libya, as output there is still a long way down from its old normal. Indeed Libyan production is declining again and who knows when it will fully recover.
You can see detailed annual data on domestic consumption here, but no more recent than 2012:
http://www.iea.org/statistics/statisticssearch/report/?country=LIBYA&product=oil&year=2012
Great blog post! Thanks to Steve Kopits for the valuable contribution.
So US energy intensity is lower, ~3.5%, perhaps low enough to reduce the probability of oil price shock-induced recession.
As the US still maintains the lowest excise taxes on gasoline and diesel among the rich-OECD countries, the unspoken, unpopular question is: will the USA increase excise taxes on gasoline and diesel? The timing is good and Obama can look like somebody who is serious about global climate change as opposed to someone who mouths populist platitudes.
As an investor I am very afraid of the US increasing excise taxes on fuel. My investment thesis continues to be predicated on the willingness of Americans to hurt their fellow citizens with low excise taxes and adventurous foreign policy.
Not to worry. Michigan is leading the way with new gasoline taxes which will be followed by other states. Michigan learned to never let an (oil price) crisis go to waste.
So long as it goes to actual roads, better engineering and construction, and enforcing proper loading of trucks, I’m all for it.
I think the probability of an oil shock is a function of oil spend as a percent of GDP. 4.25% is hard to take; 5.0% will put us in recession. So it’s a function of prices.
S.
I’m still waiting for a frank post from you that references your $100+ to stay comments and says “I was wrong”. In a very frank manner. This isn’t just some “gotcha”. I’m actually amazed that you don’t address it and instead run these posts that are either news articles
Or you try to shift the discussion to blame things on demand. Without even addressing your high prices here to stay article. And you have a HISTORY of underestimating US supply (way behind on the LTO) and of overplaying peaker concerns (e.g. Staniford’s analysis).
BTW, I see what went down as more proof that you don’t think with enough of a micro focus. That you are a trend follower rather than someone who looks at segments of supply and segments of demand.
What’s happening on the demand side is projection of a lower rate of increase in future demand. Not an overall drop in current demand (the simple volume-price curve proves that). Of course this goes hand in hand with increasing demand having some role in price increases of the past (not just “peak oil”, depletion, or 30 state by state charts of oil production volume versus time).
The impression I get is that when people are wrong they have learned simply to pretend that their previous prediction does not exist.
I have never been very persuaded by the explanations on oil offered by the Professor. Why did Oil go to 157? Why then did it drop in ’09, Saying that it was geo-politics has the fortunate property of not being quantifiable. So one can cite changes in geo-politics as a blanket excuse for increases and decreases without fear of easy contradiction.
The futures market doesn’t see 100+ oil systemically (e.g. 5 or 10 years out). Of course it didn’t see that when you wrote the 100-here-to-stay article, either.
You are right that US LTO is the marginal barrel. (And if you go back to 100+ it will explode. Forget the “fast decline” or the “running out of sweet spots” or the “debt financing” worries. It has already shown the ability to add 1-1.5 MM bpd/year, for several years. And it would continue. BTW, that pretty much makes systemic 100+ impossible.
I agree that we have to find out what the equilibrium is (And some time required). But it won’t be 100, not in real dollars.
Exercise: graph the futures curve versus time in real dollars. Interesting insights you can get…
I think we’ll see $100 oil again by H2 2016. I don’t know whether it will be sustained.
I think it’s fair to say, Nony, that shales have out-performed expectations. How sustainable is it, and at what price? That’s a good question. No one really knows right now. That’s why Saudi is not cutting production (actually, they are down a bit). We are clearly below marginal cost, and either the Saudis or the Russians could rebalance the market at closer to marginal cost (ie, $70-75 Brent). However, given the uncertainty around shales, we are in a period of price discovery. When the Saudis feel they know what marginal cost is, they may well cut production.
Did you read my UAE article? There’s a lot in there.
I did read it. Good stuff. You are my favorite peaker. Big hug.
Howeverz….when you say things like this…
“I think we’ll see $100 oil again by H2 2016. I don’t know whether it will be sustained.”
…I gotta take you on. Because who cares about an unsustained price? That’s second order market timer stuff. The debates about 100+ to stay and end of cheap oil and technology versus depletion and “scarcity rent” are at least hitting the heart of the matter.
I felt the UAE post also suffered some from the lack of fundamentals mindset. You go into too many twists of the snake (temporary glut, future shortage, etc.) Yes, it’s possible the system needs to cycle a little to fair into equilibrium, but there’s no way (or reason) to predict these double humped camels. And some reasonable reasons (futures market, investment economics) to think we might not have the a glut followed by a squeeze. Plus I don’t think SA gives a damn if the price goes too high occasionally (force me to eat that filet mignon!)
I think it’s a lot simpler to just sit pat and let the market work itself out. Who knows if we have a wiggle like you say or just work the glut off and recover to some equilibrium like the futures market shows.
It’s very hard to tell what the sustained price will be. I think it’s likely over $80, but how much over?
A price overshoot leads to recessions, per the Arab Spring. Right now, Saudi Arabia and the US are in a position to pressure the Russians and Iranians. However, if the dynamic reverses, then the pressure will be coming the other way. (hence this post: http://www.prienga.com/blog/2014/12/4/time-to-do-a-deal-in-ukraine)
So it does matter to Saudi Arabia if prices overshoot, but for political rather than economic reasons.
The point I’m trying to make in the UAE piece is that it is possible to balance the market if prices are materially off marginal cost. Saudi Arabia needs US production growth to come to around 800 kbpd (half recent levels) — not zero! So Saudi needs to slow, not stop, shales. At $57 Brent, the oil system is visibly beginning to crater. Now, a production cut of 5% (500 kbpd) should bring the price up 10-15%, to $65-75 / barrel, that is, still under marginal cost but closer to it. With such market dynamics, production growth would still be declining, but the pressure would be less acute, and OPEC revenues would rise. So that’s an option on the table. If you’re Saudi, you’re waiting for some data to come in to see if your marginal cost estimates are sound. Once you have those, you cut.
Frankly, such a strategy makes even more sense for the Russian. If I were them, I’d be taking a very hard look at making such a cut.
Yeah…I understood exactly what you were trying to say and my feedback is that you are too complicated. Sorry. I know you are a nice guy. And I’m glad that you got a trip to the ME and a client and all. There’s some decent insights in there. But I’m not going to pat you on the back completely. You get a little too cute. Too smart. And then make me worry about basic EMH.
If it is hard to even debate fundamental long term sustained prices, then what makes you think you can predict overcorrections? Not even a glut being worked off (which is what the futures market shows, slightly; or what someone like James who believes in long term high prices and scarcity rent would argue). Not only that (which is fine) but a swing to too high before (I guess finally) coming down to equilibrium.
I have a problem with that over-swing high prediction. I mean it might play out that way by chance. But I don’t see how you can predict a lack of drilling that allows a too high price in future, especially coming off of a current glut. It presupposes non-rational actions. After all if there is a prospect of 115+ prices, then drilling should commence (and thus prevent it) or the futures market should time-arbitrage it via current prices rising in anticipation and storage and such.
Basically I think you try to get too fancy and complicated. Think more about the fundamental micro. Ditch the crap like “supply constrained” and just go with P-Q classical curves. The econ 101 book does not have a section on “supply constrained” and “demand constrained”. It’s really bordering on not understanding the fundamentals themselves to invent terms like that. there is enough inside classical P-Q to be interesting. To get insights.
Sure there’s some places where there’s inelasticity. So what. That is just a slope. Sure there’s time dimensions of supply and demand response (the “drilling problem”, the energy efficient changeover of fleets). And sure there are endemic time aspects of supply (Adelman’s depletion versus technology battle) as well as in the demand curve (demographics, China, etc.) But you don’t need to invent a new term. “supply constrained”. Do better off by thinking more with a classical micro bent.
Had another comment in here. Not sure if it was moderated out in error or deliberately:
Basically, I would advise you to look at how the 5 year out futures have changed over time. They’re basically the market’s distilled guess on long term fundamentals. See how much they changed pre-post crash. I think it is much less drop than in the current price.
.
Then think about how YOUR estimates of the 5 year out futures have changed. Have they changed at all? (if no, that;s interesting but defend it) For instance are you ~92 (median of 85-100) now and were so previously? Or were you 112 before and now down to 92. In which case, perhaps you’ve had the same drop in viewpoint as the markets, but just off a different base.
I would leave all this “drop further perhaps, but then maybe shoot to too high and then come back” stuff out. No one can predict those sort of third order market wiggles.
Nony, I think the wiggles are relatively easy to predict right now.
But what’s the long run marginal cost of shale? Does Argentina, with a fantastic resource, get in the game? Does technology improve even further? Do they break the code in China? Does someone come up with a superior EOR technology that saves the North Sea’s bacon? I don’t know.
But yes, given the pace at which shale and other sources were able to expand at $100, right now that’s looking like a ceiling, not a floor. See my Exxon analysis, where I go into this in greater detail: http://www.prienga.com/blog/2014/12/10/exxon-calls-peak-conventional-oil
I agree that there is a lot of uncertainty about long term, for reasons you give. They are very Adelmanish. Heck, would you bet your ass we won’t do methane hydrates if we have to/want to a few decades from now? Who knows.
I don’t have an issue with the very FIRST WIGGLE. That’s basically just working off a “glut”. (Much as I hate that term.) Futures market sees it. James sees it. You see it. If the futures market has right ending spot, donno. Obviously you and James think it will be higher than futures market says. But in any case, all three see oil rising faster than inflation for next couple years. That, along with very obvious cutbacks in high cost drilling, sure look like working off a glut. That’s a wiggle I buy.
But predicting that we HAVE TO drill so little so that prices ripple again and go higher than the long term equilibrium? Why? It could happen by a mistake. But with perfect knowledge, it won’t happen. Heck, there’s reasons to think it fairs right in more or takes longer than it should to get back to higher LT equilibrium price. for one thing there’s some inertia to drilling programs and people like to drill and HBP and all that. So I have a problem with a confident prediction of a SECOND WIGGLE. That’s too much market timing for me.
Just read the Exxon Prienga piece.
Pretty good. Like the comparison to shale gas, GOM versus Marcellus, etc. Like the discussion of compettion versus conventional and DW. Like the OPEC discussion.
I think shale is more of a ceiling, too. It’s kind of earned that. People talked shale oil down all the way as it went up. Even people like Mark Papa (who now says he underpredicted growth). Of course that was all at 100+. And I really do think it can beat the Red Queen, can develop the Permian, even the TMS. At 100+. But not at 55. So it’s become its own limiter. It is the marginal barrel. That’s something pretty noteworthy.
But I don’t like the discussion of “carrying capacity” price. That sort of thing seems to show a lack of understanding of P-Q curves. There’s a curve for demand that goes past 100 in the USA. Cut supply and price will adjust to apportion the barrels to those with willingness to pay.
A supply-constrained approach is something new. Or rather, it is straight out of a micro textbook, one of the first chapters. You just never see it in real life. It’s very uncommon to see a supply-constrained commodity, especially one as closely linked to GDP growth as oil. The theory is standard stuff, essentially uninteresting. (Not so the Three Ideology Model. Nothing standard about that.)
Now, if you run a supply-constrained model, then there should be pent up demand, and you’d expect a big rebound in oil demand growth. By contrast, if you run a demand-constrained model, as does the IEA, you expect very modest oil demand growth. I think the IEA is showing demand up 0.8 mbpd in 2015. US oil consumption (product supplied) alone is up 1 mbpd for the week of Dec. 19, compared to the week of Dec 20 last year. It was running at 21 mbpd, not a number we have seen really since 2007, and on a sustained basis, since 2005. And that’s just the US, albeit, just one week’s data, and it may be muddied with hidden exports.
So the approach you use has a huge impact on your expectations on the demand side. It has huge implications for GDP growth. If you’re a demand-sider, there’s no compelling reason to think we’ll see exceptional US GDP growth, and the CBO’s modest 2014 pGDP line is probably right. We’re seeing fiscal consolidation, end of QE, prospects of interest rate increases–all contractionary. Why would we see 4%+ GDP growth? Why would secular stagnation go away? Now, if you run a supply-constrained model, high growth is exactly what you expect, and then the 2011 pGDP line is probably supportable, and maybe all the way back to the 2007 line if things go well.
And you’re looking for the next binding constraint. (Labor, maybe?)
So, a supply-constrained (or rotating binding constraint) model matters. Potentially quite a lot.
I anticipate a decline in US oil extraction to the sustainable (?), long-term average of 5-6MMbb/day by 2016-20 (and thereafter, IF we’re lucky), coincident with US recession (average 2- and 4-quarter real final sales of 0.6-1% to as low as negative 0.7-0.4%); little or no growth of nominal GDP over the period (and a decline in the post-2007 trend rate of nominal GDP to 2% and eventually slower); CPI decelerating below 1%; the 10-year yield averaging well below 2% (and eventually testing 1% or lower); claims and the U rate bottoming and rising in 2015-16; the US fiscal deficit increasing again, doubling by fiscal 2016; and the Fed resuming QEternity sometime in 2015 at a similar expansion of bank reserves as in 2009-14, at a minimum to fund the incremental increase in the deficit to prevent nominal GDP from contracting and price deflation from occurring along the way. (Read: Japan, whether we want to admit it or not.)
Effectively, the US and Canada have achieved “energy independence” but at a price of oil extraction we cannot afford in order to extract and burn at a long-term demand regime, which is significantly lower per capita than what is perceived today through 2020-25.
That is to say, we have de facto achieved “energy independence” in terms of deep, tight, and tar “oil”, but we can’t afford it in order to sustain the oil-, auto-, debt-, and suburban housing-based economic model.
Further, this means we cannot afford to build out in fossil fuel terms per capita so-called “renewables” at the necessary rate and scale (net energetic/exergetic terms per capita) while simultaneously growing real GDP/final sales per capita AND sustain the existing fossil fuel infrastructure.
QEternity by the Fed since 2009 was intended to liquefy the insolvent banking system, permit levering up 50-80:1 banking system capital to equity index futures via offshore shadow banks’ dark pools’ pass-through entities utilizing exchange-sponsored high-frequency trading algobots, and fund fiscal deficits to prevent a contraction of nominal GDP and overall prices.
Hereafter, QEternity II will be primarily to fund fiscal deficits, i.e., “monetization”, in the absence of sufficient net private savings (ex equities) to gov’t receipts and to GDP, as has been the case in Japan since 1998-2003. Keynesian fiscal deficit spending will provide no net multiplier to GDP hereafter. Rather, deficit spending will go primarily to no-multiplier income supports for the poor and elderly, including spending for unemployment and disability payments, food stamps, Social Security, Medicare, Medicaid (for Obamacare), Supplemental Security Income for low-income elders, and making good on shortfalls in veteran and state and federal public employee pension and benefit payouts (while it is possible) for peak Boomers.
This supports Peak Oil, “Limits to Growth”, end of perpetual growth of population and resource consumption per capita on a finite planet, and the end of capitalism (as we have come to know it and extrapolate its perpetual continuance, despite the Marxian implications). Therefore, by extension, we can anticipate the end of the Anglo-American imperial trade regime, i.e. “globalization”, which in turn implies that China-Asia’s growth regime is over, i.e., China, India, and the rest of the world is 40-80+ years too late to the oil-, auto-, debt-, and suburban housing-based model of “growth” and “development”. The top 0.01-0.1% to 1% western (and FDI-funded Asian) elites have no historical precedent for what is likely to follow, apart from the post-Roman Empire’s Medieval “Dark Age” (which was comparatively otherwise for the Islamic world).
..end of perpetual growth of population and resource consumption per capita on a finite planet,….
___________________________________________________________________________
Growth is dependent on only one thing energy. Hydrocarbons are only one form of energy. Nuclear power from Thorium is vastly more sustainable than hydrocarbons, no matter your perspective on Global Warming.
………………………………………………………………………………………………………………..
China, India, and the rest of the world is 40-80+ years too late to the oil-, auto-, debt-, and suburban housing-based model of “growth” and “development”.
__________________________________________________________________________________
This is a defeatist position that in truth have nothing to do with reality, unless we ignore the possibilities that we have before us today.
We have enough resources in the solar system for 1,000,000,000 X the GDP of today.
We have enough energy in Thorium, and eventually fusion, to power our civilization for a million years….
Quit feeding at the bar of the false limits to growth…
Shouldn’t we include resources in other solar systems and galaxies?
It’s all just supply and demand ?
Wow. Demand collapsed at just the time when we wanted to punish our enemies – like Russia , Iran , and Venezuela – with economic sanctions and such. Falling oil prices will act like superchargers on those sanctions.
This country is truly blessed with good fortune. I’m sure glad I can now safely disregard any concerns I had that , back in Sept. , the U.S. may have colluded with the Saudis to drive down oil prices :
http://www.theguardian.com/business/economics-blog/2014/nov/09/us-iran-russia-oil-prices-shale
You misunderstand the history. In the mid-1980s the US and others were boosting production, and the Saudis tried to support the price by leading Opec to agree on cuts. But most of the rest of Opec cheated, and the Saudis and some other Gulf Arab producers found themselves progressively cutting while the high prices only supported more US and other production. So from 1985 the Saudis switched tack and boosted production, killing the price. How much the desire to hurt Iran and the Soviet Union played into that decision isn’t really clear.
Since then, the Saudis and other Gulf Arab producers have been more reluctant to cut, as they know the rest of Opec (and even Iraq) won’t go along, and they learned in the 1980s that cutting their output to defend the price from others’ rising production only supports more of those others’ production. They have only made production cuts during episodes of obvious weak demand.
Neither the Saudis nor any other Gulf producers significantly increased production this year. All they did was decline to cut. Trying to paint them as the protagonists of this price drop is ludicrous.
If the Arabs wanted to, they could offer us oil at 10$ a barrel……………
Do not tell that James, he just realized that 100+ USD oil is NOT here to stay …
An important point to keep in mind is that Eastern Canada imports a lot of oil, so Canada’s overall 2013 net exports were only 1.7 mbpd (total petroleum liquids + other liquids, EIA). Based on the most recent four week running average data, the EIA shows that US net crude oil imports are running at about 7.2 mbpd (44% of the crude oil processed daily in US refineries), while total liquids net imports–after accounting for biofuels production, refinery gains and product exports–are running at about 5.8 mbpd.
Mexico’s net exports in 2013 were 0.78 mbpd, so combined net exports from Canada + Mexico in 2013 were only 2.5 mbpd, which would only be 43% of current total liquids net imports.
Overall Western Hemisphere net exports, from the major net oil exporters in 2004*, fell from 5.9 mbpd in 2004 to 5.2 mbpd in 2013. Therefor, total 2013 net exports from the (2004) seven major Western Hemisphere net exporters would not be sufficient to meet current US total liquids net import demand.
*Canada, Mexico, Venezuela, Colombia, Ecuador, Argentina, Trinidad & Tobago
Yes, in the long run, North American demand will “catch down” to costlier supply that we can’t afford to extract and burn and maintain the current real GDP per capita, let alone grow it.
At the post-2000 and -2007 decelerating trend rates of real final sales per capita, the US and EZ will be where Japan is today by the early to mid-2020s, with a 30-35% loss of real growth that otherwise would have occurred had the long-term rate of growth continued after 2000.
In effect, a loss of real growth on the order of that which occurred quickly in 1893-98 and 1930-33/1937-41 will occur over 20-25 years this time around, i.e., a “slow-motion depression”.
Dennis, it is unquestionably a fact that there is seemingly infinite energy available in the solar system, but you are apparently ignoring the energy cost of obtaining the energy and the necessary scale to permit the further growth of obtaining the energy and of the underlying economy. The US and EZ ceased growing in terms of real final sales per capita 6-7 years ago, as did Japan 15-16 years ago, including no net new full-time private sector employment growth per capita in 30-35 years.
Moreover, not only are we facing an energetic/net energy constraint per capita to keep the current costly, complex, high-tech economy and civilization intact and growing, we have a planetary/systemic exergetic constraint along with limit bound constraints from loss of arable land, aquifers, forests, fisheries, etc., resulting from human population in deep overshoot conditions.
The overwhelming majority of the population do not understand Peak Oil, “Limits to Growth”, or population overshoot. Therefore, most of us will not understand Jeffrey’s net export idea, and especially not in terms of relative change rates and the implications. The Wall St., CEO, academic, and political elites and opinion-shaping mass-media influentials have little or no incentive to inform us, as it would risk the Establishment principals and well-crafted consensus narrative losing credibility, legitimacy to rule, and the elites’ privilege, status, and power. It’s easier and less costly not to inform us properly in order to maintain business as usual as long as possible.
Even among those who are well informed, most will conclude that their positions are sufficiently at risk that to act to inform the masses would endanger their reputations, careers, and socioeconomic status, which is a practical reality and a choice one must make. A large majority will choose not to risk their positions, understandably.
Thanks Tom.
As of the other day export volume would be negative, I bet.
“The suddenness of this shift suggests that economic weakness in Europe, Japan, and China made a contribution.”
Maybe. It’s a point…to an extent. But a weak one.
A. Demand has not fallen off a cliff (in terms of current volume).
B. We are not seeing a clear contraction or recession like in 2008-2009. Kopits makes this point as well. Sure, Japan is down. But Europe is just status quo. And US is up. China may be popping a bubble. But it’s still not a clear recession signal.
C. We’ve had some crappy economic signals over the last 4 years, without this big plunge.
D. There was a HUGE drop at the OPEC meeting. Clearly some amount of price support was based on the chance (even say 50%) that OPEC would intervene. When they didn’t, it was an immediate haircut. This is a much easier to attribute effect than your point above.
E. Later in the article, you point to Kopitz demographics and user behavior patterns on US driving. Yet, this is clearly a very slow moving train and completely evident to the market. So it doesn’t support “suddenness”.
F. While the US LTO supply increase is gradual, yes, what may have changed is the view on future capacity for growth. IOW, US LTO is NOT a blip that will go away soon (at 100/bbl) and in fact has the capacity to keep up with world growth (at 100/bbl). A year after year extra million BPD has that impact like a repeated hammer hitting. (and don’t completely discount NGLs…they are not perfect subsitutes, but they go into refineries…there is some impact from them also…and they are very substantial also). In fact, if you (and others) are now saying that US LTO has the capacity to keep up with demand growth (which is basically implicit in considering it the marginal production) than this is a very different viewpoint from the past. It basically means that 100+ CAN’T be the systemic paradigm. And instead we need to work down to something south of that where US LTO is price-constrained. [And right now the futures market thinks that is ~65 a couple years from now, with less than inflation rise in price after.] This realization (of how the paradigm had shifted) could have been an eventual and sudden market shift. Not so much the production itself, which was gradual.
G. Markets are funny things. When the dotcom bubble crashed it was fast, but the seeds of it crashing had been there for years.
Nony, one should not underestimate the effect of the increasing financialization of the commodities market (as well as virtually every aspect of human existence since the 1980s). The unwinding of levered long positions in the oil futures market is a story that has yet to be told, as occurred in 2008-09.
My hint for you : could it be that the oil price is not that related to supply/demand – as James et. al. want to convince us ?
BTW, who are you Nony ? You have lots of insider know how …
I know wind, solar, storage, etc are still tiny, as % global therm consumption, but, as an amateur, I get the impression that these sources are already competitive with the most $ petro sources, and are close to competitive with high cost petro
Are Petro company C suite execs, signing off on multi billion dollar capital expenditures, thinking about this ?
PS: black swans do happen; every 50 years or so there will be a perfect geopolitical petro storm, so lets not go overboard on the CIA/saudi anti Russia conspiracy stuff (not to mention the wierd stuff floating, around, like one email i got saying the fall in oil was engineered by Putin to hurt the US…(!))
No, wind and solar are nowhere near competitive with hydrocarbon fuels. They depend on subsidies, usually in the form of publicly mandated tariffs, though solar has some unsubsidized consumers willing to pay its premium because it can be installed where power is consumed without generating local pollution. Some misleading comparisons show solar power nearly cost-competitive with natural gas by comparing solar to peaking power plants, the most expensive and valuable kind. Solar and wind power are less commercially valuable than base load power, with the gap depending on the consistency of sun or wind in the given location.
Of course marrying wind or solar with storage could potentially make them into reliable base load or even peaking power sources, but that’s also nowhere near commercially competitive.
tom, and hydrocarbons don’t receive subsidies? oil in shipping lanes protected by us carriers? us troops in the middle east for nation building, right? carbon pollution free of charge? you think these events are free? hydrocarbons are very much subsidized.
Actually I agree those are subsidies, though it’s hard to estimate their value. Everything we do is in the same sense subsidized by defense spending, though there’s an obvious priority to oil. Likewise solar and wind have environmental damage costs that are hard to value, amplified by their low EROEI. Indeed the solar panel fabrication industry is still consuming more energy than installed solar panels are producing. A lot of panels get installed in sun-poor locations, and a lot get junked without being installed or without exhausting their useful life. So far solar has increased not decreased our dependence on hydrocarbons.
We had this discussion before:
In Germany (no nuclaer weapons programs) nuclear got 200 billion EUR, coal almost 400 billion EUR, REs until now 120 billion, until 2030 I guess around 350-400 billion, so your argument in re subsidies is nonsense.
“Indeed the solar panel fabrication industry is still consuming more energy than installed solar panels are producing.”
Sorry, try to understand that the energy payback time of PV panels is less than 2 years in Germany, even shorter in the USA, therefore, we have a sustainable exponential production with a doubling each 4 years, i.e. from 1% to 64% in less than 30 years.
I am not an economist – It seems to me two “expensive” technologies -1) shale oil in the U.S. 2) renewable in Germany have in both countries combined to create jobs and synergisticly strengthen their economies and simultaneously reduced demand for imported oil thus forcing oil prices down by removing two major customers from the international market – tell me what I got wrong.
Interesting chart showing total new vehicle sales globally through 2013:
http://www.statista.com/statistics/262747/worldwide-automobile-production-since-2000/
Apparently, the estimate for 2014 is for around 90 million new vehicles (1.7 million per week). Note the difference between 2007/2008 and 2013/2014. One estimate I heard it the net increase in new vehicles globally (net being new sales less vehicles scrapped) is running at about one million net new vehicles per week globally.
Oil price will up again, just because of low of supply and demand, some higher cost oil producers will exit the industry some player will reduce the rig counts and investment in new fields. Now th eonly question how to use this low oil price in investment decision making- the answers rathet obviuos to buy the oil producers wich will survive the low oil price period and are trading at very cheap valuation levels. One of example big Russian oil companies like LUKOIL, ROSNEFT…GAZPROMNEFT and other..
http://prudentvalueinvestor.blogspot.com/2014/12/buy-russian-stocks.html