Global temperatures in 2014, that is.
Source: NOAA.
Update, 1/17, 12:45PM Pacific: Since Rick Stryker has asked for statistical significance, but is apparently unable to do statistical testing on his/her own, I will spend some time walking through a quick check.
- Download annual data on plotted anomaly, http://www.ncdc.noaa.gov/monitoring-references/faq/anomalies.php
- Test for unit root, allowing for constant and trend. You will reject the no unit root null using most versions of the DF test, over entire 1880-2014 sample.
- Find the break with the associated lowest p-value/highest significance level in constant, time trend specification; I obtain 1944.
- Test for unit root, allowing for constant and trend. You will reject the no unit root null using most versions of the DF test, 1944-2014 sample. You will reject the null, again.
- Run a regression of anomaly on constant, time trend; use HAC robust standard errors. I obtain a trend coefficient of 0.01, standard error of 0.001, t-stat for null beta=0 of 9.89.
In my book, that’s enough to reject the null zero-trend hypothesis.
But then, again, Rick Stryker believes 500,000 jobs/month is a typical job creation rate in a recovery!!!! Not true even when one normalizes for labor force, as discussed here. Here’s the rule: When Rick writes, prepare to laugh, and laugh and laugh!!!
Update, 6:45PM: Here is an animation, from that crazy publication, Bloomberg.
But … but …. but … Hiatus! Argle-bargle.
Might want to check some “other” experts:
“Scientists balk at ‘hottest year’ claims: Ignores Satellites showing 18 Year ‘Pause’ – ‘We are arguing over the significance of hundredths of a degree’ – The ‘Pause’ continues”
http://www.climatedepot.com/2015/01/16/scientists-balk-at-hottest-year-claims-we-are-arguing-over-the-significance-of-hundredths-of-a-degree-the-pause-continues/
Dave: Ever wonder who funds ClimateDepot? Ever wonder who CFACT is? Ever wonder what “Donors Trust”, that provides a large chunk of CFACT’s funding, is? Ever wonder who provides the funds to Donors Trust?
On the other hand, I know who funds (for now — who knows with the new Congress) NOAA. And I know who funds my blogging activity (me!).
NOAA is funded by people who have the power of taxation.
The Board and staff of CFACT are listed on the site. Its advisory broad includes faculty from Yale, Harvard, other academic and research institutions, and of course, my friend, the wonderfully eccentric Lord Monckton.
http://www.cfact.org/about/cfact-board-of-advisors/
Steven Kopits: I didn’t ask who advised (and remember, they don’t have to take the advice…). I asked who funded.
We can talk politics (i.e., funding source) or we can talk data analysis. Which do you prefer?
You lost me at Lord Monckton.
The satellite data shows no record. And neither does the surface data once you account for the size of the error bars. The literature shows that we are not particularly warm compared to the MWP and Holocene Optimum. There is no empirical evidence to support the AGW hypothesis and the models based on it show the greatest divergence to this point.
You are merely quoting a political propaganda site. What about you show me the data analyses of the surface temperature by other climate science experts, which come to substantially different results than the NOAA or NASA analyses?
In the last twenty years, the slope is 1.3 deg C per century.
In the last 16 years, the slope is 0.5 deg C per century, UAH satellite data.
I can live with that.
steven, i’m sure your potential grandkids will be happy about your concern for their future.
Temperatures have risen as much from the time of my grandparents.
In New Jersey, I’d like it warmer.
steven, so because your grandparents engaged in what we have come to realize is stupid policy, that makes it ok for the current generation to continue to engage in stupid policy and actions? on the other hand, global sea levels which swamp new jersey may not be so bad after all.
“I can live with that.”
MMMMM? If you are wrong will you go live on a Pacific atoll that is 3 meters above sea level?
If the folks deigning global warming are wrong is there a sufficient punishment that those affected can administer?
If the folks promoting the idea of global warming are wrong what should be done with them?
Silly-billy Dilbert – no one is going to be punished. And not much is going to be done. Check current oil prices.
Let’s buy inflatable boats for islanders and provide sniveling rooms – a cross between a Christian Science reading room and an AA meeting – for pious eco-freaks and liberals of all five sexes. A place to moan and hold each other’s soft moist hands. Like a faculty lounge at Harvard?
Kopits is so obviously right at the moment that everyone should go to his blog – truly on target.
Steven
Perhaps you could cherry pick a period with a negative trend for us? That we we’d all be even more assured.
Steven
Perhaps you could cherry pick a period with a completely level trend for us, just to keep things completely reassuring.
You might also want to mull for a while on the idiocy of extrapolating linear fits from the temperature response of a fundamentally nonlinear system.
Steven Kopits:
“In the last 16 years, the slope is 0.5 deg C per century, UAH satellite data.”
And in the period from 1991 to 2007, it was 2.65 deg. C per century in the UAH data. Both is non-consequential with respect to the temperature trend over multiple decades.
Why is the surface data different than the rss data from satellites? Additionally, what is the margin of error of the surface data? If the margin of error is greater than a few hundredths of a degree then this isn’t the hottest year, statistically speaking of course.
Mike The NOAA chart is not surface data, it is surface and ocean data. It takes a lot of energy to warm the oceans, so when you see the combined surface and ocean temperatures increasing, then you should worry. Also, satellite data accurately measures the least relevant latitudes, so you need to take that into account. When looking at temperature data it’s all about location, location, location.
Steven Kopits In New Jersey, I’d like it warmer.
Of course, unless you can curb your enthusiasm for fossil fuels much of New Jersey will be under water before your grandchildren leave this earth. Downtown Miami already is. And you should know that global warming does not mean the difference between a slightly chilly 65 degree day in April versus a more comfortable 70 degree day. Global warming means the difference between a 95 degree summer day along the (now relocated) Boardwalk and a 122 degree summer day. It also means a lot of countries cease to exist; e.g., Bangladesh and a fair chunk of the Indian subcontinent. Say good-bye to Hong Kong. Do you really believe those countries will just quietly slip into oblivion without a fight? There’s a reason the Pentagon believes wars from global warming will occupy much of our attention towards the end of the century.
My government funded experts predicted an ice age not too long ago.
That is total BS and has been debunked hundreds of times. What do you have as proof of your BS. Two articles from Time or Newsweek? That is it. Why do you repeat this lie?
Lynden, it’s not been debunked just responded to with animosity and denial. Where, per chance, did Newsweek get that impression?
You see consumer confidence, Slugs? Three months of low oil prices, and America thinks it has a future. Think we ought to get rid of fracking?
yes. and replace it with alternative energy methods. why continue to rely on a fossil fuel that has led to many wars throughout the world over the past century?
From where do we get all of this “alternative energy?”. Its simply uneconomic (or under economic). Do you know how much coal it takes to manufacture a wind turbine? Right now, the wind farms are drawing power from the grid to keep warm (fed primarily by coal). Call me when renewables exceed 20% of the US energy mix
ARGO is the system of floats for sea temperatures and they are even younger than the satellite data. The SST is notoriously sparse for this span of time.
The only latitudes the satellites don’t measure well are the arctic, i.e. where nobody lives. Hardly the most important latitudes and also a relatively small proportion of the earth’s surface area.
You are right that it’s location, location, location, and so the temperatures should be compared on a regional level, taking into account sparsity and quality of data.
2slugbaits,
Thanks for the thoughtful response, however, you didn’t address either question. If I recall correctly, satellites are the preferred data source as they are more accurate than a system of sparse and out dated surface units and sea buoys.
That’s good news. Far fewer deaths from cold weather. Longer growing seasons in the northern hemisphere. Potential greening of the Sahara region. All consistent with global warming.
To date, fossil fuels have benefited mankind to a great degree. Increased use of fossil fuels positively correlates with quality of life and overall longevity. If you prefer to burn yak dung for warmth, you will be worse off for sure:
http://www.medicalnewstoday.com/articles/288144.php
Actually, it means shorter effective growing seasons because plant growth slows after 86 degrees F and shuts down entirely when temps hit the mid-90s. It’s a bit counter-intuitive, but read the literature. And it also means more deaths from heat. Like a lot of folks, you need to get beyond this idea that a warming of (say) 4 or 5 degrees Celsius simply means a few more days when you can play golf. Global warming of that magnitude (which is well within standard confidence intervals) means that the bottom third of the US will see summer temperatures roughly comparable to what Saudi Arabia sees today. Of course, the Canadians might do fairly well under global warming. Maybe that’s why the Canucks are so keen on Keystone.
Too many people believe they’re more important than they really are, particularly politicians.
According to the “record” the coldest temperatures were around 1910. What does that mean? Was it ever colder? Scientists say there were many ice ages in the past much colder than the instrumental “record” (perhaps their funding was not ideologically pure?). Were there any periods warmer? (Hint: Medieval Warm Period). In general if the earth’s temperatures fluctuate between ice ages and warm periods (interglacials) then there must be some maximum warm period prior to the plunge into the next ice age. Have we reached it and are supposed to be declining? Are we still warming to the maximum? Is this the warmest interglacial? Will there never be another ice age and corresponding decline in temperatures?
To sum up, yes this may be the hottest temperature in the instrumental record. That does not mean it is the hottest temperature with life. It also does not mean temperatures should be constant. It also doesn’t mean that warming is catastrophic.
Tom,
Just to clarify. So you are saying, as long as the global warming stays in a range where at least one form of life can exist, there won’t be any need to worry for humankind?
All the question you ask in the paragraph before have been researched for decades or longer now, and there are many scientific publications about it. So, there is no reason to pretend these were all just open, unanswered question.
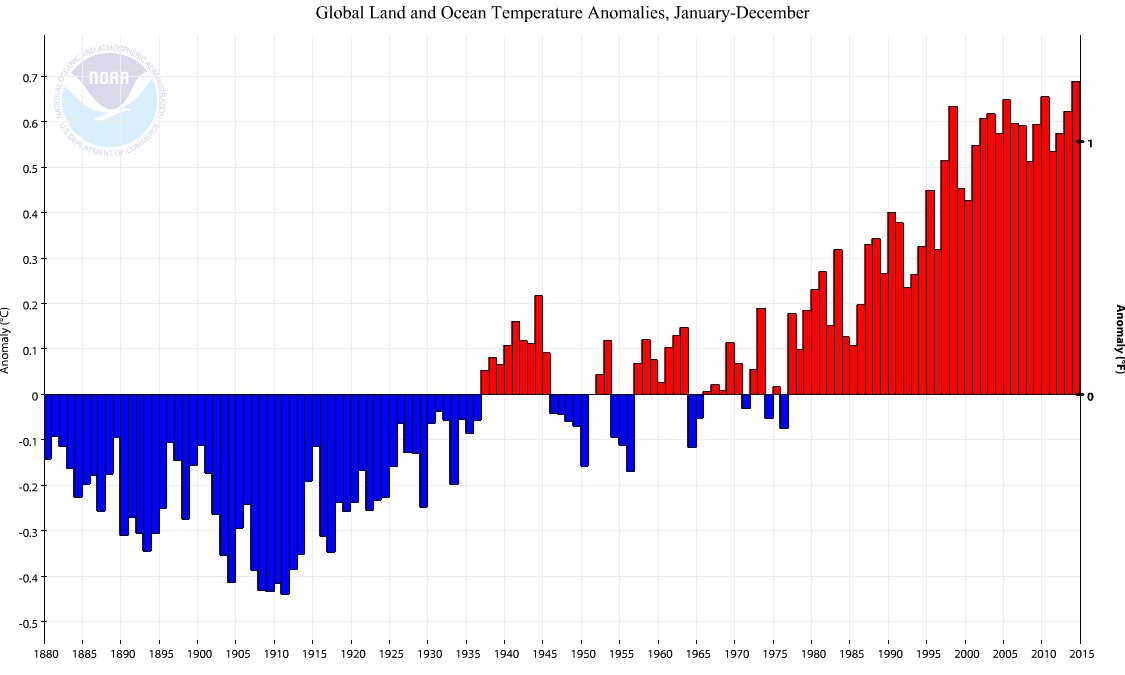
Yikes. The fabled 17 year pause in temperature is now over.
In 1998, the temperature anomaly was 0.63C. In 2005 and 2010 it was 0.65C. But now in 2014, it’s 0.69C, 0.04C higher!. Oh my lord–it’s Hot Hot Hot.
I just hope the skeptics haven’t delayed the necessary tax increases and additional government regulation for so long that it’s too late to save the planet.
Rick Stryker: Since you mention statistical significance, but are apparently unable to do statistical testing on your own, I will spend some time walking through a quick check of the trend, which is critical.
Download annual data on plotted anomaly, http://www.ncdc.noaa.gov/monitoring-references/faq/anomalies.php
Test for unit root, allowing for constant and trend. You will reject the no unit root null using most versions of the DF test, over entire 1880-2014 sample.
Find the break with the associated lowest p-value/highest significance level in constant, time trend specification; I obtain 1944.
Test for unit root, allowing for constant and trend. You will reject the no unit root null using most versions of the DF test, 1944-2014 sample. You will reject the null, again.
Run a regression of anomaly on constant, time trend; use HAC robust standard errors. I obtain a trend coefficient of 0.01, standard error of 0.001, t-stat for null beta=0 of 9.89.
In my book, that’s enough to reject the null zero-trend hypothesis.
But then, again, you believe 500,000 jobs/month is a typical job creation rate in a recovery!!!! Not true even when one normalizes for labor force, as discussed here. Here’s the rule: When Rick writes, prepare to laugh, and laugh and laugh!!!
Menzie,
Who said there was a zero trend? It’s obvious by looking at the chart that there is a clear trend. You illustrate that old adage: to a man with a hammer everything looks like a nail, or in your case, to a man with Eviews everything looks like a unit root analysis. I didn’t ask for a unit root analysis. I can download data and stick it into a statistical package too. I asked a different question.
My question was that given that 2014 is only 0.04C higher than 2005 and given the obvious variability of the data, can we really say that 2014 is the highest temperature on record? Has the pause in the temperature increase really ended? You recoiled from answering my question but I’ll answer it for you.
You don’t really need to do any statistical analysis to answer this question. Reading climate reports is like buying a used car at Boris’s Used Car Superstore here in Frostbite Falls, Moosylvania (conveniently located next to Wossamotta U). If you hear a suspicious knock under the hood you are not being unduly skeptical to take your suspicions seriously and you’d be wise to read the fine print. The same is true of climate reports. The NOOA claims in its headline that “The year 2014 was the warmest year across global land and ocean surfaces since records began in 1880” but if you skip down to the table in the fine print, you can see that the 2014 temperature anomaly of 0.69C is reported with a 95% confidence interval of +-0.09C, which is already a good bit larger than the 0.04C difference between 2005 and 2014. Dropping down that page further to the even finer print Probabilities related to 2014’s historical ranking, you find that the NOOA estimates the probability that 2014 was the warmest on record, given the uncertainties in the measurements, to be only 48%. Thus, in the NOOA’s own classification scheme, the assertion that 2014 is the hottest year on record is “more unlikely than likely.”
That’s good news for me. I can turn off the air conditioning, put on some proper winter clothing, and stop listening to this.
You keep wanting to return to the controversies of the 2012 campaign, but I’ve moved on. I think it’s time to look at a fresh new candidate for 2016. I’m sure he’ll make some statements that you will unfairly attack and that I’ll need to defend.
Rick Stryker: Who’s NOOA?
National Oceanic Obfuscation Administration
Rick Stryker: So I can put you down in the camp that agrees that global warming is occurring? I want to make sure I have your position clearly stated.
Menzie, why the strawman argument? “So I can put you down in the camp that agrees that global warming is occurring?” Those who do not agree that the Globe is warming. What is and always has been the questions is how much is caused by man’s efforts? Answer that without error and win a Nobel.
Menzie,
If you look at my past comments on this topic, you’ll see that I don’t deny that global warming is occurring. I also do not deny that at least some of it is man-made. The greenhouse effect is of course real. The question has always been how much the temperature is really going up in the long term and how much it matters. The climate is a complex system in which positive feedback accentuates the greenhouse effect and negative feedback reduces it. I am skeptical of global warming alarmism, which is based on complex and unverifiable climate simulation models that assume positive feedback effect along with the speculation people engage in about the consequences of those allegedly higher temperatures. But is the temperature rising over the next 100 years? Yes, very likely it is. Will it matter? No one really knows at this point.
Just as in the case of the latest NOAA report, when you look carefully into the various claims of the alarmists, there is usually much less to it than you’d think from the headlines. Why the conflict between headlines and the actual claims and evidence? I don’t believe there is any conspiracy. Climate researchers do honest science and reveal the weaknesses and caveats of their results, if you are prepared to delve into the fine print. That’s especially true when you read the journal articles. However, climate science is very politicized too and those caveats rarely make it to the headlines.
Since I got the terrible news at econbrowser that 2014 is the hottest year on record, I’ve been sitting alone at Stryker mansion in my shorts and Hawaiian shirt with the AC cranked up, desperately trying to stay to cool. Good thing it’s January. I’ve also been trying to keep a positive attitude by listening to some music. But I can’t shake the feeling that the planet is doomed. 0.04C hotter than 2005, and in only 9 years.
But in all my dark brooding, an idea started to form. Isn’t the earth a really complex system? And aren’t these temperatures measured with error? Maybe the temperature anomaly isn’t just a number. Maybe, just maybe..it’s a random variable. And if it’s a random variable, it has variance. And maybe, just maybe, if we did a hypothesis test we might not be able to claim that 2014 is any hotter than 2005 statistically.
Yes, I know it’s thin but it’s all I’ve got.
My, my my! All this navel gazing over two (actually one and its derivative) datasets saying this is the warmest year in their measured record. While the other independent datasets say otherwise. How much warmer???? Hundredths of a degree that are well within the margin of error. Statistically we can not actually say this is a warmer/warmest year. These are facts which make the above claims indisputable, but that doesn’t deter those who need to stoke the fires of fear over such claims.
Here’s what Hadcrut4, one of the independent surface stations datasets tells us: http://woodfortrees.org/plot/hadcrut4gl/plot/hadcrut4gl/from:2001/trend/plot/hadcrut4gl/to:2001/from:1979/trend/plot/hadcrut4gl/from:1943/to:1979/trend/plot/hadcrut4gl/from:1907/to:1943/trend/plot/hadcrut4gl/from:1878/to:1907/trend/plot/hadcrut4gl/to:1879/trend
The astute may notice a pattern in the data (highlighted by the OLS lines), and the really historically knowledgeable may notice when the science was predicting ice ages and run away warming in this data. Hint, look at the trend lines in the early 70s and then thereafter. Just saying navel gazing is dangerous for the social psyche. Actual long term data view: http://farm5.staticflickr.com/4111/4994030265_2de8169af7_z.jpg Notice the trend of the peaks. We are in a lowering peak, now.
CoRev,
“Here’s what Hadcrut4, one of the independent surface stations datasets tells us: http://woodfortrees.org/plot/hadcrut4gl/plot/hadcrut4gl/from:2001/trend/plot/hadcrut4gl/to:2001/from:1979/trend/plot/hadcrut4gl/from:1943/to:1979/trend/plot/hadcrut4gl/from:1907/to:1943/trend/plot/hadcrut4gl/from:1878/to:1907/trend/plot/hadcrut4gl/to:1879/trend“
The HadCRUT4 data don’t say anything differently about the reality of global warming, compared to the GISS or NOAA analyses. Whether the year 2014 was the warmest year on record or not is for the reality of global warming non-consequential. So what’s your point? BTW: What is the gap between the end of second last trend line and the start of the last trend line? Is this the LOL! gap?
“The astute may notice a pattern in the data (highlighted by the OLS lines), and the really historically knowledgeable may notice when the science was predicting ice ages and run away warming in this data. “
When was “The science” predicting an ice age? You are making this up.
“Actual long term data view: http://farm5.staticflickr.com/4111/4994030265_2de8169af7_z.jpg Notice the trend of the peaks. We are in a lowering peak, now.”
1. These are the data derived from ice core for only one location in Greenland, the GISP2 location. One location is not representative for the global temperature.
2. The last data point in the GISP2 data set is from the year 1855. Thus, the entire warming that occurred after the year 1855 is missing from the graph.
I can call it only extremly deceiptive to use this graph to claim that a cooling was taking place, which allegedly was in contradiction to anthropogenic global warming. And this is likely also the reason why you pull this graph from some obscure website, where no explanation about the graph is given and where the data are not located, instead of providing a link to a scientific source, like http://www.ncdc.noaa.gov/paleo/pubs/alley2000/alley2000.html
Why is 2014 different than 2010? One word hiatus> and its recognition. In 2011 NASA said this:
“Global surface temperatures in 2010 tied 2005 as the warmest on record, according to an analysis released Wednesday by researchers at NASA’s Goddard Institute for Space Studies (GISS) in New York.
The two years differed by less than 0.018 degrees Fahrenheit. The difference is smaller than the uncertainty in comparing the temperatures of recent years, putting them into a statistical tie.
http://www.giss.nasa.gov/research/news/20110112/“
Oh the hubris of our confidence in both the data and models. Our planet is over 4 billion years old and we use a data set spanning 125 years. That’s like trying to predict the winner of a presidential election after counting the first three votes. It’s adorable
Correlation does not equal causation. Economists should know this. And it was hotter 8,000 years ago than it is today; that was achieved at the end of the Younger Dryas and was not due to large increases in CO2 from fossil fuel combustion.
“Correlation does not equal causation.”
Maybe not, but it does wave a big sign suggesting that something might be going on.
When you hate big Government , that trumps all rationality
Robert: Great example of a straw man argument.
“Maybe not, but it does wave a big sign suggesting that something might be going on.”
Remind me again what Engle-Granger are most famous for? Apply it to the time series in the chart above.
Look at temperature variability: hour-to-hour, day-to-day, week-to-week, month-to-month, year-to-year. Now look at 0.02 degrees. In the words of the Bard, “Much Ado About Nothing.”
http://hallofrecord.blogspot.com/2007/02/global-warming-clearer-perspective.html
NOAA’s hypocrisy is amazing. This is what they actually say in their SOTC Report about the 2014 warmest claim:
“Taking into account the uncertainty and assuming all years (1880-2014) in the time series are independent, the chance of 2014 being
Warmest year on record: 48.0%
One of the five warmest years: 90.4%
One of the 10 warmest years: 99.2%
One of the 20 warmest years: 100.0%
Warmer than the 20th century average: 100.0%
Warmer than the 1981-2010 average: 100.0%
NCDC follows these conventions to categorize the confidence associated with assertions made with respect to ranks used in the report:
Probability Descriptor
> 99% “almost certain”
90% – 99% “very likely”
66.7% – 90% “likely”
50% – 66.7% “more likely than not”
33.3% – 50% “more unlikely than likely”
10% – 33.3% “unlikely”
1% – 10% “very unlikely”
< 1% "almost certainly not""
From here: http://www.ncdc.noaa.gov/sotc/global/2014/13/supplemental/page-1
For those so desperate to believe the hype, which story do you believe " The Warmest Year on Record or the actual More unlikely than likely
BTW, for those believing this is end of the hiatus please do the math. An easy to use tool is available here: http://woodfortrees.org/plot/
CoRev,
Sorry, I didn’t see that you already pointed out that NOAA had estimated the probability that 2014 was the hottest year on record or I would have credited you in my response to Menzie.
There is no hiatus. Do you even know what a confidence level is?
Sam Taylor asserts there is no hiatus. Did you even read McKitrick’s paper? This is the conclusion:
“3. Conclusion
I propose a robust definition for the length of the pause in the warming trend over the closing subsample of surface and lower tropospheric data sets. The length term MAX J is defined as the maximum duration J for which a valid (HAC – robust) trend confidence interval contains zero for every subsample beginning at J and ending at T – m − where m is the shortest duration of interest. This definition was applied to surface and lower tropospheric temperature series, adding in the requirement that the southern and northern hemispheric data must yield an identical or larger value of MAX J.
In the surface data we compute a hiatus length of 19 years, and in the lower tropospheric data we compute a hiatus length of 16 years in the UAH series and 26 years in the RSS series. MAX J estimates based on an AR1 estimator are lower but likely incorrect since higher-order autocorrelation exists in the data. Overall this analysis confirms the point raised in the IPCC report [1] regarding the existence of the hiatus and adds more precision to the understanding of its length.”
From here: http://dx.doi.org/10.4236/ojs.2014.47050
I would like you to notice the last sentence of the conclusion. If the IPCC recognizes it, and it can also be measured, what is your problem?
According to the definition of “pause” by McKitrick in the quote one always can find a “pause”. One only has to choose the time interval “of interest” short enough, regardless the actual trend over a longer time interval, because the confidence interval becomes wider and wider with a decreasing length of the time interval. So there can be warming and a “pause of warming” at the same time? What a nonsense definition that is.
Jan, isn’t mathematics interesting? It is a truth using his starting point assumption for his statistical model, there will always be a pause. Why would he do so? Because every time the pause is brought up some denier of it claims cherry picking. They then make comments and claims using the whole dataset starting from the other end, blah, blah, blah. So in denier world starting at end is OK and the other is not?
Having said that about his motivation his goal was to determine the existence of and how long the apparent/visible pause was. He did that quite well. What’s left is those still carping about some nether world statistical validity.
You also challenged someone to get alternative opinions/results for the claim warmest year on record. That’s been done several times already. What is amazing is the need to ride that horse when the perpetrators of the claim admit they believe it “more unlikely than likely” to happen/be true, etc. Why go any further?
CoRev,
“Jan, isn’t mathematics interesting? It is a truth using his starting point assumption for his statistical model, there will always be a pause. Why would he do so? Because every time the pause is brought up some denier of it claims cherry picking. They then make comments and claims using the whole dataset starting from the other end, blah, blah, blah. So in denier world starting at end is OK and the other is not?”
So, McKitrick has given a definition for “pause”, which doesn’t make any sense, scientifically, because it is non-consequential for the question whether global warming is real and continuing. Have you just tried to provide a rational why he would provide such a definition for “pause”, which is non-sensical? And what is a “denier” of the “pause”? Someone who points out that claiming a “pause” is nonsense, if it can only be claimed for “real”, if one applies McKitrick-like mental acrobatics?
CoRev,
“You also challenged someone to get alternative opinions/results for the claim warmest year on record. That’s been done several times already.”
No, I didn’t ask for naming someone with another opinion about which one was the warmest year. I asked for surface temperature analyses that come to substantial different results than the NOAA or NASA analyses. If you claim that has been done several times, it should be easy for you to point to them then.
“What is amazing is the need to ride that horse when the perpetrators of the claim admit they believe it “more unlikely than likely” to happen/be true, etc. Why go any further?”
Is this what you understood they “admitted”? So what did they “admit” was the year, which was more likely the true one with the temperature record than the year 2014 instead?
Jan claims: “So, McKitrick has given a definition for “pause”, which doesn’t make any sense, scientifically,…” If it makes no sense scientifically, why are so many trying to identify <b?causes for the pause? At latest count I think we are up to ~60 different scientific papers and articles with explanations.
BTW, that pause under study is the very same one McKitrick defined and measured using several different datasets.
of course sea level has continued to rise. but i am sure this has nothing to do with global warming, right?
Baffled, why the sea level rise strawman argument? The article was about the dubious claim of Hottest Evah in recorded history.
Why do you think much of today’s science is done by Press Release? It’s been noted several times already that even NOAA feels it — “33.3% – 50% “more unlikely than likely”?
Kopits: “In New Jersey, I’d like it warmer.”
Conservatism in a nutshell: “Screw you, I got mine.”
Baffling, apparently not.
https://www.climate.gov/news-features/featured-images/antarctic-winter-sea-ice-extent-sets-new-record-2014
We know for sure trying to make the world cooler will make everyone poorer.
How about a massive industrial revolution in Africa?
I tend to agree with this professor:
UK professor emeritus of biogeography Philip Stott of the University of London:
“…regards climate as the most complex coupled non-linear, possibly chaotic, system known… does not believe we can manage climate change predictably through fiddling at the margins with just a couple of factors.”
“…humans have survived climate change for thousands of years, not by playing God with one or two politically selected factors, but by adapting to the new conditions.”
“,,,the fundamental point has always been this: climate change is governed by hundreds of variables and the very idea that we can manage climate change predictably by understanding and manipulating at the margins one politically-selected factor (CO2), is as misguided as it gets.”
Philip Stott is no longer a member of the Scientific Alliance because he deems it important to be academically independent of all organisations, industry, and green groups. In the UK, he is a lifelong Labour supporter and he is mildly left wing politically.”
Bruce Hall, did you even read the report you linked to? As it points out, the Arctic and Antarctic are quite different systems. The first is an ocean surrounded by continents and the second is a continent surrounded by oceans.
In the case of the Antarctic, growing sea ice is partially a consequence of warming that moves ice from the continent into the ocean. That produces an increase in sea level.
When low Artic sea ice announcement was released, Fox’s headline was the bit about Antartic sea ice. What a surprise.
Here is NASA’s You Tube video on Antartic sea ice.
http://youtu.be/hauoepPqns4
Yes, I read the article, but your interpretation leaves much to be desired; i.e., global warming causes the ice shelves to melt while global warming causes the ice shelves to grow. Well, gee, shall we just refer to global warming as god? Or luck? Or shit happens?
bruce, the issue is where the sea ice originates. if it originates in the sea itself, it really has no impact on the sea levels-the liquid was already in the ocean. if the sea ice originates from ice shelfs that flow into the sea, then you have a problem because this will most definitely increase the volume of ice and liquid in the oceans. until you can understand the basic physics it is best for you to not comment and hide your ignorance.
corev, this goes back to previous lectures i have given to you and you failed to understand. you need to explain within the context of a lack of global warming, why sea levels continue to rise. but you cannot do that. this is why you fail the tests.
rick stryker, please go back to your highly air conditioned room for the winter. you will do us all a favor.
Sea level rise is the equivalent of an inch per decade… hardly an inundation and nowhere near the doom scenarios so often projected.
http://wattsupwiththat.files.wordpress.com/2011/01/lack-of-acceleration-sea-level1.jpg
Given the argument that sea ice makes no difference in sea levels, then the arctic ebb and flow of sea ice extent is irrelevant. Likewise, the ebb and flow of the Antarctic sea ice extent. The fact that earth is gradually recovering from the “little ice age” it is not unreasonable to expect some land deglaciation. Your expectation/hope/belief/wishing for a static climate is the closest thing to climate absurdity one could propose.
Nevertheless, the negative economic impact on lower level shorelines will be greater as each one-inch of average sea level per decade occurs… less that one foot per century. This will be offset by longer growing seasons, (hopefully) shorter/warmer winters with less cold-weather deaths, and the natural benefits of a wider temperate climate. The overall impact simply cannot be projected… positive or negative… because the ability to project something as simple as temperature change has been shown to be elusive to the “climate models.”
So, let’s get to the real motivation for all of the hype: government programs and funding from government agencies. Just follow the money. Universities are, by far, the greatest beneficiaries of government spending on “climate change.” Hard to turn down the cash, so it’s imperative to turn up the hype.
Baffled, you seem to forget my past answers. I really don’t think you know what Global Warming means, but especially how it effect sea level. Sea level is effected by several different factors. Only in the climate world are they ALL associated to warming. A quick list of just some of those factors include: Coriolis effect, Wind and atmospheric pressure changes, land bounce back and subsidence, salinity changes, Solar irradiance warming, glacier melt, sea currents, el Ninos & la Ninas,etc.
Which on that incomplete list do you relate solely to Global Warming, or in your words “…the context of a lack of global warming”? You’re focused on only one sign of the sea level sine wave. We are right now in a saw toothed pattern for sea level.
Well, some people are making a little too much out of 2014 barely measuring as the hottest year on record, but others are making way too much out of the “pause”. The trend has always been a bumpy one, 1998 was a big bump upward, and the fact that we have now more or less matched 1998 a third time confirms the upward slope of the trend. You can hope there turns out be a pause, but that is not what the data is actually telling you.
rick stryker
“If you look at my past comments on this topic, you’ll see that I don’t deny that global warming is occurring. I also do not deny that at least some of it is man-made. The greenhouse effect is of course real. The question has always been how much the temperature is really going up in the long term and how much it matters.”
“But is the temperature rising over the next 100 years? Yes, very likely it is. Will it matter? No one really knows at this point.”
i do find it funny how the deniers continue to move the goal posts defining their positions, never admitting they were wrong but simply redefining their claims. when the global warming arguments first appeared, the argument was the earth is not warming! you see remnants of this argument to this day when somebody uses a particular cold spell to argue against global warming. rick stryker just now used a similar argument with his air conditioner nonsense.
but look at how much of the position held by rick stryker and others has been walked back from their original denier levels. first they were confronted with evidence that the earth is actually heating up, so they soften their rhetoric to agreeing that the earth is indeed warming (although you still see the old argument reappear such as with rick stryker, corev and others arguing for a “hiatus”). the argument then became the earth is heating from natural causes, not man made. humans were simply too small and insignificant to alter the vast thermodynamics of the entire planet. but the evidence continued to present itself against this case. now we have rick stryker accepting that man made warming actually does exist. but he cannot bring himself to admit he has been wrong, so again he provides an asterisk with his stance, saying he does not know to what magnitude this may occur.
rick stryker, i applaud your realization that you actually do agree with what most of the climate scientists have observed with regard to global warming. at some time, you will need to drop your ideology and simply follow your instincts to fruition. you already admit you accept global warming is occurring, that man made warming is occurring, and we have unknown risks for the future due to global warming. you are getting there, and i’ll even hold the door open and welcome you to the club of knowledge when you are ready to enter!
Baffling,
I’ve never walked back any such argument and have always been consistent if you look at my previous comments. I’m not sure who you are talking about in this comment. You just don’t understand the argument that climate skeptics actually make and you don’t know what the issues are.
If you dropped your assumption that people who disagree with you are foolish or ignorant, and actually listened to what they are saying, you might get into the club of knowledge yourself.
Thanks Rick. It’s Baffling to read much of his commentary. But, he is representative, imprinted of so many, imprinted some time at the end of the last century’s science. Just look at Menzie’s attempt to deluge us in meaningless detail showing no zero trend. They seem to continue to believe skeptics commented so. As this comment thread shows there are still more than just remnants of that argument. The other frequent strawman argument is that that skeptics claim the hiatus starts in 1998. We see those strawmen all the time
The science has moved on leaving them in denial.
Darn this laptop. That should have been : But, he is representative of so many, imprinted some time at the end of the last century’s science.
Corev,
Sadly, it’s true. Baffles is a special case though. I think he might be a troll. He seems too dense to be believable.
ricky, this history of the skeptics, particularly from the conservative side of politics, is more or less what i have indicated. they (and you) have begrudgingly acknowledged the data by slowly changing your stance from no warming to some warming to some man made warming to how much man made warming. this is simply walking back your position. you deny this walking back has been taking place? at least your are walking towards the truth rather than away from it!
corev, again you have not been able to answer the simple question: you need to explain within the context of a lack of global warming, why sea levels continue to rise. if you want to use your parameters, fine. show me how they fit into a world of rising sea levels without global warming. this is exactly what i have been asking for. but you have been unable to provide an answer.
bruce
“Sea level rise is the equivalent of an inch per decade… hardly an inundation and nowhere near the doom scenarios so often projected.”
i have lived in places in the us which would be quite vulnerable to such changes. there are many places throughout the world even more vulnerable. and that is the current rate. if you don’t make changes, you think the rate will improve in your direction? foolish notions.
Baffled, your question is nonsensical. 1) Sea level oscillates, up and down. 2) Sea level goes down when there is NO WARMING. 3) When the warming is slowed enough to be overwhelmed by the non-melt or temperature driven factors sea level will go down. Recent science has stated those global warming elements to be responsible for ~1/3 of the rise. Solar insolation is the biggest global warming factor for warming of the seas. If it continues to diminish, then sea temps will diminish slowing the rise. These are conditions similar to those of the LIA. Sea level went down in the LIA. There will be a transition period between the relatively rapid to change global warming factors, when the ~2/3 non-warming factors will continue positive overwhelming the global cooling.
What makes your question nonsensical is it is based upon your own perception of primary cause, global warming and that those conditions will continue. In today’s world all three of those those factor groupings remain positive.
I fail to understand how this test of my knowledge does anything other than to school you, improving your ignorance on the subject. Don’t expect another answer to your question. It is based upon ignorance.
corev, again you have not been able to answer the simple question: you need to explain within the context of a lack of global warming, why sea levels continue to rise.
Baffled, you truly are baffled by the answer. Try doing the research to understand the answer. Or not. It no longer matters.
corev, again you have not been able to answer the simple question: you need to explain within the context of a lack of global warming, why sea levels continue to rise. apparently you are unable to do so.
Baffled, to repeat the issue between us: ” I really don’t think you know what Global Warming means,…” So, define global warming and the major components effecting it. Unless you can do that, you will continue to fail to understand any related discussion. 😉
corev, again you have not been able to answer the simple question: you need to explain within the context of a lack of global warming, why sea levels continue to rise. apparently you are unable to do so.
Baffled, until you can identify <Global Warming and its context you will not understand any answer. Accordingly, it no longer matters.
corev, at the beginning of this discussion i asked you a simple question and you could not provide an answer. now you want to switch tactics. answer the question that was posed if you can. personally, i don’t think you are able to do so.
Baffled it’s been answered several times, but due to your ignorance of what factors influence global warming and sea level rise, you can not recognize when it is answered. To make it as simple as possible, the answer is transition into/from climate change periods. Now you do the research to see how that answers your questions.
A further repeat will only show your ignorance of your own subject and/or laziness to understand. Since the question is so simple it should be a simple matter to answer. Until you can identify Global Warming and its context, you will not understand any answer. Accordingly, it no longer matters.
Repeat the question again, please, to confirm your ignorance or laziness.
corev, again. you have not been able to answer the simple question: you need to explain within the context of a lack of global warming, why sea levels continue to rise. apparently you are unable to do so. remember you are the one harping on the hiatus, in which global warming has stopped.
Baffled, your question has been answered several times now, the reason you can not understand it is because , you are too lazy or ignorant to define the “context” of Global Warming “. Because of this attitude there is no common understanding of the basic terms/factors, and you continue to ask a nonsensical question. To explain how nonsensical the question is I will use an analogy, the automobile, that even you should understand.
Your question using the auto analogy is translated to: In the context of automobiles, why are the tires rotating clockwise? I started answering from the high-level general view point: the driver started the engine, placed the transmission in gear. Still no understanding from you due to your laziness or ignorance. After repeating the nonsensical question I tried an answer listing the components making up the auto’s drive train. Still no understanding from to your laziness or ignorance. Finally, as a test to see if you want to understand and discuss or just want to troll, I have used an analogical approach. I already know the answer.
corev, again. you have not been able to answer the simple question: you need to explain within the context of a lack of global warming, why sea levels continue to rise. apparently you are unable to do so. remember you are the one harping on the hiatus, in which global warming has stopped. “your question has been answered several times now” is completely inaccurate. it has not even been answered once. so i ask the question once again in anticipation of your coherent answer.
Baffled, as I expected! At what speed do you troll?
corev, again you have not been able to answer the simple question: you need to explain within the context of a lack of global warming, why sea levels continue to rise. heck, from the variety of responses you have given you can’t even decide whether we have global warming or cooling, much less how it would affect global sea levels. and we have not even had the chance to return to your explanation for a warming southern ocean.
Baffled, I asked a simple question earlier. ” At what speed do you troll?” 😉
corev, be happy to respond after you answer the simple question that started this lecture. if you are unable to answer the question, that is fine simply let me know. if you want to promote your propaganda simply be able to support it with evidence.
Baffled, found an definition of your question: “It’s difficult to tell what is being asked here. This question is ambiguous, vague, incomplete, overly broad, or rhetorical and cannot be reasonably answered in its current form.”
corev, again you have not been able to answer the simple question: you need to explain within the context of a lack of global warming, why sea levels continue to rise? at this point it is obvious you cannot answer the question.
Global warming. Climate change. Climate disruption. No snow. Extreme snow. No rain. Extreme rain. No polar ice. Increasing polar ice. Weather is / is not climate. Polar vortex. Forest fires.
These goal posts move daily
If you dad aint Dennis Quaid, yall be dead!
If you get to this comment, you are probably interested enough to read this post at “Real Science” by Steve Goddard:
https://stevengoddard.wordpress.com/2015/01/18/how-gavin-cheated-to-create-the-required-talking-point/
Essential point:
“Gavin (Schmidt – NASA) showed much of western Greenland 1-2C above normal, when it was actually 2C below normal. It doesn’t take a lot of that sort of cheating to get temperatures up 0.02 globally.”
“Essential point:
“Gavin (Schmidt – NASA) showed much of western Greenland 1-2C above normal, when it was actually 2C below normal. It doesn’t take a lot of that sort of cheating to get temperatures up 0.02 globally.”
1. The satellite retrieved data shown are data for the lower troposphere. The GISS analysis is for the surface temperature. There is no reason to expect that they would have to be identical.
2. The baseline period of the RSS temperature anomalies, shown by “Steve Goddard”, is the time period 1981-2010. He compares these anomalies to the anomalies in the GISS surface temperature analysis, which have the time period 1951-1980 as baseline. One can easily adjust the tool at the GISS website, http://data.giss.nasa.gov/gistemp/maps/, which was used by “Steve Goddard”, to display the anomalies relative to the same reference period as the one used for the RSS data instead. Then, one gets the following:
http://data.giss.nasa.gov/cgi-bin/gistemp/nmaps.cgi?sat=4&sst=3&type=anoms&mean_gen=12&year1=2014&year2=2014&base1=1981&base2=2010&radius=1200&pol=rob
And voila! A lot of the difference between the anomalies goes away. Note that the GISS analysis actually shows a negative anomaly in South-East and East Greenland, which is larger in magnitude than the one in the RSS data. The interpolation method applied by GISS to cover areas without measurements works within a reasonable range of uncertainty.
No Gavin is not the one who is cheating here. It’s “Steve Goddard” who is, instead, by comparing anomalies that have different baseline periods, out of cluelessness or dishonesty, which is not mutually exclusive.
Jan, claims: “2. The baseline period of the RSS temperature anomalies, shown by “Steve Goddard”, is the time period 1981-2010.” Actually the baseline period used by RSS is RSS Jan 1979 – Dec 1998 (20 years) and the UAH baseline period is Jan 1981 – Dec 2010 (30 years). So you were wrong on the baseline periods and the satellite data Goddard chose to use. He used both RSS and UAH.
Since all the datasets use different baselines ” There is no reason to expect that they would have to be identical.” What was your point?
You were also trying to obfuscate the Goddard message re: Greenland data being infilled versus no data.
In another comment you asked whether other scientists showed hottest the years as different from the NCDC/NASA “hottest Year” claim. It is there in the satellite data. They still show 1998 as the hottest year.
There is no Steve Goddard. There is a Tony Heller writing as Steve Goddard, and Heller isn’t a climate scientist. According to Wikipedia, he has an MS in Electrical Engineering.
And there is no Gavin Schmidt in the authors of this: http://www.arctic.noaa.gov/reportcard/greenland_ice_sheet.html
Weather
Slightly negative (-0.7) North Atlantic Oscillation (NAO) conditions in summer 2014 promoted abnormal anticyclonic conditions over southwest and northwest Greenland; these favored northward advection of warm air along its western margin as far as the northern regions of the ice sheet (see Fig. 1.3d in the essay on Air Temperature). Further, the anticyclonic conditions reduced summer precipitation (snowfall) over south Greenland. The combination of southerly air flow and lower precipitation contributed to the melting, mass balance and albedo observations reported above.
The advection of warm air towards Greenland is reflected in summer air temperatures. Near surface air temperature data recorded by automatic weather stations (Table 3.1) indicate that summer 2014 in Greenland was the warmest on record at Kangerlussuaq, west Greenland, with June temperatures +2.3°C above the 1981-2010 average. Other west Greenland locations also had anomalously warm summer temperatures. For example, the coastal site of Nuuk had its second warmest summer since 1784, with July temperatures 2.9°C above the 1981-2010 mean.
Warming in winter is greater than in summer (Table 3.1). At Ittoqqortoormiut, east Greenland, where observations began in 1924, the average air temperature during December 2013 to February 2014 equalled the record high set in the same period in 1947, and January temperatures were 7.5°C above the 1981-2010 average. Upernavik, west Greenland, had its 7th warmest January, 8.7°C above the 1981-2010 average, since observations began in 1873.
So, what is normal? 1936? Why do you choose that date, because it is in the middle of recorded temperatures (according to Menzie’s graph)?
Were fewer people dying during the “Little Ice Age” because of cold and crop failures than today? Are people dying of the increase in average temperatures today?
Why is Greenland called Greenland?
For those desperate to believe the claims of a temperature record here is a highly level description of the NOAA/NASA process. They are combined as one here as the GISS (NASA) data starts as partially processed NOAA data;
There are none or very few measurements for the poles. That’s true for both in the satellite and surface data. Accordingly, GISS ( NASA) infill the missing Polar data using stations from as much as 1,200 kilometers away for it’s Polar projections of temperatures.
Taking that assumption as a valid process, they then conclude that infilling is a valid step for projecting temperatures for missing data. This is a critical decision, as it allows them to then project temperatures for >~30% of the planet every month. Early in the monthly data collection cycle that percentage is even higher as it takes some time for those data to be sent and processed. At this point in the data collection cycle it is on the high side of missing data.
Understanding that process, we can see how bad the confidence levels and premature are these “HOTTEST TEMPERATURE EVAH” claims.
Infilling is only one of the “adjustments” made on these data in EVERY PROCESSING cycle. They are done to the total of the dataset every cycle. Consider then, that the data are forever changing, because those adjustments are done to BOTH the baseline data and the historical data. That leaves us with a valid claim that nearly all the change is due to man-made adjustments.
Since this adjustment process was “peer reviewed” it appears that some form of it is being used in nearly all the surface datasets. Making all the claims from the surface datasets somewhat problematic. How much? Dunno since this process has not beer reviewed in total. With that in mind, it is easy to perceive how bias can creep into the adjustments, as they have been defined by scientists who believe that warming (some, most, all) is caused by increasing CO2 levels.
Accordingly, we see the vocal attempts to deny the importance of the “Hiatus/Pause” as it questions the (most/all) assumptions of the scientists and the cohort of believers.
corev, infilling data each period simply allows one to better see if a trend is occurring. the lack of data, which you seem to approve of, would simply tell you nothing. on the other hand, you are implying that not only the infilling of data is bad, but in reality the infilled data is the opposite of what would actually have been measured. so one group is using the infilled data to catch a pattern from observed data, while you simply advocate that the trend should be opposite, with actually no data to support this view.
Baffled, the clarification of: “infilling data each period simply allows one to better see if a trend is occurring.” is in the lack of data the trend is man made due to infilling. I.m sure that’s not what you meant, but it matches the quality of your other comments. The remainder of your comment is so muddled and lacking of logic it matches “It’s difficult to tell what is being portrayed here. This comment is ambiguous, vague, incomplete, overly broad, or rhetorical and cannot be reasonably understood in its current form.” Just what was it you were trying to convey?
BTW, why have you failed to comment on the NCDC/NASA confidence level of more unlikely than likely to be true for their s claim of warmest year ever? If you re-read my description of their data collection and estimating process their reasoning is obvious. Menzie, you are included in this question.
corev, just curious how complete and extensive do you require the data set before you are willing to accept the results? and are you willing to fund such an effort?
Baffled, why the persistent nonsensical questions? It’s not about me, and the data! It’s about the deliberate exaggeration of the claim, warmest year .., and ignoring the caveat of “more unlikely than likely.” It’s also about the gullibility of those who have the need to blindly believe those exaggerated claims.
corev, so you would have no problem with a headline that read “2014 comes in as one of the warmest on record”?
my question on data stems from the fact you will argue with the data no matter how robust the data set. in your view, their will ALWAYS be some subset of data which, if measured, would counter any assessment made with respect to global warming. you do not know what the data is or how it is to be measured, but is surely exists because you have already been enlightened by the truth.
Baffled, why the persistent nonsensical questions? It’s not about me, and the data! It’s about the deliberate exaggeration of the claim, warmest year .., and ignoring the caveat of “more unlikely than likely.”
CoRev: Hmmm. How often do we see statements like “GDP exceeds previous peak” without reference to standard errors? GDP is a random variable like the global anomaly. Your statistical point is taken, but it doesn’t change the fact that the mean estimate exceeds the previous mean estimates. It certainly doesn’t contradict the trend finding I noted as an update in the post.
menzie, very nice chart to illustrate the upward trend of temperature over time. i still expect somebody like corev will find a reason to say this data is corrupted, but really only an unreasonable person could argue that trend is not moving higher. at least we now have folks like rick stryker at least acknowledge temperatures are on the rise…corev is still in that denial stage. he can’t even concede the statement “2014 comes in as one of the warmest on record”
Menzie, the trend is not even at issue. We have warmed since the records started being taken. We were recovering from the Little ice Age. To think we would not is naive, and in the end you are arguing that skeptics are in ?denial? of that warming. No! Read what Stryker said. That is the the view of nearly every skeptic.
What is at issue is the exaggeration for the claim warmest ever, when they in their details clarified it as “more unlikely than likely”. What you and the others need is for the record to be set this year, but forget it actually weakens the argument of anthropogenic warming. The reason there was any warming was due to a rise in sea surface temperatures. That is surely not due to CO2 and clearly not ACO2. It is due to solar energy. Man does not effect the amount oh energy given off by the Sun.
The other issue is why the need for the heat to recommence? The answer is simple, to counter the huge number of doubts in the AGW hypothesis generated by the pause.
Preliminary GDP estimates are usually identified as preliminary. Preliminary temperature estimates are seldom so identified., It is common to see reports, as the NOAA State of The Climate (SOTC), to be later revised without an announcement. What is also common is to see claims in Press Releases as we just did completely ignoring the error bars.
Do your GDP estimates include descriptors like that when making exaggerated claims?
CoRev: I see — it’s because of a conspiracy so vast…
Menzie, that was supposed to be: “the amount of energy given off by the Sun.”
Baffled, do you even read the comments? You asked another nonsensical question: “…you would have no problem with a headline that read “2014 comes in as one of the warmest on record”?” No, I WOULD NOT HAVE SUCH A PROBLEM. That’s exactly what we have been saying, it is one of the warmest, but the error bars at the time of the announcement could not support the claim the warmest.
Menzie, conspiracy? You started off claiming I/skeptics denied there was warming. Now, you claim I/we believe in some conspiracy ideation? I asked earlier in the thread, why all the strawman arguments? If you have an issue with something I’ve written, cite it and then argue your point.
CoRev: I was responding to your explanation for why the heat readings were published, to wit:
“The other issue is why the need for the heat to recommence? The answer is simple, to counter the huge number of doubts in the AGW hypothesis generated by the pause.”
Menzie, how does this comment: “I was responding to your explanation for why the heat readings were published, to wit:” equate to a conspiracy theory? It was written in conjunction of this thought in the previous paragraph: “What you and the others need is for the record to be set this year, but forget it actually weakens the argument of anthropogenic warming. …The other issue is why the need for the heat to recommence? The answer is simple, to counter the huge number of doubts in the AGW hypothesis generated by the pause.”
Reading through many of the comments it is easy to see how the denial of the “pause” applies. From Joseph’s 1st comment to Jan’s and Baffling’s, et. al. attempts to discredit the importance of the “pause”. Accordingly, this whole discussion is moved from the science to politics, and the messages of these number of comments can be boiled down to the messages of these comments:
1) Joseph January 16, 2015 at 11:40 am
But … but …. but … Hiatus! Argle-bargle.
2) ” Dave January 16, 2015 at 2:51 pm
We can talk politics (i.e., funding source) or we can talk data analysis. Which do you prefer?”
3) But for most skeptics this comment is representative of their views of the data:
” Anonymous January 21, 2015 at 9:08 pm
The satellite data shows no record. And neither does the surface data once you account for the size of the error bars. The literature shows that we are not particularly warm compared to the MWP and Holocene Optimum. There is no empirical evidence to support the AGW hypothesis and the models based on it show the greatest divergence to this point”
After ignoring almost all the comments you provide your own strawman arguments about the not disputed warming trend, comparison with GDP estimates, and nonexistent claim of conspiracies. All of which add nothing to the discussion value, and which appear to support the importance of the latest claims of a dubious record. Dubious because it falls well within the error bars making it indistinguishable from the previous highs; does not support the AGW hypothesis; but will support the continuance of the “pause”.
Well, it’s good to see we all agree it’s getting warmer.
This is a pretty cool (no pun intended!) animation.
http://www.bloomberg.com/graphics/2014-hottest-year-on-record/
Menzie, let me try to explain the skeptics’ view (at least mine and many others) of Climate Science in terms of economics.
1) In this view/examples/analogy economics is dominated with the Austrian School’s focus on the Gold Standard. In so doing these economists have included Gold as the driving factor in all GDP discussions. This theory, which simplified, says world-wide economic/GDP changes are driven by availability of gold. Not only is gold important but the GDP changes are driven by newly mined gold into the world economy. Early on these economists insist that newly mined gold are more better economic predictors than any of the other commodities and dominates the sum of and introduction of any of them into the world economy. (Climate change is driven by ACO2)
2) This theory is then included into the world economic models. These models during some periods these models can predict reasonably well, but when back-casting they diverge from the actual economic history record. Still these economists insist the model forecasts can and should be accepted as valid for the many decades remaining until the start of the next century. Even though when challenged these same economist admit their models can not be used for local or short term economic/GDP projections. (Climate models, the sum of the scientific hypothesis, are unsuccessful at predicting local conditions)
3) Over the past couple of decades the models using this gold theory have projected many, many economic/GDP changes of which the most visible and publicized are extremes. In the few decades these predictions have failed to occur or are seriously less extreme and/or frequent than projected. (Climate models, the sum of the scientific hypothesis, are diverge from actual measurements and climate conditions while continuing to projecting extremes)
4) This theory is so widely accepted that its adherents are in key positions in organizations doing the daily measurements and short term estimates from them. These same measurements are always incomplete and error filled. Early in the monthly cycle is when the data is most incomplete (usually in the 30-40% range), and seldom becomes optimally complete (down to the ~20% range) for weeks and months after the monthly cycle ends. To solve this failing in completeness and to help identify and correct for errors they infill non-existing data with averages from surrounding economies, and when they find existing data outside the expected norm (based upon historical and theoretical norms) it is replaced with a new calculated economic/GDP measurement. (Climate/temperature measurement organizations imply higher precision in its projections than the real world)
5) Into this economic cycle we see a claim that the current year has the greatest economic/GDP growth, but in the fine print admits that their confidence factors are 38 and 48%. That is translated to “more unlikely than likely” to valid. (The subject of the article)
There is much detail left out regarding the political influence of these views and the policy implications, but you can see their impacts in the press and frequent policy statements. It is not a conspiracy. It is a belief structure that appears to be exaggerated in its impacts and influence. “No challenge is a greater threat than climate change!)
I don’t know if this analogy helps describe the skeptical view points, but it is an attempt.
“There is much detail left out regarding the political influence of these views and the policy implications, but you can see their impacts in the press and frequent policy statements. It is not a conspiracy. It is a belief structure that appears to be exaggerated in its impacts and influence.”
And exactly why is this statement not representative of the climate change skeptics?
And why is it that violence has been threatened against climate scientists like Dr. Michael Mann and no violence is ever threatened against climate skeptics? (Why is it that abortion doctors are murdered by “pro-life” believers and “pro-life” believers are never ever murdered by “pro-choice” aka “pro-death” believers?)
Who has the most entrenched belief structure?
Why as far as I can tell, it is the climate skeptics.
I do not know what the ultimate truth is for the global warming discussion. But I do know one truth that is now indisputable: We, puny as we are, affect the world around us in dramatic ways. And, if we are to survive we must learn to discover how we change the world and to manage those changes. As far as I am concerned this is the truth that the climate skeptics refuse to face.
corev
“Menzie, the trend is not even at issue. We have warmed since the records started being taken. We were recovering from the Little ice Age. To think we would not is naive, and in the end you are arguing that skeptics are in ?denial? of that warming. No! Read what Stryker said. That is the the view of nearly every skeptic.”
it is nice to see you, along with stryker, agree the world is warming. but it is rewriting history to argue skeptics have always believed this view. a decade ago and longer, this view was most definitely not held by the skeptics-hence the term denier to describe their view. it was only after the data was irrefutable that deniers begrudgingly acknowledged the temperatures were rising. now you can argue this was not your view, and i cannot prove otherwise since i have no comments from you years ago. but i can state without a doubt the conservative movement from years ago (and many still today) began with the premise the world was not warming and fought against any policy which operated from such a position. but it is nice to see you are actually willing to acknowledge global warming is true.
“No, I WOULD NOT HAVE SUCH A PROBLEM. That’s exactly what we have been saying, it is one of the warmest, but the error bars at the time of the announcement could not support the claim the warmest.”
now you simply want to argue semantics. if it is the warmest, or the second warmest, does that change the discussion in any meaningful way? you are trying to move the discussion away from the main point with your semantics. if it is not a new record, it is a near record. that means the temperature is still high-and the hiatus does not mean too much if we are still at or near record temperatures. why argue so vehemently against what you acknowledge is a truth?
Anon2 and Baffled, all you are doing is citing your personal opinion. I’t OK to have it, but without references it is foolish for anyone to discuss them.
Baffled I thought you said you knew mathematics? Saying this shows otherwise: ” if it is the warmest, or the second warmest, does that change the discussion in any meaningful way? … if it is not a new record, it is a near record. that means the temperature is still high-and the hiatus does not mean too much if we are still at or near record temperatures. ” If its not 1st then it is no record, and the claim is proven wrong and just another exaggeration. Being at or near record temperatures does not prove anything regarding the hiatus. It is viewed as the peak of the recent warming, and it is estimated to hold or shift downward for the next decade or two. No one claims there is no minor variation, but that the variation falls within the Ordinary least squares zero trend range.
This how skeptics view the science: https://bobtisdale.files.wordpress.com/2015/01/figure-34.png?w=720 from here: http://wattsupwiththat.com/2015/01/24/an-unexpected-admission-from-dana-nuccitelli-at-skepticalscience/ If you don’t know who Nuccitelli is he is one of the Skeptical Science bull dogs, and this is an important admission, because if you note our discussions, it has all been about the oceans.
I strongly recommend you read this article, because it is being supported more often and broadly by the traditional climatologists. The oceans have been the forgotten climate entity.
CoRev,
It’s true I didn’t cite any sources directly but there are tons of them out there. Even Richard Muller, funded by Koch, agrees that warming is real and caused by human actions. Go google him, though I’m sure you already know about him.
But it’s not even important to me if human caused global warming is real or not because the energy problem persists. Fossil fuels are finite. And a new source of energy must be found if we are going to continue this life of great opulence. It may not happen in your lifetime, but it will happen. The Japanese went to war to secure sources of oil. The United States went to war in the mideast to secure sources of oil. Deny it all you want. We would not have given a crap, but for the oil.
So fossil fuels are finite and we kill for it.
Time for a change.
And if you start to look further, you will discover that ocean life is at risk due to human actions, that many other mammals are facing extinction due to human action, and that coral reefs may disappear due to human action, that fresh water is in shortage, that arable ground is disappearing. So close your eyes and keep your air conditioner turned up high.
Anon2, any more strawmen memes?
So what strawmen? They all wear asbestos!
Are fossil fuels infinite? IS THAT YOUR CLAIM?
Did Dr. Muller at the Berkely Earth Study not get funded by the Koch brothers and conclude that global warming was occurring and, occurring as a result of human activity? IS THAT YOUR CLAIM?
Here you can read what they say about 2014: http://static.berkeleyearth.org/memos/Global-Warming-2014-Berkeley-Earth-Newsletter.pdf It’s probably the hottest, but if not it’s close. These were/are Koch funded folks.
By mid-1941 Japanese leaders believed that war with the United States was inevitable and that it was imperative to seize the Dutch East Indies, which offered a substitute for dependency on American oil. http://www.strategicstudiesinstitute.army.mil/pubs/summary.cfm?q=905
Iraq war was for oil: http://www.cnn.com/2013/03/19/opinion/iraq-war-oil-juhasz/ Among very many other sources. Of course, you may believe, if you like, that it was all about Sadam trying to kill George W. Bush’s daddy.
Is it your claim that we did not fight for access to oil? IS THAT YOUR CLAIM?
There are so many sources for the rest of it. I’m sure a man of your intelligence, competence, and experience can find them. Go read The Sixth Extinction. Go google desalination plant in LA. Go read a few books about sustainable agriculture. (Yes, I know that word, SUSTAINABLE, chokes in your throat) Go read about the Ogalla aquifier. Start here: http://www.washingtonpost.com/blogs/wonkblog/wp/2013/09/12/how-long-before-the-midwest-runs-out-of-water/
Go read about the violence at abortion clinics: http://www.feminist.org/rrights/pdf/2015NCAPsurvey.pdf
Go read.
Go read.
Go read.
Oh, don’t bother.
It won’t help.
Anon2, none of these have any relationship to the point of the article. Ergo, strawmen arguments. Take it to another blog.
My apologies for the rant.
But I believe that climate skeptics are deeply, profoundly wrong and cannot see the forest for the trees.
May there be a world left that your grand children can survive in.
1) the earth has a finite amount of fossil fuel
2) humans will NEVER consume all of the earth’s fossil fuel. Never
Any economist worth their salt will recognize both of these statement true
Anon2
Abortion, Koch brothers, Saddam? Add the Holocaust to this discussion and we are at peak flame.
Science is the belief in the ignorance of experts.
– Richard Feynman
Dr. Tim Ball writes:
“…2014 was among the coldest 3 percent of years of the last 10,000, but that doesn’t suit the political agenda.”
This is how the releases should have been reported:
“Nominally this ranks 2014 as the joint warmest year in the record, tied with 2010, but the uncertainty ranges mean it’s not possible to definitively say which of several recent years was the warmest.
Colin Morice, a climate monitoring scientist at the Met Office, said: “Uncertainties in the estimates of global temperature are larger than the differences between the warmest years. This limits what we can say about rankings of individual years.
“We can say with confidence that 2014 is one of ten warmest years in the series and that it adds to the set of near-record temperatures we have seen over the last two decades.”” From here: http://www.metoffice.gov.uk/news/release/archive/2015/2014-global-temperature
or”statistically we have never recorded a temperature higher than 2014.”
Baffled in the end it continues the pause/hiatus for another year.
corev, according to your statements, you have no statistical evidence to refute the statement that 2014 is the hottest on record. you cannot say this is a false statement.
Baffled correct! No statistical evidence of warmest or not. That’s why I showed the other statement. Which, BTW, was similar to the BEST, JMA, and now Had CRU announcements. Only the US agencies made the unequivocal warmest claim while hiding the actual statistical evidence. Those are the very same agencies responsible for the satellites and their data, which showed it not the warmest.
Being warmest has little effect on the trend, since in the end it continues the pause/hiatus for another year. It is now up to 18 years 3 months in the RSS dataset.
All those are facts and not emotions surrounding a dubious, unsupported claim of warmest evah.
corev, you are the only person i know who can argue a statement is false without any data to support that as fact. you do not have any evidence to argue “2014 is the hottest on record” is a false statement. but that is exactly what you have been asserting.