The dollar has exhibited substantial strength in the past few months, both against the euro, and against a basket of currencies, as noted in the press (e.g., [1] [2]) While this assessment is correct, it’s useful to keep the dollar’s movement in perspective.
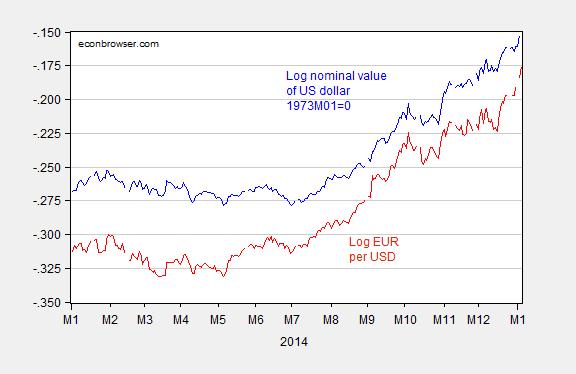
Figure 1: Log value of US dollar on trade weighted basis against other major currencies, 1973M01=0 (blue), and log EUR/USD exchange rate (red). Up denotes a strengthening of the dollar. Changes are interpretable as percentage change, i.e., a change from -0.04 to -0.00 represents a 4% appreciation. Source: Federal Reserve Board via FRED, Pacific Exchange Services, and author’s calculations.
The appreciation since July looks substantial on a broad basis — 7.8% in log terms, bringing the value back to where it was in the wake of the Lehman collapse. Figure 2 provides a longer view.
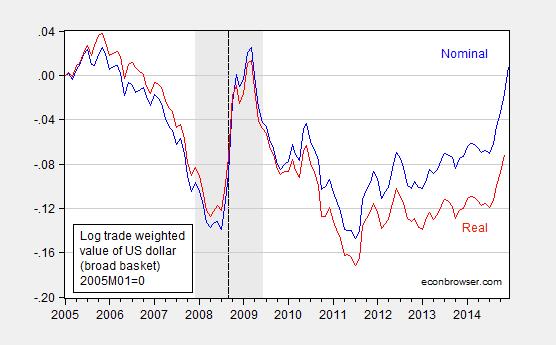
Figure 2: Log nominal value of US dollar on trade weighted basis against broad basket of currencies, 2005M01=0 (blue), and real (CPI deflated) value (red). Up denotes a strengthening of the dollar. Changes are interpretable as percentage change, i.e., a change from -0.25 to -0.20 represents a 5% appreciation. Vertical dashed line at Lehman. NBER defined recession dates shaded gray. Source: Federal Reserve Board via FRED, NBER, and author’s calculations.
In real (CPI deflated) terms, the appreciation is less pronounced; as of November, it’s some 8.4% lower than it was in March 2009. If nominal matches real in December, then it’ll be about 6% lower.
Furthermore, as discussed in previous posts, it’s not clear that CPI deflated measures of the real exchange rate are the most useful for measuring international competitiveness. A more useful concept would be the labor productivity adjusted measure, namely the unit labor cost (ULC) deflated real rate. I plot both series in Figure 3, over a long time span.
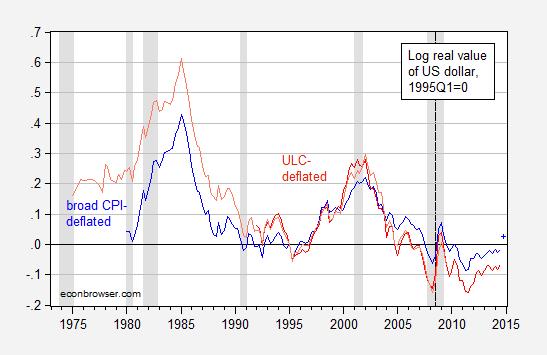
Figure 3: Log real trade weighted value of US dollar, CPI deflated, broad basket (bold blue), estimate based on Fed series change for 2014Q4 (blue +), and ULC deflated, narrow basket (bold red), and ULC deflated, narrow basket, older series (salmon). Up denotes a strengthening of the dollar. Changes are interpretable as percentage change, i.e., a change from -0.10 to 0.0 represents a 10% appreciation. Vertical dashed line at Lehman. NBER defined recession dates shaded gray. Source: IMF, International Financial Statistics, NBER, and author’s calculations.
Here we encounter a trade-off between theoretical advantage and empirical availability. Conceptually, the ULC deflated series is more appropriate for assessing competitiveness, but the calculated series only encompasses industrial countries for which productivity data are readily available (hence omitting China).
Regardless, Figure 3 demonstrates that we are some way away from a deterioration in competitiveness rivaling that of the early 2000’s, let alone the mid-1980’s, using either the CPI or ULC deflated measures (although there will be some reduction in output relative to counterfactual, as discussed in this post). Working the other direction, it might be that US imports are more substitutable with home production, and US exports with foreign production, than in decades past. I suspect that’s the case, but I don’t know of any specific empirical work that validates that view.
Even though the dollar’s value does not yet rival previous peaks, if US output should grow substantially faster than that in the Eurozone and Japan, then expect continued appreciation (see discussion of Taylor rules, output gaps, and exchange rates in this post).
My own personal worries revolve around emerging markets. As noted (e.g., [3]), and appreciating dollar implies a deterioration in emerging market firm balance sheets when there are large amounts of dollar debt. Fixed or semi-fixed exchange rates will mitigate this effect if sustainable; otherwise, pernicious feedback loops are going to be established.
I particularly worry about the dollar appreciation in conjunction with increasing yields in the US. Rising US yields would likely pull financial capital from emerging markets, with particularly negative effects on growth, as shown in Chart 15.4 (from a forthcoming international economics textbook by myself and Doug Irwin).
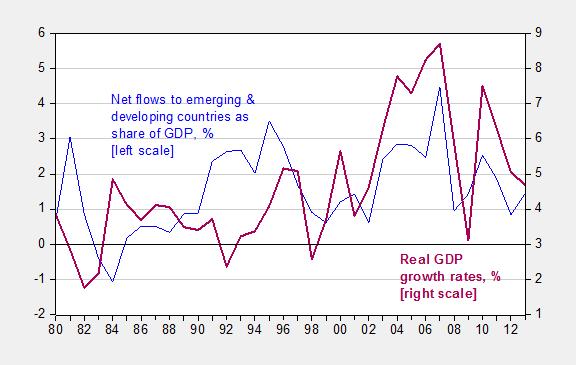
Chart 15.4: Net financial flows to emerging and developing countries as a share of GDP (blue), and real GDP growth in emerging and developing countries (purple). Source: For flows and GDP, IMF, World Economic Outlook, April 2014.
I find it funny back in 2008-9 it was “the world will destroy the US” line while the US is trapped in its own economic hell, but the opposite is the case. Reminds me of the 1990’s evolution. I suspect the dollar has a good deal more to rise over the next 3-5 years.
The USD is heading towards the fiat currency graveyard that has buried all long lived fiat currencies before it. The simple fact is that when you give some group of individuals or institution a printing press and a monopoly over the creation of money you can be sure that they will use it to transfer wealth from those that work and save to themselves and the government via an expansion of money and credit. These types of arguments remind me of the Schiff vs. CNBC-optimists debates in the 2000s. The final destination is inevitable. The only debate is timing and the landscape that the journey takes us through.
https://www.youtube.com/watch?v=fVaSY0eetsA
Vangel: Is that going to happen before or after the QE induced hyperinflation?
It’s not surprising the U.S. is attracting more imports (including cheaper oil that require fewer resources to extract) and capital (with relatively higher interest rates, although they’re still low), along with rich foreigners (who want to live in the U.S.), because the U.S. economy is strengthening faster than the rest of the world.
….including cheaper oil that require fewer resources to extract…
Really? The marginal oil producers are dependent on high oil prices because they require much more energy and other resources to extract it. I have yet to find a single shale oil producer that is economic or has been economic even at $80 oil. Do you really think that you can produce shale at $60 without even more borrowing? And note that we are seeing the beginning of the carnage in the high yield energy bond market. Given the fact that many of the better US jobs were funded by those bonds and that many companies were planning on large capital orders in the sector what happens when this glut hits home in the next few months?
And note that from October 2012 to October 2014 (the last month that has been reported) there were nearly 3,800 wells added to a producing base of 4,796 wells and yet the daily output per well managed to drop from an average of 143 barrels per day to 130 barrels per day. Also note that the wells that have been discontinued are not accounted for in the averages and that their costs have yet to be fully accounted for. The fact is that shale wells have huge depletion rates that are not fully considered when accountants create the depreciation schedules. That is why we see such massive negative cash flows even when prices for the end product are quite high. The bubble has burst my friend and in a while we will have to face the reality. I suggest that it isn’t what you think it is.
Note that the reference to the well counts and production rates are for the Bakken. I hit send too early.
https://www.dmr.nd.gov/oilgas/stats/historicalbakkenoilstats.pdf
Some thoughts here: http://www.prienga.com/blog/2014/12/6/oil-and-the-trade-deficit
Those of us who are hockey fans worry about the dollar’s rise relative to the Canadian loon. A rising dollar lowers the total salary cap because revenues from games in Canada add less total NHL revenues (NHL caps are set in terms of US dollars). That is bad news for us Chicago Blackhawks fans because they have so many high skill players with expensive contracts butting up against a hard salary cap without a “luxury tax” option. Just more evidence that Canada is an important trading partner.
As a major net oil exporter, Canada is going to struggle a bit. Western Canada is going to struggle a lot.
Rising oil production. Increasing oil exports. Decreasing oil imports. Rising dollar.
Luke the Debtor: Decreasing oil production. Increasing oil imports. Rising dollar (late 1990’s).
You’re unfair, the dollar rise in the 1990s was not related to a single entity.
In an open economy with a current account deficit the equilibrium, or market clearing interest rate is the one that attracts sufficient foreign capital to finance the current account deficit with a stable currency.
Looked at this way, the rising dollar is signaling that US domestic interest rates are too high.
I suggest another interpretation. The markets are not free and the central banks are manipulating the rates. The USD is doing better for now because a few other countries are in much worse shape. Given the actual reality, that the cheap oil is gone and that marginal producers can’t survive at $80 oil I suggest that one of the problems that the falling price is revealing is a real contraction in the real economy. Selling $400 million jets to the Pentagon may boost the GDP measure but it does not help the economy. Some of the readers may benefit from Henderson’s postings from the Austrian view.
Vangel: Four quarter GDP growth was 2.6% (log terms); GDP ex-defense grew 2.8%. I don’t see the collapse.
The fog is so frustrating when reading about rising versus a falling currency value in the age of floating currencies. Einstein gave us the concept of relativity. You can only measure rising or falling in reference to a fixed object, but if there is no fixed object then rise or fall is meaningless. Is the dollar rising against the euro, or is it rising against a basket of goods, or are all three rising but the dollar is rising relatively less than the other two.
But don’t we have the CPI? But what is the CPI except another basket of good by another name. How can we know that the CPI is not falling in value only slower than the dollar?
In relativity we normally use our position on the earth as our “fixed point” and so rise and fall and speed are measured against that. Unless there is an equal “anchor” to the dollar such analysis of change in the dollar are virtually meaningless. There are some who do have an anchor to the currency.