Some people have fixated upon the near doubling of the minimum wage after WW II (one person misidentifies the date as 1948, but it’s actually 1950) as a cause of disemployment in certain groups. This may have happened; however, the increase in the minimum wage from $0.40 to $0.75 was not associated with a decrease in general employment, nor of youth unemployment.
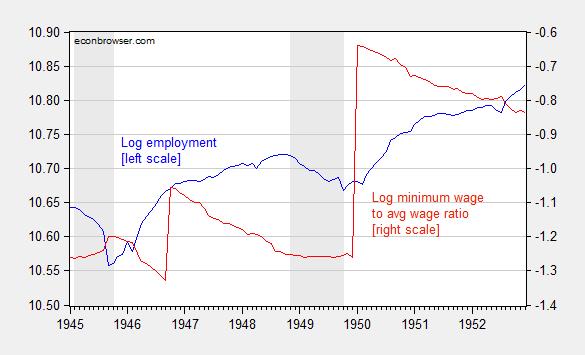
Figure 1: Log nonfarm payroll employment, s.a. (blue, left scale), and log ratio of Federal minimum wage to average hourly earnings in manufacturing (red, right scale). NBER defined recession dates shaded gray. Source: BLS via FRED, and NBER Macrohistory database, NBER, and author’s calculations.
The civilian employment series exhibits the same upward trend, post-minimum wage increase.
Some might argue that youth unemployment rose tremendously as a consequence of the minimum wage increase. At first glance, this does not appear to be the case, according to BLS data (data broken down by race does not go back to 1950).
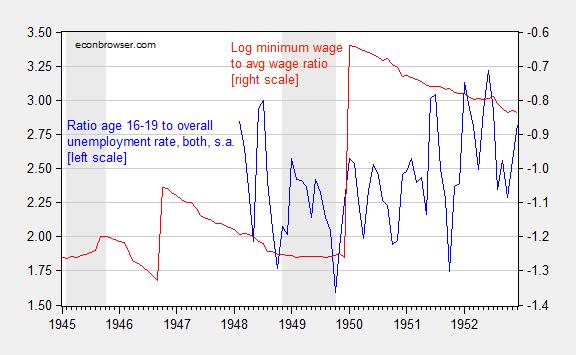
Figure 2: Ratio of unemployment rate, age 16-19, to overall unemployment rate, both seasonally adjusted (blue, left scale), and log ratio of Federal minimum wage to average hourly earnings in manufacturing (red, right scale). NBER defined recession dates shaded gray. Age 16-19 unemployment seasonally adjusted using ARIMA X-12 over 1948M01-2014M11. Source: BLS via FRED, and NBER Macrohistory database, NBER, and author’s calculations.
Time to end analysis by anecdote. We have the data to answer many questions, if only we have the will… and the expertise.
Could we not, Menzie, please discuss Greece?
The Greeks are about to have an election in which one of the topics is the exit from the Euro Zone, which the Germans profess to support, or at least condone.
http://www.reuters.com/article/2015/01/03/us-eurozone-greece-germany-idUSKBN0KC0HZ20150103
Now, I have put up a post with a graph that suggests to me that internal devaluation in Greece is complete.
http://www.prienga.com/blog/2015/1/1/greeces-economic-outlook
You’ll recall, this was a matter of great debate a few years ago, to wit, Ricardo Hausmann’s fine FT piece of three years ago. http://www.ft.com/intl/cms/s/0/ec138fb2-524c-11e1-9f55-00144feabdc0.html#axzz3Nv27HK2a
Now, if internal devaluation is complete, then leaving the Euro Zone would appear to have little benefit to Greece. Or would it? Or do you believe devaluation is complete? Given that Greece is facing a general election in two weeks, how do you see the risks and rewards? What would you advise the Greeks? What would be the downside of leaving? Of staying?
This would seem to be a timely topic suitable for your skills and expertise, no?
Interesting Forbes.com article:
Germany Mistakenly Believes The Euro Could Survive Greek Exit
http://www.forbes.com/sites/timworstall/2015/01/04/germany-mistakenly-believes-the-euro-could-survive-greek-exit/
Jeffery,
I have one word to describe Tim Worstall’s article in Forbes – Zimbabwe!
If only those who claim expertise hadn’t forgotten to account for a crucial event that specifically affected the era’s civilian employment data by removing so many teens and young adults from it. No wonder it’s called the Forgotten War!
Ironman: The minimum wage increase takes place in January 1950; the War starts in June. The trend in the ratio of 16-19 to overall unemployment is flat from January, and if anything, goes the opposite direction as implied by your argument after June.
I didn’t forget that draft. That’s when my father was drafted.
Dig deeper into the data. You should find that prior to the conflict, the Age 16-17 portion of the population was more negatively impacted by the minimum wage increase than the Age 18-19 portion of the Age 16-19 group, which is one outcome we might reasonably expect since these individuals would be less educated, skilled and experienced, than their slightly older peers, who were also negatively affected but to a much lesser degree. But that’s not even the most interesting thing to see in the data….
There are some pretty remarkable things happening within the Age 16-19 population in the years from 1948 through 1954 – specifically, the Age 16-17 cohort and the Age 18-19 (draft eligible) cohort. The impact of the Korean War was to offset the negative impact of the minimum wage hike, which might be expected thanks to the explosion of defense spending, which boosted employment prospects in the U.S., and the removal a significant portion of the Age 18-19 population from the U.S. workforce. It’s really a pretty fascinating period, and one that benefits from being able to see the off-on effect of the re-imposition of the draft – especially as the job-seeking fortunes of the non-draft eligible Age 16-17 year olds turned around as they began filling in the vacuum in jobs left behind by the Age 18-19 year olds who were drafted after the conflict began. A period of opportunity that closed after the armistice.
Ironman: Per your suggestion, I investigated further. I downloaded the data from FRED. From January 1950 (increase in minimum wage) to June 1950 (Korean war outbreak), total number of youth 16-19 year unemployed decreased by 25%; that of all others, by 27% (both calculations in log terms).
Hence, I don’t understand your point.
The purpose of a minimum wage is not to create employment.
It’s to bring better workers into the workforce, raise productivity, employ more capital, create higher skilled jobs, correct a market failure, and reduce exploitation.
There are more powerful factors that influence employment.
However, since the minimum wage was established, U.S. per capita real GDP has grown much faster.
Average annual per capita real GDP growth:
1863-1937 (75 years): 1.33%
1938-2012 (75 years): 2.44%
Source: Census data and the BEA.
Everything nobody seems to know about the minimum wage. The minimum wage was near $11 an hour in 1968.
http://data.bls.gov/cgi-bin/cpicalc.pl?cost1=1.60&year1=1968&year2=2014
Note bene: Barbers in France get paid a lot more than barbers in Poland because France’s more productive economy has a lot more to pay them with. US per capita income has about doubled since 1968 — doubt that barbers are paid much better.
Under pre-industrial Malthusian theory: if population increased one-half, incomes decreased one-third. Between 1968 and early 2007 the US minimum dropped almost in half — under performing Malthus!
http://data.bls.gov/cgi-bin/cpicalc.pl?cost1=5.15&year1=2007&year2=2014
Everything — as in everything Smile
dbl indexed for inflation and per capita income growth:
yr..per capita…real…nominal…dbl-index…%-of (2013 dollars)
68…15,473….10.74..(1.60)……10.74……100%
69-70-71-72-73
74…18,284…..9.43…(2.00)……12.61
75…18,313…..9.08…(2.10)……12.61
76…18,945…..9.40…(2.30)……13.04……..72%
77
78…20,422…..9.45…(2.65)……14.11
79…20,696…..9.29…(2.90)……14.32
80…20,236…..8.75…(3.10)……14.00
81…20,112…..8.57…(3.35)……13.89……..62%
82-83-84-85-86-87-88-89
90…24,000…..6.76…(3.80)……16.56
91…23,540…..7.26…(4.25)……16.24……..44%
92-93-94-95
96…25,887…..7.04…(4.75)……17.85
97…26,884…..7.46…(5.15)……19.02……..39%
98-99-00-01-02-03-04-05-06
07…29,075…..6.56…(5.85)……20.09
08…28,166…..7.07…(6.55)……19.45
09…27,819…..7.86…(7.25)……19.42……..40%
10-11-12
13…29,209…..7.25…(7.25)……20.20?……36%?
The one (big) thing everybody seems to forget is the true free market question for labor: how much will the customer bear, meaning how much business will be lost versus how much labor more labor extracts per amount of business.
The coincidence of the 1949 recession and raising the minimum wage shortly thereafter is very interesting. Perhaps now is the optimal time for a significant increase in the minimum wage.
One way to look at the minimum wage is what the minimum wage buys over time. Right now, the minimum wage is buying more than it was a couple of years ago thanks to the efforts of the oil industry in the U.S. plus the economic problems in Europe which have strengthened the dollar.
http://www.nytimes.com/2014/11/14/business/economy/lower-oil-prices-give-a-lift-to-the-american-economy.html?_r=0
“The impact is especially significant for low- and middle-income Americans, who have been largely left behind by the anemic economic recovery that began in the middle of 2009. Even as the job market has improved, most workers have received only modest wage increases. Median income remains roughly 5 percent below the peak it hit in 2007.”
Bruce Hall: The assertion that the minimum wage buys more than it did a couple years ago is patently wrong. Using the CPI through November 2014, the inflation-adjusted minimum wage is 2.5% lower than it was in November 2012.
Okay… I guess that old liberal rag is just plain wrong.
Bruce Hall: No, the article is correct as far as I can tell as it talks about prospective changes in purchasing power in general. But your assertion that the minimum wage can buy more now than it could two years ago is not validated by the data.
My assertion is that the private and state efforts to expand oil production has lowered the cost of oil-related products. This, according to the NYT, has helped lower income people (including those at MW level) significantly. Does that mean overall buying power is higher now than 2 years ago? No, not based on overall CPI. Airlines have not lowered their ticket prices, but not too many MW people are concerned about that. Buying a home is more expensive, as are new cars, but MW earners won’t be too concerned… especially since used car prices have weakened. Food prices have gone up for a number of reasons, but fuel prices won’t be contributing to higher food prices for awhile.
So, are MW earners better off now? Well, only if they can find better paying jobs which might not be MW jobs at 30% or 100% higher. But perhaps lower energy costs may spur consumer spending which may spur demand for labor which may provide real opportunity for escaping the MW trap.
Bruce Hall: Good point about the plutocratic bias in the CPI, as discussed in this post. However, the bias I find does not seem sufficiently large to overturn the conclusion that the minimum wage in real terms relevant for the bottom quintile is lower than it was two years ago.
So, how does your graph’s increase in employment after the end of the 1945 recession justify your other pet belief that there was no post war boom?
Patrick R. Sullivan: You have seen the graph with industrial production and GDP in the post you commented on earlier; those series fail to respond in the same way as civilian nonfarm payroll employment.
Now let’s return to the still unresolved issue. I am still waiting to hear you admit you were in error regarding depth of the downturn in Canada vs. US during the Great Depression. As you recall, you stated unequivocally:
And this statement is wrong.
Given all the problems with the data for industrial production (how many Ford sedans equal one tank?) and GDP (years of price controls) that several people have pointed out already, wouldn’t the increase in employment be a more informative way to think about it?
Patrick R. Sullivan: Since I am trying to measure total output and expenditure, I think the answer is no; after all, there must have been a lot of production going on in military plants and facilities, but the employment is not measured in nonfarm payroll employment, nor in civilian employment.
I am still waiting to hear you admit you were in error regarding depth of the downturn in Canada vs. US during the Great Depression. As you recall, you stated unequivocally:
And this statement is wrong.
Data does not answer questions when the variables are too numerous to account for in the data. History is history not to be repeated. The 1950s are not 2015. But what we do know is that increased cost reduce demand. We may not know exactly how it will be manifest but the science of human action tells us that clearly that increased cost reduces demand.