Wages in right to work states are lower than those others. After controlling for various factors, the gap remains.
Empirical Analysis of Wage Gap
The Congressional Research Service summarizes the empirical literature in this 2012 report. A recent empirical analysis using micro data from the Current Population Survey is by Gould and Shierholz (2011). Figure 1 presents the wages differentials for right to work states, based on a simple comparison, a model with no controls, a basic model, and a model with full set of controls.
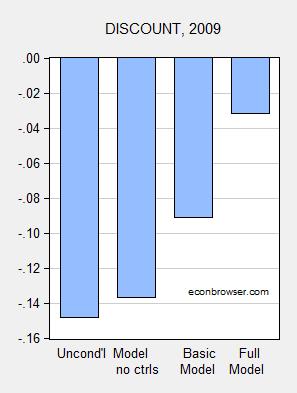
Figure 1: (Log) wage differentials in right to work states, 2009. Basic set of controls include age, age squared, race/ethnicity, education indicators, sex, marital status, urbanicity, hourly worker, full-time worker, union status, major industry, and major occupation. Full model includes the basic set plus state-level unemployment rate and adjustments for cost-of-living differences across states. All estimates in bars 2-4 are statistically significant. Source: Gould and Shierholz (2011), Tables 1 and 2.
Obviously, controlling composition and individual effects changes the gap. In the end, the existence of right to work laws is associated with a 3.2% lower wage rate. This applies to all workers (union and non-union). If one focuses on certain groups, those gaps are more pronounced.
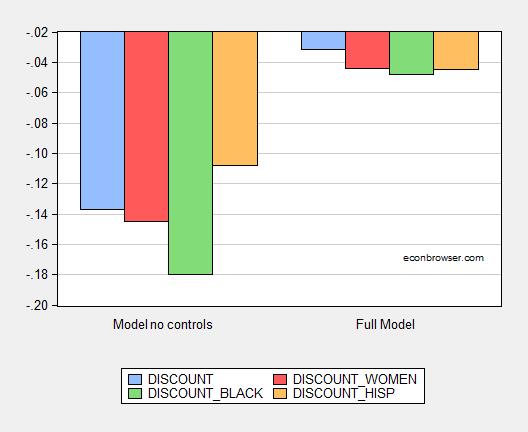
Figure 2: (Log) wage differentials in right to work states, all (blue), women (red), black (green) and Hispanic (orange), in 2009. Full model includes age, age squared, race/ethnicity, education indicators, sex, marital status, urbanicity, hourly worker, full-time worker, union status, major industry, and major occupation, state-level unemployment rate and adjustments for cost-of-living differences across states. All estimates are statistically significant. Source: Gould and Shierholz (2011), Table 3.
In other words, while the impact overall is relatively small, certain groups would experience a substantially lower wage rate as a consequence of implementation of right to work. This finding should not surprising, and in fact might be the intent of right to work law implementation.
See additional data here.
Endogeneity
Now, the first thing one teaches beginning econometric students is (to quote Edward Tufte) “Correlation is not causation, but it sure is a hint” In particular, one could think that states with lower wages might implement right to work laws in the belief that that would produce higher wages. That suggests an instrumental variables approach. In this post, I found that the presence of right to work laws were associated with anti-miscegenation laws in effect in 1947. This in turn suggests that an ideal instrumental variable (IV) would be the presence of anti-miscegenation laws.
I find that raw differential in wages at the aggregate state level are 15.7% lower (log terms) in right to work states, as found in a cross section regression of log wage on a right to work dummy. Adding in a continuous variable for manufacturing share of GSP in 2014 makes the gap -13.7% (statistically significant at 1% MSL, using heteroskedastic robust standard errors).
Now, let’s allow for endogeneity of right to work laws. Using anti-miscegenation laws in 1947 to instrument, one finds that the gap is now -21.4% (it increases in absolute value!), and remains significant at the 1% MSL, despite the fact that the standard errors increase.
Obviously, this is not anything near a comprehensive treatment. However, it is interesting that a first cut accounting for endogeneity does not eliminate the gap.
Update, 3/7 12:30PM Pacific: Michael Wasser points me out to a 2009 paper by Lonnie Stevans which account for endogeneity in a more comprehensive manner.
One might expect that right-to-work legislation would help “revive” a state’s economy because businesses would be more amenable to moving to those states with right-to-work laws. While the results of this study empirically support that right-to-work states are likely to have more self-employment and less bankruptcies on average relative to non-right-to-work states, there is certainly no more business capital formation as measured by the number of businesses and the ratio of firm “births” to total firms in right-to-work states.
Moreover, from a state’s economic standpoint, being right-to-work yields little or no gain in employment and real economic growth. Wages and personal income are both lower in right-to-work states, yet proprietors’ income is higher, ceteris paribus. As a result, while right-to-work states may maintain a somewhat better business environment relative to non-right-to-work states, these benefits do not necessarily translate into increased economic verve for the right-to-work states as a whole—there appears to be little “trickle-down” to
the largely non-unionized workforce in these states.
At least these right to work laws will ban non-compete clauses.
/snark
nah
Menzie
I found the work of the EPI on right to work informative. Mostly, I appreciated the attempt to bring benefits into the package of overall compensation into the calculation, but I think the calculation was incomplete and I raise a couple of issues commented on below. In addition, I found two factors which have major impact of effective wages missing from the author’s report.
Missing.
Union dues. Various information I found from a quick Google search put the cost of union dues on the member between 1% and 5% of wages. Even assuming that the average dues are between 2% and 3%, this alone would significantly impact the reports finding of a 3.2% wage disparity.
Taxation. I did not find that the two (PERI and Missouri Economic Research and Information Center) Cost of Living studies used by the report included differences in overall taxation between RTW and non-RTW states. Quoted from the report, “PERI used Fair Market Rents, which consider housing and utilities prices, to construct a state-by-state cost-of-living adjustment.” which excludes taxation. And quoted within the Missouri Economic Research and Information Center 2014 COST OF LIVING INDEX report, “EXCLUSION OF TAXES: C2ER is fully aware that state and local taxes are an integral part of the cost of living, and that tax burdens vary widely among states and metropolitan areas and within metropolitan areas. Due to the multiplicity of state and local taxes, taxing jurisdictions, and assessment procedures, it is not feasible to calculate local tax burdens reliably. C2ER has opted to produce an index that adequately measures differences in goods and services costs, rather than to produce an inaccurate measure that attempts to incorporate taxes levied on real and intangible property, retail purchases, and income. “ I believe that after tax wages is important to the fundamental impact on the of the disparity in wages between RTW and non-RTW states. The question whether RTW states have a lower overall taxation is not answered or even part of the study.
Both of these missing controls is likely to have a significant impact.
Employer-sponsored pensions.
The EPI study puts considerable weight to this variable but I found no definition of it. I strongly suspect it only includes defined benefit plans.
My questions are-
If an employer contributes matching funds to a 401K, should this included within employer-sponsored pensions?
And assuming that the study did not include such a program as employer-sponsored pensions, then did the study of wages and compensation adequately capture these matching funds?
I also found no indication the EPI study included the viability of the defined benefit plans. I think some adjustment should be made if it is found that the expected pension, paid for out of the wages of the employee, will pay significantly less than expected.
Ed
well some of the biggest low tax states, really arent. and one must also include fees, which a lot of low tax tax states seem very fond of (must absolutely include toll roads ‘fees’, since thats a choice by the state to avoid their jobs).
Ed Hanson wrote:
I believe that after tax wages is important to the fundamental impact on the of the disparity in wages between RTW and non-RTW states. The question whether RTW states have a lower overall taxation is not answered or even part of the study.
Perhaps that is because taxes pay for services to the residents of the state. To consider only the cost of the taxes would be an excellent way to put your thumb on the scale, if you were a “researcher” who desired a specific outcome.
Menzie wrote:
Wages in right to work states are lower than those others.
…one could think that states with lower wages might implement right to work laws in the belief that that would produce higher wages.
This is a great example of how Keynesian thought makes economic reasoning superficial.
Are the Japanese better off because they pay their workers more yen than the US pays workers in dollars? Would you consider someone making $50,000 per year in 1900 better off than someone making $60,000 in 2015? Is someone in California (a high wage non-right-to-work state) making $1,000 over the national median wage better off than someone in Tennessee (a right-to-work state) making the median wage?
The Progressive mentality discounts freedom. Everything in the Progressive world is based on dollars; assets are ignored and liberty and freedom are ignored. It is no wonder that leftist states lean away from a citizen’s right to work at his or her own choosing.
“Freedom’s just another word for nothing left to lose. Nothing don’t mean nothing if it ain’t free.”
It’s no wonder that right-wing regimes equate slavery to freedom. Arbeit macht frei.
A wonderful non-response to the original comments. You forgot to mention how Big Labor is combining with Big Media to push Big Bad Millitant Lesbianism on us…or something like that.
Seriously now, you bring up freedom. There’s an inherent conflict between the two sides on this, and I am not sure of a solution that really makes both happy. But that being said, how is it less oppresive to ban workers from bargaining entirely?
is some one in 1900, better off than the some one making 100,000 in 1800? what particular ‘assets’ are you talking about? and what does right to work have to do with some one’s ability to choose where to work? they can still can do it, even if they have to join a union. its like a state mandating they be quiet at night. after all, they can just ‘choose’ to move else where.
DW,
You bring up an interesting point. Someone making $100,000 in 1800 and in 1900 had virtually the same purchasing power. The difference between the two was the production of wealth over the 100 years making goods cheaper and better quality. But purchasing power did not change. Gold stayed the essentially the same price, men’s suits stayed essentially the same price, bread stayed essentially the same price, and on and on. The inflation from 1900 to 2015 is criminal theft when compared to 1800 to 1900.
Ricardo aka RicardoZ aka Dick aka DickF: Aren’t assets measured in dollars (at least in the US)?
Yes, Menzie, but you have to think deeper. Simply increasing the amount of dollars something costs (labor) does not make it different, just as changing the unit of measure (dollars, yen, etc.) As Ed Hanson points out, there are many variables that are left out of the study, and he didn’t even mention that welfare payments are not even considered income. One of the biggest scams the government plays on the people is using statistics that do not include government largess to justify more government largess.
Check this out and ask yourself if the numbers used to calculate income are real.
“Everything in the Progressive world is based on dollars; assets are ignored and liberty and freedom are ignored”.
Oh the irony of a conservative whining about considerations of externalities. Self-awareness ties a noose to the doorknob and jumps on a banana peel.
“This finding should not surprising, and in fact might be the intent of right to work law implementation.”
So Right to Work proponents are racists and misogynistic? I think liberals think and say things like the above quote to make themselves feel better. It is a self-righteous kind of thing. I personally don’t care about Right to Work politics one way or the other, but my gut feeling (no econometrics needed!) is that proponents see it more as a policy that affects their pocketbooks, not other races or sexes.
You took the quote you cited entirely out of context. Why?
Anonymous: Aren’t you the same anonymous who completely misunderstood all my comparative growth rate graphs regarding Wisconsin? If so, please accept my thanks. I laughed for hours after reading that comment!
Oh, well, my gut tells me that the sun circles the earth and the measles are caused by “the humours”. Take that, stoopid econometrics!!!
I am the same anonymous that misunderstood the Wisconsin graphs, and I did in fact totally misread what I quoted above!
Y U no look at right-to-work effect on other variables like employment growth or cost of living?
May I presume it’s because the data did not support your politics?
W.C. Varones: Have letters become very expensive? Why do the pidgin English? In any case, if you are interested in other variables, see the entire paper, and see the review in the CRS report I linked to in the post. Geez.
Menzie,
I didn’t see employment growth or cost of living in the link you provided.
Perhaps because the authors, like you, don’t like the data?
I have read that “Right to Work” laws were part of the plan to defund the opposition party. But, maybe the law makers thought that lower wages would create more jobs for their constituents who in the main were never going to be “High Tech”? How does job growth look?
I think about the anti-miscegenation laws and ponder if they were a response to too many close cousin marriages?
‘…one could think that states with lower wages might implement right to work laws in the belief that that would produce higher wages.’
Why trade higher wages for less employment? That makes even less sense than usual, Menzie. Speaking of which, I see Ironman is back at you;
http://politicalcalculations.blogspot.com/2015/03/the-context-behind-time-series.html#.VPnSjI7EaPU
‘We have to thank University of Wisconsin-Madison economics professor Menzie Chinn, because we don’t think that we could have produced a better chart showing the difference in post-recession economic performance of states that adopted labor, tax and regulation policies preferred by Republicans and states that maintained policies preferred by Democrats, with one set of states clearly coming out on top.
….
‘Given his other comments, we don’t think that Professor Chinn necessarily intended to demonstrate that point, but that’s certainly the inescapable conclusion that one must draw from the level of evidence Chinn has provided…..
‘Looking at the relative economic performance in each of these states and correlating it with partisan control of elective state government offices, we quickly find that Wisconsin is the outlier in the period since 2011. But then, Wisconsin is also the only state to fully switch from Democratic party control to Republican, where the losing party was able to sustain many of its preferred policies, in particular, the state’s tax hikes that took effect in both 2010 and 2011, which saddled the state’s economy with a tremendous amount of fiscal drag given the negative and outsized impact of the GDP multiplier for taxes.
‘That extension in harmful economic policies was made possible by the scorched earth campaign of political protests launched by the state’s Democratic party and its extremist supporters after they lost power at the end of 2010. Their extremist campaign also increased the uncertainty that the state’s businesses faced, amplifying the negative economic climate in the state. ‘
so right to work laws are really about more employment with lower wages. good to know
Perhaps you should acquaint yourself with the laws of supply and demand, dw. Paul Krugman used to be very good on this;
http://www.pkarchive.org/cranks/LivingWage.html
‘ In short, what the living wage is really about is not living standards, or even economics, but morality. Its advocates are basically opposed to the idea that wages are a market price–determined by supply and demand, the same as the price of apples or coal. And it is for that reason, rather than the practical details, that the broader political movement of which the demand for a living wage is the leading edge is ultimately doomed to failure: For the amorality of the market economy is part of its essence, and cannot be legislated away.’
Patrick R. Sullivan: Perhaps you should acquaint yourself with facts. I am still waiting to hear you admit you were in error regarding depth of the downturn in Canada vs. US during the Great Depression. As you recall, you stated unequivocally:
And this statement is wrong.
Menzie just won’t let this go. Rather than discuss issues he brings up non sequiturs, Maybe he is not getting enough food for his food stamps. After all he want everyone in the country to be on government food stamps.
Patrick R. Sullivan: Hmm. Why do certain people obsess on 2013, and yet ignore highly relevant fiscal policy measures implemented in 2011? Could it be those measures prove troublesome for the thesis that if only taxes are cut, things will be fine?
On another matter, I am still waiting to hear you admit you were in error regarding depth of the downturn in Canada vs. US during the Great Depression. As you recall, you stated unequivocally:
And this statement is wrong.
‘Why do certain people obsess on 2013, and yet ignore highly relevant fiscal policy measures implemented in 2011?’
Pot, kettle, black.
Patrick R. Sullivan: I am willing to allow that tax cuts impact all sorts of variables, including on the budget deficit. On the other hand, you remain unwilling to concede your circulation of falsehoods.
In that regard, I am still waiting to hear you admit you were in error regarding depth of the downturn in Canada vs. US during the Great Depression. As you recall, you stated unequivocally:
And this statement is wrong.
Pot, kettle, black. Again.
Patrick R. Sullivan: Pretty witty!
I am still waiting to hear you admit you were in error regarding depth of the downturn in Canada vs. US during the Great Depression. As you recall, you stated unequivocally:
And this statement is wrong.
I think, raising the minimum wage, reducing unions and limiting government jobs would help narrow the disparity between overworked underpaid workers and underworked overpaid workers.
Hanson,
Union dues. Various information I found from a quick Google search put the cost of union dues on the member between 1% and 5% of wages. Even assuming that the average dues are between 2% and 3%, this alone would significantly impact the reports finding of a 3.2% wage disparity.
Look deeper, and you’ll find that to be ideological exaggeration. Try about 1% Also, look at the wage differential between union jobs and equivalent non-union ones.
Unions have lots of flaws – most of them reflecting our society in general (participation apathy being the biggest one). But, in regards to their raison d’être: Good wages for their membership, they clearly, objectively, succeed.
Uh,oh. Danger alert. Ed Hanson is attempting to do math again.
“Various information I found from a quick Google search put the cost of union dues on the member between 1% and 5% of wages. “
Actual starting rates for union dues average a little less than 2% of base pay. But this ignores the fact that there is also a monthly cap, typically $40 to $50 per month. The average annual dues for all unions is less than $400 per year, which works out to less than 1% of wages annually.
“Even assuming that the average dues are between 2% and 3%, this alone would significantly impact the reports finding of a 3.2% wage disparity.”
Sheesh, could you be any more dense? The wage disparity is for all workers, not just union workers. Given that union workers are only 11% of the workforce, this means that unions are benefiting non-union workers who pay no dues at all. So if 11% of workers are paying 1% of wages in dues and increasing total average wages for all workers by 3.2%, that implies roughly a 30 to 1 payoff for union dues. Quite impressive.
This also means that dues paying union workers are carrying the burden for benefits accruing to many non-union workers. So-called “right to work” laws are intended to undermine union participation by the unfairness of the increased number of free riders. Why contribute when you can get a free ride? Of course that leads to the intended death spiral.
(1) Where is the complimentary study on the effect of RTW on employment?
(2) I find it curious that authors rely on mean wages for this study but rely on median wages when they want to show rising inequality. Wage skewness increases with education and Non-RTW have, on average, higher educated workers which could more than explain the 3% difference.
Hilarious.
Perhaps voters in Right-to-work states believe that cheap labour is good for the economy. Or believe that getting rich quick and positive economic outcomes are correlated.
Ed Hanson The 3.2% differential applies to ALL workers, both union and non-union. You seem to be misinterpreting it as only applying to union workers. In other words, the union dues are irrelevant because both those who pay union dues and those who don’t are affected by the same amount.
Ricardo Read the footnote. The full model accounts for cost of living differences across states.
Menzie After reading some of the comments here my take is that a lot of your readers are not understanding the econometrics lesson. You might need to explain. The assumption is a benevolent governor who wants to increase wages in a low wage state by instituting right-to-work-laws. This potentially creates an endogeneity problem because you cannot tell whether it is the right-to-work status that is creating the low wage, or the fact that of low wages leading a benevolent governor to try a right-to-work solution. The way to resolve that endogeneity problem is to find a variable (anti-miscegenation laws) that is correlated with the explanatory variable (in this case the right-to-work dummy) but should not be correlated with the dependent variable (wages) under the given assumptions. Your model fails. What does that imply about the assumption of a benevolent governor looking to raise wages through right-to-work laws? What does that imply about the racial motives of the so-called “benevolent” governor?
…”the union dues are irrelevant because both those who pay union dues and those who don’t are affected by the same amount.”
Union dues are very relevant to the net income of those who pay those dues. Those who pay dues are definitely affected by the amount of dues they pay. That may explain why many of those in RTW states choose not to pay those dues—it is because those dues are quite relevant to them.
viv, as noted above, most folks pay a dues in the range of 1%. this is not sufficient to change a standard of living, although psychologically nobody enjoys less money. somebody who expected a 3% pay raise and only got 2% does not suffer a change in living standards, and has paid the equivalent of union dues. many people in RTW states who do not pay dues are simply willing to be the leech, enjoying the benefit of union contracts without the cost. my guess is many of those folks would change their tune if they were no longer actually represented by the union-ie they had to negotiate their contracts individually with the company. once that loss of leverage was witnessed, and they see how much greater leverage the company has at the negotiating table, they most likely would change their tune? or do you honestly believe they could negotiate a better salary individually? on a related note, i simply fail to understand why so many folks are adamantly against the organization of labor, while a company management can organize capital and use its power collectively at will, no questions asked.
Vivian Darkbloom Union dues might very well be relevant to the people who pay them, but they are irrelevant for purposes of the study. That’s because they exactly cancel out. Remember, according to the authors the right-to-work status reduces wages by 3.2% for BOTH union and non-union workers. The study is not asking whether union workers are better off than non-union workers. The study is saying that wages are lower for all workers in right-to-work states. That means a worker’s wages are lower irrespective of his or her status as a union member. Understand?
They certainly are not irrelevant even if the study concluded that wages on average for *both* union and non-union employees are 3.2 percent higher. That conclusion was an *average* and that does not necessarily mean that *each* of union and non-union employees enjoyed 3.2 percent higher (net of dues) wages. The study focuses on gross (before dues) wages, not on net. From the study:
“Using the average wage in non-RTW states as the base ($22.11), the average full-time, full-year worker in an RTW state makes about $1,500 less annually than a similar worker in a non-RTW state.”
If one wants to average the net of union dues wages of two employees–one paying (obligatory) dues and another not paying dues and both have $100 gross wages, what is the average net of dues wages of the two if the union dues of one is $2? $100 or $99? You may argue that the effect is not very large, but you cannot argue that it is “irrelevant”. The 3.2 percent figure you cite does not factor in the effect of union wages. Period. The study does not even mention the effect of union dues on union members or on the average. By excluding dues, one is bumping up the average more in non-RTW states than in RTW states. The study conclusions are debatable on other grounds, but the comment that dues are “irrelevant” is clearly wrong. Understand?
I don’t think you understand the concept of fixed effects.
I don’t think you understand simple arithmetic.
The Gould and Shierholz paper examined the wrong issue (as did a previous paper of mine). The issue is whether wages rose more in RTW states than in non-RTW states (note: wages in RTW states could still end up lower while still growing faster).
Unfortunately, we really don’t have data covering the whole post-WWII period to answer that. The closest paper is probably Reed (2003) who controlled for wages prior to the RTW law (as well as other factors existing prior to the law) and found wages in RTW states rose more.
RTW laws were designed to attract firms. Holmes (1998) paper comparing counties across state boundaries found that probably RTW laws did attract manufacturing jobs. So RTW laws probably work in that sense. However, I would not expect RTW laws to cause wages in RTW states to be higher: there is a lot less reason to locate in a RTW state if wages there are the same as non-RTW states.
It is amazing to me that any professional would post data like this, and especially amazing that a professional would try to draw serious conclusions from it. There are too many other potential variables that have not been considered.
This is perhaps one reason few people take economists seriously. And I’m not a fan of right-to-work.
Scott Freelander: I’m sorry, I’m not sure which data set you are commenting on. If it’s the Gould/Shierholz paper, well, I think there are plenty of controls. If you are talking about the simple cross-section regression, then I will freely admit it is not comprehensive (I think I admitted that), and that there are likely many omitted variables. However, I think you misunderstand the econometric exercise in this instance; it is to identify the impact of right-to-work on the wage rate, not to obtain a high coefficient of correlation. If I omit variables that are of importance for log wage rates but are not correlated with the (instrumented) effect of right-to-work laws, then I do not have omitted variable bias, and I obtain a consistent estimate of the right-to-work coefficient.
So please articulate (if you can) the specific econometric problem you see, and I will be happy to engage in an intellectually non-vacuous fashion. You might also wish to consult 2slugbaits’ comment for reference.
Query:
We are talking about wages only and not total employee compensation, correct?
One of the major advantages of being a union member is the total compensation package, which is generally superior to what is offered non-union workers.
On the other hand, employers in a non-union situation may be able to raise wages at a marginally faster rate due to the lower total compensation cost.
[Historical footnote: Health insurance coverage spread extensively in white-collars industries in no small part due to the desire of management to preempt union organizers]
‘One of the major advantages of being a union member is the total compensation package, which is generally superior to what is offered non-union workers.’
Aka, rents. Only available if you can manage to be a monopoly.
Patrick R. Sullivan: I am still waiting to hear you admit you were in error regarding depth of the downturn in Canada vs. US during the Great Depression. As you recall, you stated unequivocally:
And this statement is wrong.
Sullivan,
More aptly:
“We must, indeed, all hang together or, most assuredly, we shall all hang separately.”
Clearly you’re not reasonably well informed about the history of the union movement, or theory and practice of labor economics.
Shame.
Second Look, you might want to take a second look at the source of your quote. It had nothing to do with unions.
Socio-cultural values shape preferences. Not all variables considered by economists to be economic are necessarily economic. There can be deeper forces at play. Take right-to-work. With just three socio-cultural variables one can predict right-to-work states with 80% accuracy. Is there a parsimonious model of economic variables this accurate? On the basis of this model, Alabama, Louisiana, Mississippi, and South Carolina would become more right-to-work if they could. California, Hawaii, Massachusetts, New York, Rhode Island, and Vermont will in this life never be right-to-work. With Wisconsin going right-to-work, there are now an equal number in each camp. Where is this going? Kentucky (.71), New Mexico(.67), Pennsylvania(.59), West Virginia(.56), Minnesota(.55), Ohio(.52), and Missouri(.51) are the next right-to-work states (probabilities in parens).
The topic is right-to-work. Since the spoken word resonates in the psyche, words are indescribably important. Some have deep archetypal roots, and are laden with extraordinary subliminal potency. In the context of right-to-work, the Bill of Rights comes to mind. I propose the main flow is socio-cultural>political>right-to-work. The political composition of state legislatures and governorships is a transmission variable, a necessary yet imperfect reflection of the deeper causal ones. The paper that’s cited says wages are 3.2% higher in non-right-to-work states. QED. Why don’t you fools see that? Well this is why. To be explicit, there is more to the throughput than mere economics. There is ongoing protection and nourishment of deep-seated values.
What this brings up is: (1) Better to at least feebly grasp the deeper goings on of the universe than be a grandmaster at technique. How good are 20 (count ‘em!) statistically significant variables explaining a 3.2% wage differential, when atop this tree is but one coon while in the next tree over are a half dozen? (2) Politicians and advisers might then note that on this issue they can resonate with voters on a deeper turf than just economic. (3) And a final observation – an out-of-the blue complement to Ricardo. Oftentimes his comments are “dyslexic.” Sometimes a little awry. Perhaps not fully thought out or data backed. Participles, if you wish, just dangling there for prissy school marms to pounce on. All the same, replete with brilliant flashes of insight! What I see is that Ricardo sees a lot others don’t see. This seemed to be the time to say that.
Menzie: Is the better dependent variable to look at wages or wages adjusted for local cost of living?
Vivian, it seems you are concerned about the cost of union dues in the results. Average annual union dues are about $400. Since only about 11% of workers are in unions, if you spread the dues over all workers, that averages to about $40 per worker. Yet the average worker in the non-RTW state earns about $1500 more. So the $40 average dues is really trivial compared to the increased income benefit to all workers.
Now if instead you want to ascribe all of the dues to just union workerw, then you should also note from Bureau of Labor statistics that union workers earn 20% more than non-union workers. That’s roughly an $8,000 increase in wages for $400 of dues.
Either way you want to look at it, either union members alone or as an aggregate of all workers, the amount of income increase is many times the amount of dues paid. The numbers indicate that union dues are a very good investment with a very high rate of return.
Joseph,
Your estimate on average union dues is quite low. You likely need to double that number. Most union members also pay dues in retirement, so even the reported average during working years (when “wages” are no longer earned) is likely underestimated.
That said, unlike Slugbaits, you seem to grasp simple arithmetic. As I said, you can argue about the size of the effect, but you can’t argue that it is “irrelevant” to the 3.2 percent number because “everything cancels out”. It doesn’t.
As far as union dues “paying for themselves” (for whom?), that’s an open question. Many people in RTW states who opt out of dues don’t seem to think so. Are they irrational? The study cited by Chinn is contradicted by others he didn’t mention. And, for economic and social policymaking, the question is not whether “union dues pay for themselves”. The proper question is whether union dues (or, better, mandatory union dues) are good overall for the economy and for society. I can easily argue that my carefully directed campaign contribution “pays for itself”, but that’s not an argument that it’s a good thing overall. The argument that mandatory membership in unions drives up wages and that is a net benefit to everyone strikes me as another variant of Charles Erwin Wilson’s adage that “What’s good for General Motors is good for the country”. Would you and Menzie agree with that proposition if we replaced General Motors by any other major corporation? I doubt it. As others have noted, there are many other variables to consider than the narrow returns to union members or even the narrow category of worker wages (apropos that, one of my favorite union lines is the one where teachers unions argue they are “organising for the kids”). From my perspective, the bottom line *economic* question of unions and mandatory dues would be this: does that setup increase broad economic productivity which is a benefit to the entire economy? Frankly, I am skeptical that adding another layer of bureaucracy and costs would increase productivity (in the broadest sense and after deadweight losses) but that’s a point worth discussion: http://www.economist.com/blogs/freeexchange/2007/02/do_unions_increase_productivit
Everything else, as here, is simply an expression of narrow politic preferences. Selectively choosing your issues, variables and time frame (essential to obscuring cause and effect) and, as here, selectively reporting studies in an effort to steer the political issue your way is largely what economic punditry is about. Ninety-nine percent of what goes for “economics” is really just politics in disguise, in particular the on-going battle between labor and capital and the quest for dedicated political contributions and allegiance for those who want to gain and retain power. This case is no exception, alas.
Do unions “increase broad economic productivity which is a benefit to the entire economy?” This goes straight to the heart of the matter. It is the quintessential question in this context. Benefiting all society is what Smith, Ricardo, Pareto, Menger, Wicksell and virtually all great economists no matter of what school devoted their lives to.
“Ninety-nine percent of what goes for “economics” is really just politics in disguise.” Taken in the spirit in which it is spoken, you hit the nail squarely on the head.
Your link led to a 2003 paper by Barry Hirsch, “What Do Unions Do for Economic Performance?” It is beyond dispute that management acquiescence to union demands in Michigan decimated the US auto industry there. But this is partial evidence, and Hirsch casts a far wider net. From the Hirsch paper: (1) “The empirical evidence does not allow one to infer a precise estimate of the average union productivity effect, but my assessment of existing evidence is that the average union effect is very close to zero, and as likely to be somewhat negative as somewhat positive.” (2) “ … evidence presented below indicates that union companies in the U.S. have performed poorly relative to nonunion companies.” (3) “The conclusion that unions in general raise productivity substantially rests almost exclusively on the results of the influential Brown and Medoff (1978) study. … Absent this study, it would have been difficult to sustain the conclusion in What Do Unions Do? that in general unions raise productivity.” (4) “But unionization is associated with lower rates of investment and accumulation of physical and innovative capital. This indirect route is primarily how we obtain slower growth in sales and employment in the union sectors of the economy.” (5) “Although results vary, studies typically obtain estimates suggesting that union firms have profits 10 to 20 percent lower than in nonunion firms.” (6) “In short, there is little evidence from either product or labor markets to support the hypothesis that profits associated with industry concentration provide a source for union rents.” (7) “Linneman et al. (1990) show that employment declines have been concentrated in the unionized sectors of the economy; nonunion employment has expanded even in highly unionized industries.” (8) From the Linneman paper: “ … this study tests the hypothesis that the steep decline of union employment shares since 1973 is related to increases in union wages relative to nonunion wages. … The increase in the premium explains from 21% to 64% of the decline in union shares depending on the equation specification.” (9) Back to Hirsch: “Other things equal, the typical unionized firm has 6 percent lower capital investment than its observationally equivalent nonunion counterpart. (10) “These deleterious union effects on capital investment have been confirmed in subsequent U.S. studies.” Followed by: “Fallick and Hassett (1999) examine changes in firms’ capital investment in response to a union win in a certification election. They find a substantial reduction, likening the effects of a vote for certification to the effects of a 30 percentage point increase in the corporate income tax.”
Well, this is interesting, I thought. Fallick and Hasset focused on certification. What about the opposite, decertification in the sense of taking an entire state right-to-work? My hypothesis (without having seen the data aforehand) was that growth picked up in the latest two states to go right-to-work, in both absolute and relative terms. I used the Philadelphia coincidence data, with base year of 2012 as this was the year of “decertification.” Indiana 2012 .031, 2013 .034, 2014 .041; Michigan 2012 .038, 2013 .037, 2014 .058; US 2012 .028, 2013 .029 2014 .034 (Dec to Dec log changes). It was beyond the scope of this analysis to use conditioning variables, which I certainly recommend for completeness. Having said that, growth accelerated in both states twice as fast as the US overall.
Odds are a year from now, Wisconsin will be able to look back and see a similar acceleration.
It is most interesting that economists worship at the altar of Ricardian comparative advantage, and so allow jobs of Americans to vanish and reappear abroad, with the profit share then ballooning accordingly onto the balance sheets of multinationals, who are not even taxed to compensate those losing jobs here; whereas those exact same economists fight to the death for the rights of unions, whose sole raison d’être is the supposed necessity to countervail against those selfsame corporations, who it is claimed would otherwise without right-to-work laws to offset their power achieve that very same corporate share end.
And how many of these selfsame economists ever did a day’s honest manual labor? Amongst the work crew building a highway or bridge, or rearranging the scenery on a movie set? In so doing, observing the marked difference in make-work from true work that so punctiliously and unlike anything else differentiates the union job from the non-union? That no matter still justifies 3.2% higher wages and the laws that enable them. Because mind you, we in our gristmill have turned out an all-encompassing reduced form equation, with status equivalent to the tablets brought down from Mount Sinai, that says so. And therefore it must be so.
Oh, what a tangled web we weave. When first we practise to deceive!
JBH: Oh. I guess I’ll rip out the sections of my undergraduate international economics textbooks on Hecksher–Ohlin, as well as monopolistic competition, since you tell me I worship on the alter of Chapter 1 only…
I think I worked a day in a factory. Pretty sure I worked many days in a factory. Wore a hardhat. Does that qualify me to analyze data?
Whether Canada suffered more during the Great Depression than the US is actually an opinion not a statistical certainty.
GNP
US down 37%
Canada down 40%
Unemployment
US 24.9%
Canada 27%
Note: in the US 7% of the employed were in government make-work programs so true unemployment numbers are questionable.
Canada’s export growth was less than the US from 1929-1933 but higher during 1935-1939
Canada’s imports were significantly below the US form 1929-1939
Canada’s investment was greater than the US in 6 out of 10 years from 1929-1939
The total hours worked in Canada were lower than the US for 1929-1933 but higher from 1933-1939
Canada left the gold standard in January 1929 but the US left the gold standard in April 1933 restoring itin January 1934 (only 9 months, but devaluing the dollar from $20/oz to $34/oz).
The Canadian dollar depreciated 15% against the US dollar from 1929-1931 but recovered it value by 1935.
In the US 9,000 banks failed. In Canada there were no bank failures.
In conclusion:
. if you held gold in the US you suffered more than in Canada.
. if you had money in a bank in the US you suffered more than in Canada.
. If you were a worker with savings to get you over the hump of 1929-1933 you were better off in Canada than the US.
Of course neither country had food stamps.
In January 1934 the gold parity was set at $35/oz. My post above was a typo.
patrick argued the canadians survived the great depression better with a gold standard and no central bank. ricardo, your reply does not support the argument made by patrick one bit. the bigger picture here is when somebody distorts the facts to enhance their argument. this is what patrick did. but rather than say, oops i was wrong, he simply has doubled down. so how do we know anything is valid with respect to patrick’s comments? he has shown the facts do not matter to him. and that is why menzie has not let it go. foolish pride really.
The BEA has started publishing regional price parities by state.
This adjust for differences in the cost of living in various states.
Using their data I found that real adjusted per capita income was 99% of the national average in right to work states and 103% of the national average in the other states.
Interestingly, North Dakota is a right to work state and their real income is 139% of the national average. It has the highest per capita real income of any state. Connecticut is second at 125%. Wyoming and Massachusetts are third and fourth at 120%. North Dakota adds two percentage points to the right to work states average. If you remove North Dakota from the average the right to work states average is 97% of the national average.
These calculations equally weights the various states and it would be interesting to see what happened to the average if they were population weighted.
What amazes me about this whole string of posts is how an absence of liberty and freedom becomes secondary to econometric Sudoku. I imagine if governments mandated that every person in the US had to eat 3 green beans every day we would see no impact on employment. So does that make it a good law. What ever happened to the love of liberty and freedom? Why have those who claim to be liberal turned to the love of government and a blind faith in government’s infallibility? Why has the totalitarian attitude replaced the liberal lifestyle?
Ah, yes, the freedom to make less money.
Reminds me of the primary argument against child labor laws: the freedom of parents to raise their children as they wished.
Scott Walker signs right-to-work bill
Menzie, I feel your pain (from over a thousand of miles away).
Vivian: “Your estimate on average union dues is quite low. You likely need to double that number. Most union members also pay dues in retirement, so even the reported average during working years (when “wages” are no longer earned) is likely underestimated.”
There is quite a range of union dues but an national average of $400 annually is in the ballpark.
http://labornotes.org/sites/default/files/main/articles/averageDuesAndDuesGrowth270.jpg
As for dues in retirement, for some unions there is none, for others it is optional and in a few it is automatically deducted from pension payments, similar to the way Medicare premiums are deducted from Social Security. But retirement dues are trivial, typically a couple of dollars per month. For example GM retirees pay $24 per year while receiving thousands of dollars of pension and health benefits annually. Unions must continue to spend money fighting to prevent benefits from being taken away from retirees, especially health benefits, so dues in retirement for that service are not unexpected.
Joseph,
I looked at a number of sites before I made that comment. One of the very reasons why your number may be low is because it includes retired members who pay reduced fees or none. For retirees who pay dues in retirement, those dues are not counted against “wages” because they are not drawing any. The following recent study is fairly comprehensive. It shows that the average dues paid by *paying members* is about double what you cite. Interestingly, it shows that dues (and union officer’s salaries are higher in non-RTW states (where dues are mandatory for all if the union is voted in) than in RTW states. (see Table 2) Does that surprise you?
The study was published by the Heritage Foundation, which you may consider ideologically biased, just like labor.org. Nevertheless, the data was drawn from BLS.
http://www.heritage.org/research/reports/2015/01/unions-charge-higher-dues-and-pay-their-officers-larger-salaries-in-nonright-to-work-states
Joseph,
What is it you wrote?
Uh,oh. Danger alert. Ed Hanson is attempting to do math again.
I have to say that I have known Ed Hanson for a long time and he is very thorough when he does calculation. Also he is quick to apologize then correct any error he makes. Perhaps you could learn from him….
perhaps you could have a talk with patrick?
Ricardo: “I have to say that I have known Ed Hanson for a long time and he is very thorough when he does calculation.”
Well that explains a lot about the calculations!
Uh Oh! Joseph is trying to be clever again. LOL!!