In my interview with NPR’s Jim Zarolli, the question came up about wage developments. Embarrassingly, I had no opinion, having not looked at the data (I know that doesn’t stop some people from opining; in any case, that question and lots of other stuff didn’t make it into the piece that aired). Well, I looked up the data, and surprisingly the level of real hourly earnings in May 2015 is the same as it was in January 2011(!).
Figure 1 shows the time series for average hourly earnings for all private workers, deflated by the headline CPI. If you think about it, it’s pretty amazing that the real wage is the same even given the dramatic drop in energy prices in recent months.
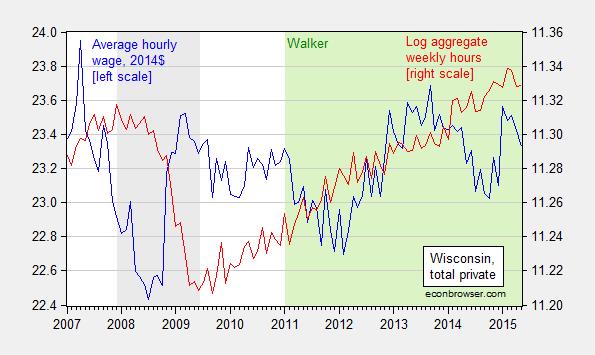
Figure 1: Average hourly earnings in 2014$, deflated by CPI all (blue, left axis), and log aggregate weekly hours, generated by multiplying average weekly hours by number of employees (red, right axis). All data pertain to all workers, private sector. Average hourly earnings and average weekly hours seasonally adjusted using ARIMA X-12 (multiplicative), executed in EViews. Gray shaded area denotes NBER defined recession dates. Green shaded area denotes Governor Walker administration. Source: BLS and author’s calculations.
In contrast to Wisconsin’s real hourly earnings increase of only 0.06% since January 2011, US real hourly earnings have risen 1.8%.
The other series displayed in Figure 1 is a measure of aggregate weekly hours. It’s hard to say given the volatility, but it certainly seems that aggregate hours are declining over the last three months. This is troubling given that data from the household survey validates the conclusion from the establishment survey that employment is declining in Wisconsin.
As an intellectual exercise, it is interesting to ask if Wisconsin can go into a downturn while the US does not. Year-on-year civilian employment growth in Wisconsin did go negative in 1985 and 1998 even while US growth did not (there’s also a short dip in 2004). Hence, it is conceivable that Wisconsin’s path could deviate from the US overall.
Update, 7/15 4:30pm Pacific: If you were wondering how average hourly earnings were evolving in the US, and in Wisconsin’s neighbor, Minnesota, here is the picture.
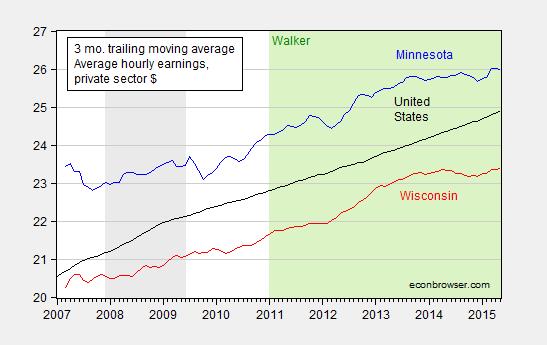
Figure 2: Three month trailing moving average of average hourly earnings, total private sector, in Minnesota (blue), Wisconsin (red), and United States (black). Wisconsin and Minnesota series seasonally adjusted using ARIMA X-12 (multiplicative factors) executed in EViews. NBER recession dates shaded gray. Walker (and Dayton) Administrations shaded light green. Source: BLS, and author’s calculations.
While earnings growth has slowed in Minnesota, in contrast to Wisconsin’s experience, employment and aggregate weekly hours continue to rise.
Wisconsin didn’t go far enough closing the gap between overpaid government & union workers and underpaid non-union private workers.
It should raise the state minimum wage, particularly since real wages in lower-skilled industries haven’t kept up with productivity growth and the state is near full employment.
Also, I may add, some income inequality seems good for an economy.
For example, comparing two most similar economies, the U.S. and the E.U., U.S. income inequality is greater and per capita GDP is over $10,000 a year more than the E.U..
Of course, there may be too much income inequality in the U.S. and too little in the E.U., both reducing GDP growth.
Winston Churchill: “The inherent vice of capitalism is the unequal sharing of blessings; the inherent virtue of socialism is the equal sharing of miseries.”
I agree, there should be an optimal level of inequality. So how do you determine the optimal level.
One way is to make international comparisons. Most economist would agree that there is too much inequality in Latin America that has held back their economic development. On the other hand, Canada has less inequality than the US in recent years and over that period the Canadian economy has dome significantly better than in the US. The Canadian middle class is now better off than the US middle class. The US no longer has the worlds wealthiest middle class.
There is really too much dispersion in the EC to make valid comparisons with the US. But if you look within Europe there seems to be a clear pattern that European countries with lower inequality do better economically than the European economies with higher inequality. Moreover, there seems to be a convergence with the better European economies closing their gaps with US standards of living.
The other way is to look at history. The best historic performance in the US was the post-WWII era when inequality was significantly lower than now.
Of course there wee numerous reasons for the great US performance in the post-WWII era. But, since the late 1970s-early 1980s as US inequality has risen US economic performance has weakened. This appears to be primal-ficia evidence that US inequality is now higher than the optimal level.
Peak trader, what evidence do you have that US inequality is sub-optimal or that the past few decades of rising US inequality has made the US better off?
Spencer, I stated before, since the late 1960s, the real minimum wage has declined 25% in the fast food industry, while productivity increased 25%. So, it’s possible, lower wage workers are underpaid.
Canada is more similar to the U.S. than the E.U.. However, Canada has fewer people than California. Its per capita GDP is slightly less than the U.S.. I doubt Canada is more wealthy. For example, average housing square feet is much less in Canada than the U.S.. Perhaps, there are fewer cars or smaller cars and fewer shopping malls per capita in Canada too.
Too much or too little government can have a negative effect on living standards. Large Western European countries, including Britain, France, Germany, Italy, and Spain, all have per capita GDPs over $10,000 a year less than the U.S..
The U.S. could afford inefficiencies after WWII, because the U.S. had a larger share of the global economy, while Europe and Japan rebuilt. They’re much more competitive today. U.S. economic performance has improved substantially, since the 1970s. including living, labor (or workplace), and environmental standards.
Right, those “union” are so overpaid…….lol. Walker is shill and nothing more. His so called “victory” in 2014 was a pure fluke due to strangely abnormal low turnout and I am already hearing buyer regret from older cheeseheads who voted for him.
PeakTrader: Here are some data germane to your assertion about overpaid government workers.
Menzie Chinn, productivity growth in government hasn’t kept up with the private sector, although some parts of government are better than others.
For example, if fast food restaurants were run by the government, you’d wait longer, receive lower quality, pay a higher price, etc..
How about some evidence rather than a fact free assertion. Hating government is like a religion to you people. Just say the catechism and believe.
Efcdons, why do you love bad government?
I recall going to the post office to buy stamps. They told me they’re out of stamps. I was wondering – don’t they make money on stamps? don’t they mail letters, because of stamps? I’ll need stamps.
I also recall going to the DMV. They told me my Colorado drivers license wasn’t good enough for a California drivers license and I needed a birth certificate. So, I came back and they seemed to be making sure everything was perfect. However, when I went for my picture, I noticed my last name was spelled wrong and told the guy working there. He smiled and darted away. After I received my new license, I was very happy to get out of there, after three hours, and didn’t notice my last name was still spelled wrong. Now, I get all my mail under a wrong name, if people can buy stamps at the post office.
Why are input costs for the public school system so high when output is so poor, why do patients at the VA hospital get so little help, after waiting so long, why does it cost so much for the government to collect taxes, etc.?
“For example, if fast food restaurants were run by the government, you’d wait longer, receive lower quality, pay a higher price, etc..”
not sure about your visits to fast food, but i wait just as long for worse food at a higher price than five years ago. productivity in fast food, at least rated by my visits to mcdonald’s and burger king, has not increased. i would imagine it has something to do with continued minimum wage pay. do you really expect an industry which pays its workers the minimum wage has any possibility to improve productivity? technology can help a little bit, but these are still labor and service intensive operations. on the other hand, i have seen some improvements in services provided by restaurants considered above the fast food level-probably due to higher wages and more experienced employees?
i guess if you want to compare productivity between government and private sector, it is best to compare similar jobs, with similar constraints.
Can you provide us with some data on government productivity changes?
Remember, none of the usual government data sources calculate government productivity, although there have been some one time studies that made reasonable attempts at it.
Actually the US military runs many fast food operations. When you did your service to this great country did you try any of them?
Spencer – having served three years in the army, let me tell you they were terrible but no worse than many of the for profit restauants trying to serve at the lowest cost!
Please, how could anyone lower the quality in fast food restaurants? I thought the basement had already been reached.
It’s all government is bad because i had a blah blah blah. A classic case of anecdotal fallacy.
Just wondering if the state’s wages were adjusted by the state’s cpi or the national cpi?
http://www.aei.org/publication/adjusting-state-incomes-for-taxes-and-price-levels-may-change-our-perceptions-of-which-us-states-are-poor-or-rich/
Bruce Hall: There being no such thing as a state-level CPI, the answer is that I deflated by the national CPI (as described in the text). The RPP’s described in the AEI article are only available at the annual frequency, back to 2008-13, so I could not do the calculations reported in the text for May 2015 if I had used these indices.
Professor Chinn,
As a learning tool, would you mind providing data and the EViews instructions so one could duplicate your ARIMA X-12 seasonal adjustment?
AS: seas(m) x1 x1sa
where x1 is the original time series, and x1sa is the adjusted series.
Professor Chinn,
I guess I am slow. I see how to use the default seasonal adjustment in EViews and the output chart looks similar to yours, but I can’t decipher how to enter the instructions above into EViews. A little more help would be appreciated. Thanks
http://blog.yardeni.com/2015/07/another-weak-revenues-season-excerpt.html
S&P 500 revenues look recessionary again.
S&P 500 reported earnings ex financials and “health” care (prohibitive net costs to the economy now) are at the level of 2011-12.
https://research.stlouisfed.org/fred2/graph/fredgraph.png?g=1sae
https://research.stlouisfed.org/fred2/graph/fredgraph.png?g=1sag
https://research.stlouisfed.org/fred2/graph/fredgraph.png?g=1sak
The previous two times the aggregate of wages and PPI finished goods, CPI, and the 10-year-FF spread were at current levels, the US economy was in recession, the fiscal deficit/GDP was increasing, and the Fed was CUTTING rates and expanding reserves to accommodate deficit spending.
http://www.hoisingtonmgt.com/pdf/HIM2015Q2np.pdf
Hoisington & Hunt are way ahead of the consensus, as they have been for a couple of decades.
The Fed/TBTE banks is/are not going to raise the cost of overnight bank reserve loans under current conditions; or, if they do, they will be required to reverse course shortly thereafter.
The yield curve will not invert ahead of the next recession, as is the normative condition during debt-deflationary regimes (1830s-40s, 1890s, 1930s-40s, and Japan since 1992) and periods of deleveraging (not that much has occurred yet) and “secular stagnation”.
As always, the Fed is not behind the curve but merely following the curve and “the market” as it is influenced by the desires and actions of the TBTE banks and their top 0.001-1% owners.
spencer In today’s military almost all food service is provided by contractors, with the possible exception of a few officers’ clubs. The days of the big mess halls are pretty much a thing of the past. For example, dining at Ft Hood is basically a trip to something that is identical to every food court in every mall, sans the tweens and mall rats running around. But you’ll see all of the mall favorites…Burger King, Taco Bell, KFC, Panda, etc. At my base we still have a few cafeterias scattered around, but they are all operated by contractors today. And the service and food quality is worse than when it was operated by the govt. And the prices are higher.
Peak Trader You might want to double check to make sure those DMV workers are actually state employees and not contracted employees. My experience has been that contracting out inherently govt jobs is the worst of all possible worlds because you end up with the incentives of a monopoly.
FWIW, a few years ago I did a study that I presented at one of those military ORSA symposiums. The study was a stochastic frontier (cost) analysis of the repair shops at various Army installations. I imposed a translog cost function. Some installations rely upon government mechanics and artisans and other installations rely upon contractor operations. In general the govt run repair shops had better efficiency scores than the contractor run shops. I also got consistent results using non-parametric data envelopment analysis.
2slug
“In general the govt run repair shops had better efficiency scores than the contractor run shops.”
this is because as much as some want to complain about government operations, all private contractors who run those operations still have to pay wages to the workers (lower wages at that), but every contract operation runs with an overhead allowance to cover all those “management” expenses. it is really difficult for the government to pay salaries to its own people which exceed the for profit overhead markups currently permitted. this is why the move to “privatize” previous government efforts has not really produced the advertised cost savings, but it has given more flexibility to the hire/fire decisions.
Menzie,
Looks like you have a full blown case of Walker Derangement Syndrome. Perhaps you caught it from your colleague at UW, Sara Goldrick-Rab, whose WSD is documented here.
If you want to rid yourself of the syndrome, it’s very important to calm down, cast out those obsessive thoughts, and try to think objectively. If you do that, you’ll realize that average real hourly earnings isn’t the best measure of the welfare of a typical family. A better, broader measure is real median household income. The data for this series is available annually from the census with the latest data point being 2013. Here is the chart from FRED for the US, which we can compare to the chart from FRED for Wisconsin.
As a Wisconsin citizen, you should be proud to note that under Walker’s leadership from the end of 2010 to the end of 2013, real median household income rose 2.7 percent in Wisconsin while over the same period it dropped 1.3 percent in the US.
That’s the kind of economic outperformance that voters care about.
Rick Stryker: I’m just recounting the data. Do you have an objection to data?
I’m aware of the median household income data. In fact, you should take a look at Figure 6 in this post, despite the fact that I’m a little wary of the data (see notes to the Figure).
I have been thinking of doing a “Wisconsin Recession Watch”. Your comment suggests that I need to proceed, so everybody knows of the economic prospects confronting Wisconsin. Thanks for your input!!
By the way, how’s that 500,000/mo job creation pace going? I’m waiting for you to assert 4% real growth per annum is the norm in the US in the past 20 years…
Menzie,
I have no objection to data per se but I do object to you citing less relevant or cherry-picked data designed to prove some political point. Case in point is your Figure 6. How instructive that you include the neighboring state of Minnesota but you fail to include the neighboring state of Michigan, which saw a decline of 1.3 percent in real median household income.
Rick Stryker: Well, I could expand the universe of states, but Minnesota has pursued a substantially different fiscal and regulatory policy than Wisconsin, and it seemed germane to compare the inputs (policies) and outputs (income growth). But I have tried to be more systematic, as in the panel regressions reported here.
Upon reflection, you are right and I plan to relate ALEC rankings to more variables. Thanks for the idea.
Now, back to 500,000 jobs/mo as a regular pace of employment growth. And you did not address my query about 4% real GDP growth — plausible? Inquiring minds want to know.
I’m sure I’ll never hear the end of this from you, but even though I’m more of a Walker supporter I do feel Jeb’s right that 4% real growth is achievable, not permanently, but perhaps over the upcoming couple of years or so–with the right changes in policies.
Rick Stryker: The 4% growth project alludes to a decade at 4%. This article quotes numbers that seem to indicate that Jeb is projecting sustained 4% growth, and 19 million jobs (396,000 jobs/mo).
Menzie,
If you are not ever going to drop the 500K sillyness, can you at least stop misstating what people say when you inevitably bring this up. I never said that a 500K increase per month was normal in a recovery in the sense that we should expect that in any recovery. And I don’t believe Romney meant that either. Romney meant that with the right policies we should have had a stronger than expected recovery and instead we got one weaker than expected.
Rick Stryker: Then why’d he mention the number 500,000 at all? Mysteries abound.
Menzie,
I’m not much of a Bush supporter so I haven’t focused on the details of what he actually said. No, I don’t think a permanent increase to 4% real growth is realistic.
I think he meant the 500K to be counterfactual. I think Romney was saying that the recovery should have been significantly stronger and in that context we’d should have seen some 500K months if the recovery had been significantly stronger.
Rick Stryker: But as we’ve discussed, and I think you conceded, one had to go back decades to experience anything like that — even on a proportional basis –, and was not even sustained for the 1980’s recovery. So are you just saying it was “aspirational”.
No, not aspirational.
Romney was asked to comment about the employment report that had just been released. He was saying that it was nothing to celebrate. Given the very large output gap, with better policies growth should have been significantly faster than potential for a time and therefore employment growth should have been significantly faster than what we had been experiencing, i.e., we should be seeing or already have seen some monthly employment changes in the neighborhood of 500K. Romney was merely indicting the Administration’s policies as having been unable to create a strong recovery.
I’ve never understood the relevance of saying that “you have to go back decades to have seen growth like that.” Are you claiming that much higher growth was not possible in this recovery?