In Down, Down, Down, I noted Wisconsin’s three month downward trend in nonfarm payroll and private nonfarm payroll employment, and as I cautioned, even this level of employment would likely be further downward revised when the QCEW data were incorporated in the next benchmark. The household survey based data released by the BLS adds yet more confirmation of a decrease in employment (h/t GeoffT). Monday’s newly released Philadelphia Fed coincident indices reflect those labor market trends.
In Figure 1, I present both the civilian employment and the NFP series for Wisconsin.
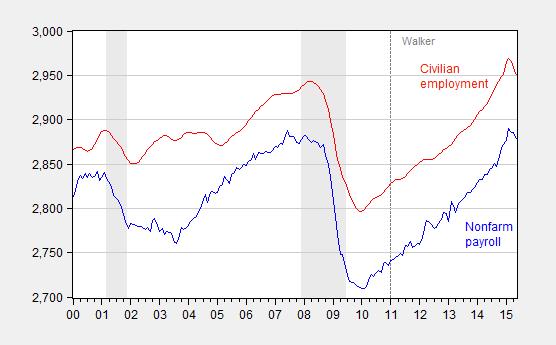
Figure 1: Wisconsin nonfarm payroll employment (blue) and civilian employment (red), both seasonally adjusted, 000’s. Source: BLS.
Notice that both series are declining. Since the civilian employment series is derived from a different survey than the NFP, this adds confirmation to the view that the labor market is not improving, and could very well be deteriorating. However, it is important to recall that the household series at the state level is subject to high imprecision [1] (which is why I do not typically focus on these data).
The last time such a large 3 month drop in the Wisconsin civilian employment rate was recorded — aside from the last recession — was in 1982, at the end of the 1980-82 recession.
By the way, such a marked drop in the civilian employment series is not apparent in Wisconsin’s neighbors, with the exception of Illinois. In that case, the percent drop is about half of that experienced in Wisconsin.
The unemployment rate for Wisconsin ticked up. Of course, the unemployment rate is derived from the same household survey, so the same caveat regarding imprecision applies. However, the trends are probably more reliable, and the trends are clear in Figure 2. Improvement in Wisconsin’s unemployment has stalled.
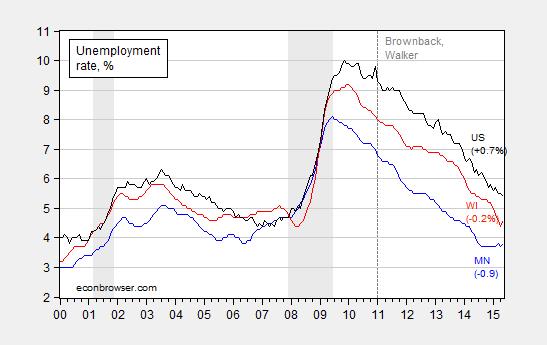
Figure 2: Unemployment rate for Minnesota (blue), Wisconsin (red)< and US (black). Figures are for change in % relative to Nationwide trough at 2007M12. Source: BLS, and author's calculations.
Notice that while Wisconsin’s unemployment rate is now lower than the US, this is true on average — by about 0.9 percentage points. I show this in Figure 3, where the blue line is the US-Wisconsin unemployment differential (positive figures indicate US unemployment is higher than Wisconsin). Hence, it is important to determine whether Wisconsin’s unemployment rate is lower than on average, with statistical significance.
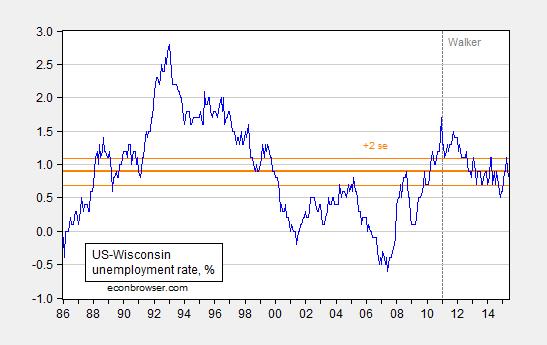
Figure 3: US-Wisconsin unemployment rate differential, in % (blue). Bold orange line is average differential for 1986M01-2010M12; thin orange lines are +/- 2 standard error band. Source: BLS, and author’s calculations.
To the extent that the US-WI differential has declined since 2011M01, this means that the US unemployment rate has come down more rapidly than that in Wisconsin, and in fact the differential was significantly statistically different than zero in favor of the US over the last half of 2014. Currently, the US-Wisconsin differential is at the average level.
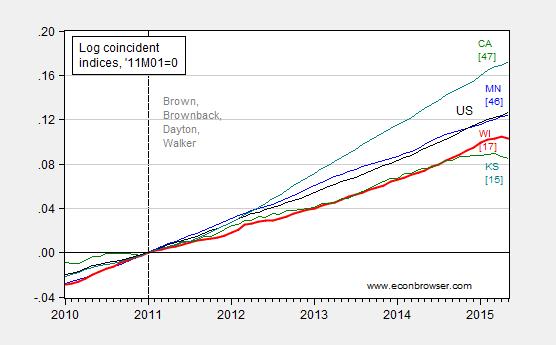
Finally, since labor market data are used in the construction of the Philadelphia Fed’s coincident indices, it’s unsurprising that Wisconsin has now joined the ranks of states with declining economic activity. In fact, it’s one of only 15 states that registered a negative m/m change.
Figure 4: Coincident indices for Minnesota (blue), Wisconsin (red), Kansas (green), California (teal), and US (black), all seasonally adjusted, normalized to 2011M01=0. Numbers in [square brackets] are ALEC-Laffer rankings from Rich States, Poor States 2014. Source: Philadelphia Fed, ALEC RSPS, 2014, and author’s calculations.
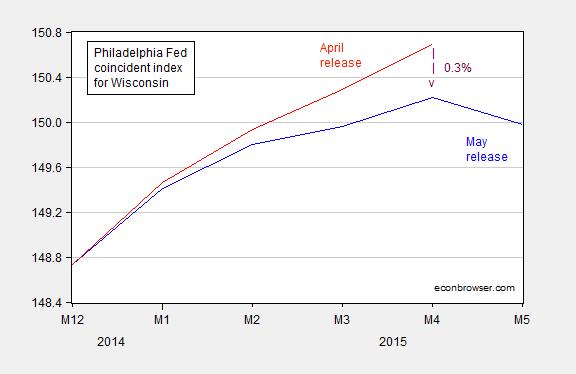
None of Wisconsin’s neighbors share this distinction of m/m decline. Notice the downward movement adds to a downward revision in the March and April index values.
Figure 5: Coincident index for Wisconsin from May release (blue), and April release (red). Downward arrow denotes the % downward revision in April index value (log terms). Source: Philadelphia Fed and author’s calculations.
All the most recent data are subject to revision, so it is too early to conclude that Wisconsin is in a sustained downturn. However, the indicators are at consistent with at least a pronounced slowdown.
Uncertainty regarding the state budget [2] [3], particularly with respect to highway funding, [4] is unlikely to help foster growth. The resolution of uncertainty with respect to taxes, spending and borrowing will come, perhaps not by June 30th (the deadline for passing a new budget), but eventually. However, to the extent that a regime of reducing spending (including on the UW system) to match regressive tax cuts is further tightened, it is hard to see how growth accelerates on the basis of state-specific factors.
“However, to the extent that a regime of reducing spending (including on the UW system) to match regressive tax cuts is further tightened, it is hard to see how growth accelerates on the basis of state-specific factors.”
unless you are a believer in expansionary austerity.
Any chance Prof Chinn that you might switch your attention to, say, Ohio which also has a Republican presidential wannabe?
Or to the dismal finances and outlook of my own Connecticut that has impeccable liberal government and preposterously lousy growth and finances? Or to the UK? Or really to anywhere but WI?
Come on – give your long distance students a break!
c Thomson: CT is 7.5% above 2007M12 level (NBER peak), while WI is only 4.6%. And CT is still growing, unclear for WI. As for OH, it’s over 10% 2007M12 levels, but has apparently stalled at near zero growth in last two months.
Regarding the UK, I’ve had my say:
https://econbrowser.com/archives/2014/03/fiscal-policy-re-assessed
Simon Wren-Lewis has been doing a fantastic job on telling the complete tale of mendacity and stupidity that has occurred since then.
Whatever Simple Simon may say, the English electorate just emphatically rejected his views.
Votes matter. As Walker proved in WI.
c Thomson: I’ll defer political analysis to you. I’m talking economic analysis.
Good thing that Keynes took no interest in the economic implications of politics – or the reverse.
Dismal outlook for Connecticut? Right now, the coasts and northeast are carrying the economy.
C Thomson,
Menzie lives in Wisconsin so it is of special interest to him. His analysis focused on Wisconsin is understandable.
Have a look at Connecticut population trends and private sector job growth – CT is carrying no one.
We want some strong NJ analysis.
home of the extreme version of the non-recovery, recovery.
http://www.biztimes.com/article/20150622/ENEWSLETTERS04/150629988/0/FRONTPAGE
A lot of focus here is on the short term trends. Bloomberg published the Conference Board projections for state employment. http://www.bloomberg.com/news/articles/2015-06-24/these-22-states-will-see-their-workforce-shrink-over-the-next-15-years
Perhaps there is a larger factor in play here.
Eh, not employment, but population growth.