Source: Donald J. Trump, 6 December 2013.
Here’s some data: Global surface anomaly, year-to-date (June):
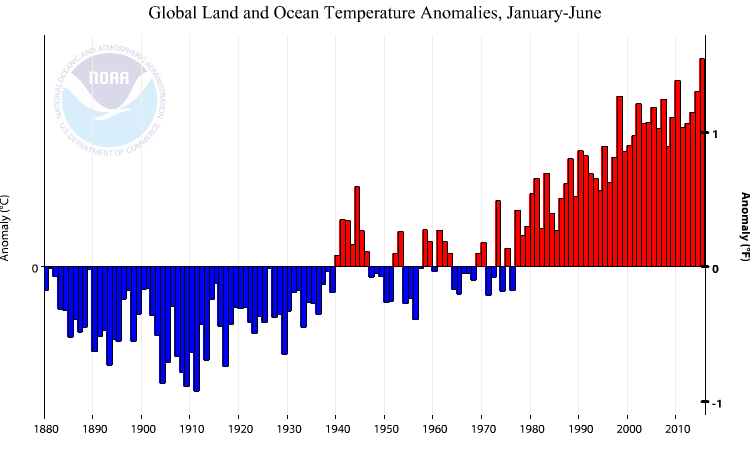
Source: NOAA
If one dismisses the Trump thesis that global climate change is a Chinese plot (6 Nov 2012) (I guess he saw one too many Frankenheimer movies), then perhaps we pay attention to what econometric models suggest. Here’s one by Jim Stock, et al., which concludes:
The results of this analysis indicate that observed temperature after 1998 is consistent with the current understanding of the
relationship among global surface temperature, internal variability, and radiative forcing, which includes anthropogenic factors that have well known warming and cooling effects. Both of these effects, along with changes in natural variables must be examined explicitly by efforts to understand climate change and devise policy that complies with the objective of Article 2 of the 1992 United Nations Framework Convention on Climate Change to stabilize “greenhouse gas concentrations in the atmosphere at a level that would prevent dangerous anthropogenic interference in the climate system.”
Trump’s even more biased & subjective than you, Menzie!!!!!
rtd: Thank you for your typically well-reasoned and substantive comment.
This seems like sarcasm. If so, you don’t think it’s well-reasoned to say TehDonald is more biased & subjective than you.
A well bred southern woman would have used: Bless Your Heart.
Quite possibly, for one who missed the sarcasm. And, as a southern man, I’d say “you’re dumber than a box of rocks.”
If The Donald would cease bloviating, the reduction in the release of hot air would surely moderate the noticeable effects of warming and serve to prove his assertion correct. 😀
I want to make a more nuanced point than the stuff above. One thing that concerns me about GW is that it is politicized. Menzie, you see the bias on the right and I do too. But I worry about it on the left as well. Leftists love finding externalities and rightists want to ignore them. Of course in reality, the physics is going to be whatever it is and do that despite anyone’s political proclivities. Just molecules and fluid dynamics and energy transfer.
I think it is instructive to look at peak oil craze from about 5-10 years ago. VERY few of the advocates of that have fully acknowledged the failed predictions (e.g. the meme of Saudi secret production difficulties). And they generally had a mindset that fit well with belief in peak oil (anti population growth, environmentalist, etc.) But of course resources in the ground are just resources in the ground. And technical development is hard to predict. As are economic drivers. And of course, those on the right had natural reasons for being biased to dismissing PO concerns, sometimes without analysis but from hope. However, wishcasting is a phenomenon (read up on it in election polls) that affects humans in general and on both sides of the aisle.
So. You are a smart guy. But just be careful. Always try to pressure test your own leftists if you are on the left. And your own rightists if on the right. You will likely find occasions where they are wrong. And even if not, you will improve your own understanding and confidence in hypotheses.
Good point. Peak oil was always silly as price would always balance supply and demand. Sadly for all of us, the physics of global warming are pretty undeniable. We need to come up with a way to make acceptance of those facts palatable to the right.
Peak oil is most certainly not a silly concept. Keep in mind that all of US shale oil production is something like 4 mbpd, or about 4% of global oil production. It’s really not that much. As Nony points out, an increase in non-OPEC production can compel OPEC to produce more (ie, migration from a price- to a volume-driven strategy). But that also works in reverse. If shale oil falters, OPEC will have every incentive to revert to a price-driven strategy.
Now, analysts struggle with two discrete problems. One is discontinuous and unpredictable events like revolution in Libya. Will Libya come back on line in any quantity? When? How much? It’s hard to know, but it can affect oil prices materially, particularly in the short run.
The other challenge is, of course, technological progress. Where will the marginal cost of shale stabilize? I could make a case it’s $65 WTI and above. EOG says it’s below $50. which is it? And what’s the relationship between shale marginal cost and system marginal cost? Just because EOG can produce (maybe) at $50, that doesn’t mean that Shell, Exxon or BP can. Goldman Sachs would have us believe that we can operate the global oil system without the IOCs. Depending on whom I include, the IOCs produce 10-14 mbpd. You think the world can write off 15% of its oil supply? I have my doubts.
In any event, it’s very hard to forecast the prospects for and the timing of technological change. The bias tends to be pessimistic, because we tend to over-value the information we already know. It’s hard for me to say to a client, trust me, the shale guys will be able to produce at $15 / barrel less because they’re clever guys. But maybe they are.
In any event, if the shales falter (and that does not appear to be the case at the moment), then we could be back in peak oil country in a very short period of time. We have effectively no spare production capacity anywhere in the world (and at a price trough!). Or as Paul Sankey of Wolfe Research put it, we’re one unexpected outage or OPEC production cut away from the mother of all oil price rallies.
“Peak oil is most certainly not a silly concept. ”
steven you are probably correct. but what is a silly concept is to continue to pursue policy which reinforces the importance of oil (and other fossil fuels) which have a finite shelf life and produce energy price volatility. that is why we need to pursue alternative and renewable energy sources. imagine taking the trillion or so dollars of war money we spent to protect oil reserves, and using that money to research and build out an alternative energy platform here in the usa. oil is really a foolish resource to continue to subsidize. it is an electric and digital world, and oil really has no place in that world in the long term.
You’ll notice that all the talk of secular stagnation had ended, Baffs. US VMT is coming back to trend (I’ll be presenting on this at a McGraw Hill conference in December), and that’s true in the UK, as well. European car registrations are up a whopping 15%. The world economy runs on cheap energy, and most specifically cheap oil. True in ’73, true today.
Now, oil’s a finite resource, but we really don’t know how finite. We’ve probably made most of the great discoveries (at least where the IOCs have some access. Is there really no oil beneath the Rio de la Plata in Argentina?) We’ve known about the Eagle Ford and Bakken for a very long time, but both were considered failed oil systems before fracking. The biggest new potential source of shale oil is the Permian, literally the most important traditional oil production region in the US. All we’re doing in accessing shale layers (and there are several of them) right beneath the conventional wells we’ve been drilling in West Texas for a century.
So, I take your point about dependence on fossil fuels, but we have yet to come up with something better and cheaper.
steven,
we will develop an electric transportation system. it will prove superior to oil based internal combustion engines. the ability to integrate electric motors into the transportation system will make us wish we had never built out our oil based system. granted, it will take some time to make the changeover, mostly due to the oil lobby providing effective resistance. but companies such as tesla, with strong financial backing, will make the transition easier. younger generations, particularly those recent college graduates, have no affinity towards oil based systems and will continue to push for alternative/electric based systems. we will develop a dual energy transportation system in the near future, but a long term dual system will not be acceptable and a choice will need to be made. oil will most likely be on the losing end of that decision. oil has served a purpose in building this great nation, it just does not serve a useful purpose in the future. the future is an electric and digital world, and oil does not appear to be a part of that world.
I agree that a lot of doom predictors get fooled by their own failure to predict future “inventions”. However, you really have to evaluate a situation based on current knowledge rather than counting on getting some kind of unspecified lucky break. Remember that a lot of times those developments are driven by the urgency of needing to solve the “doom” problem. You also have to evaluate the cost of getting it wrong (whether you are for or against” X”).
I agree that it is very unfortunate that almost every single problem ends up being a part of the warfare between the two political tribes. The reality of the world will be whatever it actually is even if one of the tribes manages to “sell” a distortion of it. Eventually that reality will smack us in the face regardless of our willful ignorance, and we will pay a high price for it. Sometimes the consequences for society are a lot worse than a bunch of fact challenged people losing money on their hyperinflation/gold investments.
Finding the truth require a complete abandonment of tribal narratives and a strong urge to simply find the truth. In the current hyper-partisan environment that is extremely difficult to do. Politicians who try that are often rejected from their tribe, so we end up with a congress devoid of statesmen and populated by stupid little schoolyard kids.
Nony,
Climate change/global warming science is not politicised. It is, as you surmise, predominantly physics which last time I checked wasn’t a registered voter. Temperature measurements, model outputs, satellite images and so on are just data, they have no political bias. It is, rather, the conversation around the science which is politicised, to a frankly absurd extent in the USA.
The scam of ‘Global Warming’ has been debunked many times by Prof. Mark J. Perry (an economics professor of considerably higher stature than Menzie Chinn) :
http://www.aei.org/publication/matt-ridley-whatever-happened-to-global-warming/
Separately, Democrats should love Donald Trump, since they desperately need him (he is a shill for Hillary). He will siphon off a few percentage points to ensure Hillary wins the Electoral College with just 47% of the vote or so. He is this generation’s Ross Perot.
Yes and the scam of free markets has been debunked many a time by my local meteorologist. Obviously when exposing a scam the less you know the better, because then you will not bump your little head into irrefutable facts.
I have found time and time again it is prudent to double check the supposed “facts” that Perry’s arguments rest on
But Ive never found Chinn to rest his argument on blatantly incorrect data as Perry regularly does..
Based on this experience I really have to question your assertion that Perry has higher stature than Chinn.
Spencer.
Basing analysis on NOAA numbers is resting an argument on blatantly incorrect data that is constantly being changed to perpetuate the hoax. Today only computer models programmed by biased researchers living off of government largess show global warming. The actual data does not support the hoax. I would say Menzie often cherry picks his data.
Thanks for the laugh. A lightly published AEI hack has “considerably higher stature” than Menzie? Were you referring to his literal height? I suppose it is possible he is taller than Menzie.
No, because Prof. Perry is an economist. Menzie is a leftist.
It is not possible to be both an economist and a leftist anymore, because leftism requires a belief in those two most economically unsound memes : global warming and ‘feminism’ (the ‘pay gap’, et al).
I know Menzie is from the wrong tribe so he must be wrong. I mean wrong=wrong, duuuh. The weight of the data and arguments has nothing to do with right or wrong. Right wing and right, i mean right=right; see how easy it is if you close down your brain.
Even worse, it seems the problem is that Menzie believes in known scientific facts. So never mind that he’s much more heavily published and cited in peer-reviewed economic journals. We should just ignore anything else he says, and instead follow Darren’s link above to a well known right wing political propaganda outfit. I’m sure we’ll get much better information there.
The entire argument can be boiled down to one simple question : Do you believe in the scientific fact that some gases are actually green house gases?
If you don’t then you are not worth even talking to. If you do then you either must come to the conclusion that man made global warming must be happening…..or that something is somehow offsetting the added heat that the greenhouse gases contribute.
if you believe in physics then you must admit that adding more greenhouse gases to the atmosphere Will increase the planets temp. There is no way around it unless you can come up with a phenomenon that explains how the extra energy is being expelled from the closed system that is the our planet.
No anti global warming argument does that. Your link doesn’t. Instead they all focus on cherry picking data or pointing out small errors in the data,and acting like it’s a fatal flaw.
The only possible refutation of MMGW must show how the extra energy is canceled out…..no one has done that. People have tried ..evoking sun spots and volcanoes etc …but none stood up to investgation.
Face it ….some Scientists might be on your side. But science isn’t. And if you bravely and honestly look into it armed with this logic, then you will see there is nothing but obfuscation to the anti man made warming arguments.
Sorry,
Mark J. Perry is not of “higher stature” than Menzie Chinn. He is a prof at a brach campus in Flint of the University of Michigan, frankly a zero nowhere place. Menzie is a professor at the University of Wisconsin-Madison, one of the top 20 economics departments in the US, and probably the world. Perry runs a blog, Carpe Diem, but Menzie participates in one much more widely read and respected. Perry is at AEI, but this is a known hack politically partisan shop.
More substantially, citations to papers published by Menzie are many times more than those to papers by Perry. Perry is a sefl-promoting empty-shirt propagandist.
I see Menzie want to have another Kool Aid drinking contest. I want to point one thing, the words lost in the Climate Change lexicon, 1) Catastrophic and 2) Anthropogenic. Even Menzie’s science reference is years old. Notice the authors, too!
What has actually happened? A around 2005 people, mostly skeptics, noticed there appeared to be a pause/hiatus in the warming. Climate scientists began to research and folks like Kevin Trenberth tried to explain where the EXPECTED warming was hiding. In 2008-9 we saw papers beginning to point to ocean storage and especially deep ocean storage of that ?missing? heat. The PR for the paper https://www2.ucar.edu/atmosnews/news/2013/missing-heat-may-affect-future-climate-change. Climate scientists then wrote several papers on how to explain the pause/hiatus. In the 2014 IPCC AR5 some of this science was referenced, but not heavily covered. But these science papers were already several years old.
Meanwhile the pause/hiatus has continued in the satellite records, while science tried to explain it and each el Nino has excited the Alarmist crowd in the predicting its end. Unsurprisingly, those responsible for managing the surface temperature datasets were n a campaign to discover why they were both diverging from the satellite data and confirming the existence of the pause/hiatus. What they found was even more errors in their own processes requiring further data adjustments. The latest was in NOAA’s own process where they made even another unjustified adjustment to the ocean surface temperatures And since the NOAA adjustment we’ve had another paper telling us we are comparing apples to oranges when comparing the surface temperatures to the models, since the models use an average air temperature and not sea surface as is used in the surface datasets.
In the end the pause/hiatus in the satellite data continues: http://woodfortrees.org/plot/rss/plot/rss/trend/plot/rss/from:1996.9/trend. While the traditionalists want us to concentrate on the overall trend, http://woodfortrees.org/plot/rss/plot/rss/trend they are trying to disappear the pause hiatus and completely ignoring the trend since 2001 http://woodfortrees.org/plot/rss/plot/rss/trend/plot/rss/from:1996.9/trend/plot/rss/from:2001/trend.
So we have had a near loss of the scare term catastrophic, and the causal term anthropogenic in the science, while the traditionalist scientists continue to provide lip service, their efforts are increasingly concentrated upon explanations for the pause/hiatus, and the surface temperature warriors are concentrating on disappearing the pause/hiatus in their data. All of them are claiming the science is firm while their own models, the actualization of the science diverge from all the datasets.
What we see is the hangers-on continuing the story line, while the populace has lost confidence and belief in it. If the cooling continues, and we are seeing peer reviewed claims that it could, this whole tempest may not end well for those desperate for it (CAGW/AGW/GW) to be true.
Interesting times.
The pause is so pronounced that arctic ice is melting! The only desperation on display is the desperation of the deniers.
Since you’re so sure it ain’t happening, you should be buying up coastal property from the wusses worried about sea level rise: you should make a killing taking properties off their poor misguided hands.
Howard,
Why don’t you buy inland. Imagine how you property value will increase when it becomes ocean front.
Come on, it’s pointless to look for a 15 year “trend”. That would never be statistically significant. Using the same kind of warped logic and cherry picking of points, you could just as easily claim a “hiatus” from 1897 to 1932 in the global land and ocean temperature data Menzie shows above. Or from 1941 to 1979. That’s 73 years of supposed “hiatus”, and yet the underlying trend for that entire period is unmistakable.
And funny to see you ignoring the land and ocean temperature data, which diverges from your own silly and statistically insignificant hypothesis, while claiming it is the scientific community which is ignoring divergence. Truth is, it is quite obvious also in the satellite data that there are outliers on the high end around 1998 (the last strong El Nino year), 2003, and 2010 (the last two moderately strong El Nino years), and that your statistically meaningless fantasy hiatus can only be manufactured by picking a start date close to one of these years.
Meanwhile, the long term trend of course remains obvious in the satellite data as well.
And it is flat out quackery to claim that there has been any pullback in the scientific literature from the idea of “anthropogenic”. AR5 says quite plainly “The evidence for human influence on the climate system has grown since AR4. Human influence has been detected in warming of the atmosphere and the ocean, in changes in the global water cycle, in reductions in snow and ice, and in global mean sea level rise; and it is extremely likely to have been the dominant cause of the observed warming since the mid-20th century.”
And “extremely likely” is defined by the IPCC as meaning a greater than 95% chance. So there is no pullback at all in this idea since 2005, the evidence has only intensified since then. As to whether that warming is even occurring: “Warming of the climate system is unequivocal, and since the 1950s, many of the observed changes are unprecedented over decades to millennia.”
Acer, what 15 year “trend”? Selecting what end points? The way the hiatus was defined in the peer reviewed scientific paper was to start from today and look backwards until the trend is not zero and then continue until the trend is statistically significant If you are referring the ~14.5 years of cooling having ~1/2 of the standardized period, 30 years, for measuring climate is significant, although not that unique in the record. What the cooling does do is alter the discussion over how fast we are warming.
Who has claimed the scientific community is ignoring the divergence. I have said just the opposite, and the dataset managers are rapidly adjusting their data to remove it. You further made this claim: “Meanwhile, the long term trend of course remains obvious in the satellite data as well. ” I prefer to say we are wiggle watching especially in our focus on the past ~150 years of records. The actual long term record for this interglacial is clear: http://jonova.s3.amazonaws.com/graphs/lappi/gisp-last-10000-new.png
You then make a claim citing the IPCC and the confidence level they have it has warmed. We are all sure it has warmed since the LIA. The records show that we are on the same slow cooling glide path that has occurred in nearly every interglacial before this one. (My reference directly above). What I am seeing is a lot of this from the ever diminishing alarmist community. https://www.youtube.com/watch?feature=player_embedded&v=Uif1NwcUgMU
Ahaha, yeah that method in the paper was funny (BTW the open journal of statistics is hardly prestigious). What’s even funnier is if you create your own dataset with a known linear trend and add some white noise, and then use that exact same method, then you invariably find “pauses” lasting for a decade or more despite the fact that you KNOW you created a dataset with a linear trend. This is because it’s an ass-backwards method, which is completely ignorant statistically, to a quite laughable degree. If you’re trying to disprove that there has been warming, then your null hypothesis should be that there has been warming (the null hypothesis is always what you’re arguing against), and you then try to use the data to show that the measured trend does not include the supposed rate of warming. The fact that zero is within your error bar does not accomplish this, you need to show that the rate of warming is not within your error bar. This method ends up trying to prove the wrong null (that there has been no warming), which of course it does with ease because with so few datapoints you’re always going to get a massive error in your observed trend.
As for your greenland core nonsense. I will remind you that Greenland is merely one location, and that using the temperature record of one location as a proxy for a history of global temperatures, as you are implicitly doing, is highly fallacious and misleading. A composite of historical temperature records from different locations paints a very different picture: https://upload.wikimedia.org/wikipedia/commons/c/ca/Holocene_Temperature_Variations.png
Given your repeated attempts to deliberately decieve and mislead I can only assume malicious intent on your behalf. You unpleasant little toad.
Sam Taylor, thanks for re-writing my hypothesis to match your own wishes. Surprisingly, you are within a majority of skeptics who believe that climatologists need to be better taught statistics or all papers need to be co-authored by a statistician. Just like Menzie’s reference did. Look how well that predicted!?!
As to your laughable Wiki reference. The major trend line, the heavy black line actually supports the http://jonova.s3.amazonaws.com/graphs/lappi/gisp-last-10000-new.png. I could have shown the Alley graph showing the original data, but it is too busy and less clear than the reference provided.
Most here, as you obviously, won’t realize how in error/laughable is the Wiki graphic. I assume you wanted us to look at the little box showing the past ~2k years. Did you notice the temporal range of all those data? It appears to be in fraction of a century. How does that align with that of the temperature record? Which appears to be annual temperature data. Would that ole scary line be represented using the same temporal range? Answer: maybe but just as a dot or few. Amazing graphical and mathematical slight of hand, is used to generate a straight line upward, and using the whole of the temperature record period when they define BP (the end of the proxy measurement period) as 2004. That means the straight line representing the temp records should only be ~1 decade. Is that even within the temporal range of the base proxy data? I dun thin sew!!!!
Fake in so many ways, and you actually believe: “Given your repeated attempts to deliberately decieve (sic) and mislead I can only assume malicious intent on your behalf. You unpleasant little toad.” because it and much of the science deserves not to be questioned.
You are not only wrong but ignorant for such arrogance?
Sam Taylor, I forgot to add the trend line for the average of the major temperature datasest that should have been included in the Wiki graph instead of the straight line upward: http://woodfortrees.org/plot/wti/from:2004/plot/wti/from:2004/trend That is of course, if it should have been shown at all.
CoRev So what you’re saying is that we should believe a brain dead online trend tool instead of the time series work of folks like James Stock. Right.
Time series issues aside, shouldn’t the burden of scientific proof be on those who deny that CO2 emissions contribute to global warming? The physics in the lab is pretty clear…CO2 has a “greenhouse” like effect and traps heat. You can argue about the earth’s response factors to higher CO2 levels, but in order to be a card carrying member of the denier club you have to come up with an argument to disprove what can be proven in the lab and what is predicted by quantum mechanics. Good luck. I await your science based explanation as to how increased CO2 emissions have no effect on the earth’s temperature.
James Stock? Climate Change? Did you have a specific reference to review? Otherwise I agree: “shouldn’t the burden of scientific proof be on those who deny that CO2 emissions contribute to global warming?” Now how much heating is responsible form CO2? Moreover, how much is responsible from ACO2? When we can answer these tow questions then we can and should develop policy, or not.
Other than the false argument about denying CO2, do you actually have an argument against what I said? If you don’t like the internet tools, there are now two, WFT http://woodfortrees.org/plot/ and SkS’s http://www.skepticalscience.com/trend.php develop your own.
The only group still denying climate change is those who alarmists who deny the existence of the pause/hiatus.
CoRev: 2slugbaits is referring to the article I linked to and quoted in the post you are commenting on.
Menzie, I know what 2slugs an you were referring? did you read my comment and 2slugs and even more importantly your reference? This si from where I was coming: “around 2005 people, mostly skeptics, noticed there appeared to be a pause/hiatus in the warming. Climate scientists began to research and folks like Kevin Trenberth tried to explain where the EXPECTED warming was hiding. In 2008-9 we saw papers beginning to point to ocean storage and especially deep ocean storage of that ?missing? heat.”
2 slugs comment: “So what you’re saying is that we should believe a brain dead online trend tool instead of the time series work of folks like James Stock.”
And your reference paper: 1st sentence: “Given the widely noted increase in the warming effects of rising greenhouse gas concentrations, it has been unclear why global surface temperatures did not rise between 1998 and 2008.”
1st sentence in the conclusion: “The finding that the recent hiatus in warming is driven largely bynatural factors does not contradict the hypothesis: “most of the observed increase in global average temperature since the mid 20th century is very likely due to the observed increase in anthropogenic greenhouse gas concentrations (14).””
So my response is believe the data. Your reference is already old, 2008, and is based upon an assumption that did/has not occurred:
“We find that this hiatus in warming coincides with a period of little increase in the sum of anthropogenic and natural forcings.” From that brain dead internet tool: http://www.woodfortrees.org/graph/rss/from:1997/plot/rss/from:1997.9/trend/plot/uah/from:1997/plot/uah/from:1997.9/trend/plot/rss/from:1997.9/trend/detrend:-0.0735/offset:-0.080/plot/esrl-co2/from:1997.9/normalise/offset:0.68/plot/esrl-co2/from:1997.9/normalise/offset:0.68/trend
Really? Is that what you and the scientists in that paper want us to believe? Had man stopped building, so the Urban Heat Island effect was diminishing? Had ACO2 stopped being released, because we stopped burning fossil fuels? Had man stopped cutting down forests or growing crops, so that land use was no longer a factor?
In re-reading the paper I am further amazed at the bravery of those who base their comments on one reputation, while ignoring that of the remaining authors. And then assume that the methodology used, a stochastic statistical model which ended before the start of the pause/hiatus adds value to the discussion over its existence. What this paper does is highlight my comment how climate science was and still is searching for explanations. To date we are over 60 papers with explanations, and the pause/hiatus goes on.
While discussing the science, we have a good example in Menzie’s selection of Vox and its video: (Dunno if that will take. If not go to his 1st reference and look at the CO2 video. If the embed doesn’t work the same video is here: https://i.ytimg.com/vi/x1SgmFa0r04/hqdefault.jpg) Why is this an example of the quality of the science? It represents what was thought CO2 did before we put up a satellite to observe. Here’s a map of CO2 actuality from the satellite: https://www.bing.com/images/search?q=oco2+map+co2&view=detailv2&&id=0DF076A93774D96239FA206EFCB741D9F45B1038&selectedIndex=0&ccid=BlzXSoqv&simid=608025936513207512&thid=JN.5kWOqn3dLVMwnHF2hin84w&ajaxhist=0 Notice the difference in what we thought were the concentrations versus what/where they are actually?
Isn’t this cute? Corev wants to prove he/she is a climate scientist! Awwww.
Howard are you denying the data too? Even the scientists are studying it to determine what and why caused it. What they are finding over and over is that it is because of natural variability ( a euphemism for NATURE). Where’s the AGW and direct relationship for catastrophes?
I don’t know the particular satellite that you have linked to but it does agree with the output from the JSAT(Japan).
AM, the CO2 satellite is the new NASA OCO2 satellite. The first CO2 reference was to the NOAA/NASA modeled projection. YThis map is even another of the earlier projections of CO2 http://eoimages.gsfc.nasa.gov/images/imagerecords/82000/82142/globalco2_air_201305.png
Notice the difference in what was thought and what the satellite actually measured. In particular look at the equatorial areas.
The satellites show that co2 is emitted in red levels from a and non agw sources with most of it from non agw sources.
AM, that’s as it should be, non-anthropogenic sources, since ACO2 is estimated to make up ~4% of the overall CO2 content of the atmosphere.
Extremely expensive – I mean can you believe the heating bills to melt all those glaciers. This hoax has got to stop, we just cannot afford it anymore.
With regard to warming, surface temperatures have been constantly adjusted, but often in the wrong direction. The expansion of urban areas has caused weather stations to be impacted by the “urban heat island” effect. Simply translated: “lows in the mid-50s; lower in outlying areas.” The earlier data should not be lowered’ the newer data should be lowered to be consistent with weather stations that were not affected by “urban heat islands.”
Secondly, a more comprehensive, three-dimensional look at temperatures reveals a flat line for nearly two decades. http://www.climatedepot.com/2015/08/06/a-new-record-pause-length-no-global-warming-for-18-years-7-months-temperature-standstill-extends-to-233-months/
Thirdly, with regard to the melting polar ice, the Arctic is back to “normal”: http://www.theregister.co.uk/2015/07/21/arctic_bounces_back_world_returns_to_sea_ice_levels_seen_in_1980s/
Antarctic ice is at record levels: https://www.nasa.gov/content/goddard/antarctic-sea-ice-reaches-new-record-maximum
As with economics, it helps to use real data when making arguments.
Certainly use “real” data but even more important use RELEVANT data. Furthermore, don’t cherry pick the presentation of specific data that support your narrative while ignoring those that do not. This is not a Fox news site, people are smart enough to know the difference.
Relevant data to the question of whether there is an increase in global temperatures would be total global temperature (surface and sea temperatures). Don’t cherry pick the specific subset of the data that support your favorite narrative.
The artic sea ice levels (responsible for reflection of solar heat in the summer) are indeed a relevant sub dataset for understanding the strength of one of the positive feed-back loops in the climate models. But why are you using a misrepresentation of one site to talk about Arctic ice and another site to talk about Antarctic ice. The important issue is the trend in combined sea ice level anomaly (http://arctic.atmos.uiuc.edu/cryosphere/IMAGES/global.daily.ice.area.withtrend.jpg) and although it has had a 3-year pause that does not break the long-term trend.
Strange that you are focusing on the surface area of ice rather than the volume. After all the volume is what is most relevant for coastal communities. Maybe your selection of parameters “of interest” has to do with the fact that ice volume data (https://nsidc.org/cryosphere/sotc/ice_sheets.html) don’t support your narrative?
Volume of sea ice does not affect sea ice. It is glaciers metling and entering the ocean that do. The sea ice is already in the ocean, with its melting not adding to the volume of the ocean thereby raising it, but the glaciers melting and going into it do.
Meant to say volume of sea ice does not affect seaside communities because it does not affect volume of water in ocean thus sea level.
bruce, your first link provides data that indicates while SURFACE temperatures have paused, global heat content (the amount of energy absorbed and retained in the VOLUME) in the oceans has risen. hence the argument for a hiatus is strictly applicable to the surface temperature measurements only. warming of the ocean volume is occurring across depths-no hiatus. the surface is simply a small subset of the total volume currently heating. overall sea level rise is consistent with increased heat content and water volume expansion.
the last link is interesting in that it does not indicate global warming is not occurring. expanding sea ice can also occur with increased freshwater melt runoff and land based ice shelf calving into the seas. fresh water freezes easier. moving land ice into the sea produces more sea ice but is not indicative of a lack of global warming-probably the contrary.
BTW, here’s a quick synopsis of reasons and ways the AGW arguments are wrong. No they are not mine. Note the quotes, and please try to refute the points instead of the name calling:
“AGW theory has predicted thus far every single basic atmospheric process wrong.
In addition past historical climatic data shows the climate change that has taken place over the past 150 years is nothing special or unprecedented, and has been exceeded many times over in similar periods of time in the historical climatic record. I have yet to see data showing otherwise.
Data has also shown CO2 has always been a lagging indicator not a leading indicator. It does not lead the temperature change. If it does I have yet to see data confirming this.
SOME ATMOSPHERIC PROCESSES AND OTHER MAJOR WRONG CALLS.
GREATER ZONAL ATMOSPHERIC CIRCULATION -WRONG
TROPICAL HOT SPOT – WRONG
EL NINO MORE OF -WRONG
GLOBAL TEMPERATURE TREND TO RISE- WRONG
LESSENING OF OLR EARTH VIA SPACE -WRONG? I have a study showing this to be so.
LESS ANTARCTIC SEA ICE-WRONG
GREATER /MORE DROUGHTS -WRONG
MORE HURRICANES/SEVERE WX- WRONG
STRATOSPHERIC COOLING- ?? because lack of major volcanic activity and less ozone due to low solar activity can account for this. In addition water vapor concentrations decreasing.
WATER VAPOR IN ATMOSPHERE INCREASING- WRONG- all of the latest data shows water vapor to be on the decrease.
AEROSOL IMPACT- WRONG- May be less then a cooling agent then expected, meaning CO2 is less then a warming agent then expected.
OCEAN HEAT CONTENT TO RISE- WRONG – this has leveled off post 2005 or so. Levels now much below model projections.
Those are the major ones but there are more. Yet AGW theory lives on.
Maybe it is me , but I was taught when you can not back up a theory with data and through observation that it is time to move on and look into another theory. Apparently this does not resonate when it comes to AGW theory , and this theory keeps living on to see yet another day.
Maybe once the global temperature trend shows a more definitive down trend which is right around the corner (according to my studies ) this nonsense will come to an end. Time will tell.
Greenhouse score card showing more blunders
http://www.warwickhughes.com/hoyt/scorecard.htm
Past historical data showing no correlation.
http://wattsupwiththat.com/2012/04/11/does-co2-correlate-with-temperature-history-a-look-at-multiple-timescales-in-the-context-of-the-shakun-et-al-paper/“
Show me a physics experiment that “disprove” the warming effects of green house gases, or measurements that disprove the increase of them. Denying that human activities have increased concentration of green house gases and that those gases have green house effects are simply a denial of reality.
There are currently no climate models that can explain observed changes in temperatures without including a substantial (physics based) component from human activities (affecting temperatures in both directions). If you have such a model bring it out for public display and critique.
DeD, I guess you can answer the question of how much warming is caused by those ” green house gases”, and more importantly how much of that GHG warming is from ACO2/AGHGs? It’s kinda a critical number, because we are making billions $$ policy on that unknown.
Who here has done this? “Denying that human activities have increased concentration of green house gases and that those gases have green house effects are simply a denial of reality.” Its another false argument which has not been made.
Finally, your comment about the climate models is truly interesting. There are no climate models which can predict the temperature, let alone what is causing it. Model predictions even as late as 2014 are already diverging from reality: https://wattsupwiththat.files.wordpress.com/2014/03/certaintychannel_ipcc_reality.png?w=720
Billions $$ policies on that unknown. Well we have made trillion dollar wars on considerably weaker evidence.
The interesting question is why people would suggest that it matters what % of global warming is due to AGHG. Whether it is 20%, 50%, 80% or 120% (i.e, the natural trend is cooling but we overcome that and some); the warming due to AGHG is the only part we can actually change. If AGHG is responsible for 80% of global warming, then a reduction of 25% would have a substantial effect on that warming. If AGHG is only responsible for 20% we would have to completely remove them to have the same effect on global temperatures. The issue at hand is not a blame game but a question of doing whatever it takes to avoid a catastrophic global warming – so the less we are responsible the more we have to change our piece of it.
Yes models are always diverging somewhat from reality. For many years they underestimated warming and the last two years have come in a little colder than predicted by the models. The models have confidence intervals and we expect them to run outside of those. But as mentioned above we have started trillion dollar wars on considerably weaker evidence. The cost of reducing AGHG is much less and the collateral damage for overreacting is actually positive (cleaner air, less asthma attacks). On the other hand the cost and damage from under reaction are in the 10’s of trillions of $$ and huge human sacrifices.
I see DeD still believes in the catastrophic impacts of global warming. Let’s accept is premise the at AGHG is responsible for 20% to 80% of the warming. Here are the actual facts for DeD to ponder. Since the temp records began we have seen a ~0.8C rise in temps. So in DeDude’s world AGHGs are responsible for (0.16 to 0.64C) of that 0.8C degrees. With a clear written history over the period of this horrific rise in temperatures we can quickly peruse the historical records to see just how catastrophic has been its effect. Increase in tropical Storms? Nope. Increase in tornadoes? Nope. Increase in floods? Nope. Increase in droughts? Nope, we are in fact seeing a greening of the Sahel. Decrease in sea ice? Strangely, for all the angst, maybe or nope. Decrease in glaciers? Yup, and this increase in available land to support bio diversity is supposedly bad. Decrease in man’s food? (One of 2slugs favorite possible effects) emphatically nope. (Add to the list if you wish.)
The pause/hiatus has taken all of these models’ projected claims of extreme impacts off the table. The pause/hiatus has shown just how poor is the climate science. It is represented in those same models which have been diverging from reality. Even in the short time frame.
In DeDude’s world the non-existent climate impacts they are worse than those the impacts of war. Its this kind of emotionalism based upon false assertions that matter to those who believe they are saving the planet’s climate.
Please think nof emote. If done at all, then questions like: “…why people would suggest that it matters what % of global warming is due to AGHG. ” would not be asked. They are not happening! Models-based impact exaggerations that are not happening, are no different from the model-based temperature predictions that are not happening. Science represented by the models based upon a hypothesis, AGHG driven AGW, is threatened by the pause/hiatus.
Because of that we see all the emotion and denial of its reality.
@CoRev
So when a car is rolling downhill towards a cliff, we shall not be concerned or apply the brakes, because the catastrophe (that some silly people are concerned about) has not yet happened. Only after it has run off the cliff should we be concerned and apply the brakes? I think I will pass on any offers to take a ride with you.
You should learn from those who in 2008 predicted an ice-free summer for the arctic ocean within 10 years. A few years of “off trend” data doesn’t mean the long-term trend has changed (even if that is the narrative you so desperately want to believe in). NSIDC has some real cool graphing tools where you can see that (http://nsidc.org/arcticseaicenews/).
DeD, I’ve found tht those who can not discuss the points shift to analogies, such as cars rolling down hill. It’s simple math, not physics just simple addition and subtraction to find the change and then multiplication of division to develop percentages or averages.
Here are two thought to ponder. 1) If CO2 is a GHG and it traps (no! slows the IR from leaving the atmosphere) it also traps incoming solar IR at altitude before reaching the surface. What if overall CO2 was cooling the atmosphere? I’m not saying it is, but it is clearly not as strong of a warming agent as the science/models say. 2) How does the Arctic Sea Ice melting support AGW?
The last question is important because most of the alarmism is from ACO2 being the temperature driving factor. The hiatus questions the science on even the impact of GHGs on temperatures.
@ CoRev
Last basic science lesson.
The reason experts agree that CO2 is a green house gas is that they have measured its effect on incoming solar rays and outgoing rays (heat). Sorry you are not smarter than them and you (or whatever morons are producing these denier ideas) have not discovered a fatal flaw in the physics claim of green house gas effects of green house gases. I am glad you are “not saying it is”, but even suggesting it seem pretty stupid (or desperate in the desire to hold on to a crumbling narrative).
A hiatus does not “question” the science or impact of GHG on temperatures. Global temperatures are complex parameters that require complex modeling to understand – exactly because no single parameter can “explain it all”.
The green house effects of green house gases is a fact and so is the release of those gases by human activities and their increased levels in the air and the increased global temperatures. Although those of us who are firmly anchored in reality will accept challenges to facts (that is a normal part of science), we only do so when someone can produce a challenge based in solid scientific data. If you can show me a physics experiment that challenge the currently established green house gas effects of CO2, then I can take you serious. Speculations, by someone who wouldn’t even know how to set up such an experiment, does not match up to the carefully documented observations of experts who have done such experiments for decades. Just because there are two opinions doesn’t mean both are valid.
@DeD, your grasp of the physics is interesting. You seem to be responding to my first question which was this: “1) If CO2 is a GHG and it traps (no! slows the IR from leaving the atmosphere) it also traps incoming solar IR at altitude before reaching the surface. What if overall CO2 was cooling the atmosphere? I’m not saying it is, but it is clearly not as strong of a warming agent as the science/models say. ” You do not seem to understand the physics of the GHG effect. What I described does not effect the physics, but does effect the likelihood for the IR photon to be returned to space without entering the lower atmosphere. BTW, the slowing of the IR photon is well understood. It is one of the major factors used in calculating the climate equilibrium.
You seem confused about what is the physics and therefore make statement thinking this is a fatal flaw, or that the comment somehow questions the GHG effect.
Your grasp of climate science is seriously lacking. Concentrating on a single gas molecule and its effect by/on an IR photon is not in question, the surrounding science is clearly questioned. Most of the impact are from the feedbacks, and this is the area of the science/models where most of the issues reside.
Running the climate models is the equivalent of performing an experiment. Whether they have predictability and support the hypothesis is critical to validate the science/hypothesis. It is usual for science to reject or modify the hypothesis when the experiment/model fails to predict, except for climate science where failed predictions is the norm for an unchanging hypothesis. And, yet you blindly believe this is science, because the founding fundamental is correct and the surrounding findings are less correct.
Since you are so sure of the GHG physics, here is another thought problem. How long is the time frame of the single IR photon on a single GHG molecule, fractions of a (second, minute, hour, day, year, other)? Its not a trick question. With your surety of the physics it should be well known to you.
About half of your claims here are not there, starting with no Arctic warming. Looked at your “scorecard” and it was done in 2006 on an old model. While the model overforecasted a lot of stuff, most of it was in the right direction, so all the “lose” votes are a joke. Several of the arguments are completely off, most notably on Arctic warming. 1940 was the last peak of warming. I know who is behind that scorecard, and they like to play games.
BTW, CoRev, do you have any scientific credentials to back up your “studies”? You claim that we are about to go into a temperature decline phase based on your “studies.” What would be the reason for believing that we might be about to go into a temperature decline? Have you ever published anything in an academic journal on these matters, in other words, is there any reason to take your “studies” remotely seriously?
If people would like to see a clear presentation of the real views of climate change skeptics, as opposed to the publicity-seeking views of a reality tv star who is currently pretending to be a Republican but is actually a Democrat, I’d recommend Russ Roberts interview with Matthew Ridley.
Given there’s no scientific evidence humans have a significant effect on global warming, it seems, the goal is to whip up a mass hysteria to justify government control of the energy industry and the subsequent high prices.
Peak Oil has been debunked or discredited? 😀 How charming that one can internalize such notions in the face of the facts.
US oil production PER CAPITA is down 45% since 1970 and at the level of the LATE 1940s. The boom/bubble in US shale production PER CAPITA is barely a blip on the long-term, log-linear depletion regime’s trajectory since 1970.
World oil production PER CAPITA is no higher than in 2004-05, whereas lower-quality, higher-cost US shale production as a share of world oil production has increased 50%+ since 2008-09.
World net oil exports are down 25-30% since 2004-05.
Since 2007-08, world real GDP PER CAPITA (dependent upon liquid fossil fuels PER CAPITA) has barely grown, and global trade has peaked.
World industrial production PER CAPITA peaked in 2004-08.
Peak Oil is history; that is, it is in the rear view mirror ten years behind us.
The aforementioned facts confirm the expectations of the business-as-usual (BAU) model of “Limits to Growth”, which cannot be permitted to be acknowledged and internalized because the implications are the antithesis of the expectations of perpetual growth of population, resource consumption, debt to wages and GDP, production, profits, and capital accumulation PER CAPITA on a finite spherical planet, i.e., “Spaceship Earth”.
An increase in thick ice would be evidence against global warming. An increase in thin ice is evidence for global warming. What we’re seeing is an increase in thin ice. So the sea ice issue argues against the deniers. Another way to confirm this is to observe the change in salinity. If thick ice was increasing, then the oceans should be getting saltier. They aren’t.
Baffling is right about the deep ocean pulling down some of the heat. This has happened before; e.g., the early 14th century. That does not mean heat has disappeared. We know that CO2 traps heat. This has been known for a very long time. And it can be proven in the laboratory. What we have tended to measure in the past are surface temps because they are easy to measure. Recent data shows that much of the heat at the ocean’s surface has been pulled down to deep levels. Apparently CoRev believes that heat just disappears. Apparently CoRev hasn’t heard about conservation of energy and all that.
CoRev is right that in the past CO2 has lagged temperature increases. But that’s because the higher temperatures unlocked CO2. But that does not mean manmade CO2 emissions cannot lead temperature increases. Again, we know from the lab that CO2 traps heat. This is not even an arguable point. What is arguable is the tipping point beyond which additional CO2 emissions lead to runaway temperature increases. The legitimate scientific argument is not whether global warming is real or a hoax, but rather what is the carbon limit. Some say it’s 350ppm. Others say 450ppm. Some say we have two generations to get our act together while others say we have less than a generation. Those are legitimate arguments about genuinely uncertain parameters. What is not legitimate is an outright denial of manmade global warming.
BTW, Prof. Perry is not what I would consider an econ professor. My understanding is that he teaches business finance, which isn’t quite the same thing as macroeconomics or econometrics. It’s like saying a dentist is a doctor in the same way that a heart surgeon is a doctor. Kind of a difference.
Prof. Perry has a Ph.D in economics. So, he must know something about macroeconomics or econometrics.
And, CO2 levels were much higher in the past before humans existed:
https://stevengoddard.files.wordpress.com/2012/05/image277.gif
Yes, if he took courses in something 20 years ago he does know a little more than the average college graduate (who didn’t take those courses). However, real expertise comes from doing continuos research in a field. Nothing beats the insights that comes from spending 40-60 hours a week year after year studying a subject of interest.
Yes the planet has had much higher levels of CO2 and water before humans existed. But that is exactly the point. I once found a little fossilized fish skeleton in the Rocky Mountains. That fish was just fine with water that high and so were the land animals living on higher grounds at that time. However, a modern civilization with its infrastructure cannot simply be moved to higher grounds, without huge costs. Furthermore, the disruption to the ecosystems would likely require very costly disruptions in our food production.
At this point the right wing politicians are so deeply committed to their tribalism and the oil industry agenda, that they are refusing things that would enhance national security if it incidentally also reduce CO2 emissions.
Come on now. Melting of sea ice is evidence of global warming; expansion of sea ice is evidence of global warming. You just ate your cake and have it, too.
No he just turned on his brain and I am sorry if that just got a little overwhelming for you. His explanations are not above 5’th grade science grade level so either you are willfully ignorant or your parents should demand a refund on their school taxes.
Kumquat, you can do better than that.
http://www.forbes.com/sites/jamestaylor/2015/05/19/updated-nasa-data-polar-ice-not-receding-after-all/
Since the area covered is greater than previous records (arctic and antarctic combined) and the thickness of the arctic sea ice has been rapidly recovering since unusual wind conditions moved much of the ice into open water, the AGW alarmist claims don’t hold water (or ice).
http://wattsupwiththat.com/2012/09/24/nasa-on-arctic-sea-ice-record-low-storm-wreaked-havoc-on-the-arctic-sea-ice-cover/
Sometimes there is more to the story than mere numbers and a wish to blame humans for everything that happens in nature.
Jurassic (period) – Wikipedia
See box on right. The mean CO2 level is estimated to be 1,950 PPM.
https://en.wikipedia.org/wiki/Jurassic
2slugs is wrong again: http://www.nature.com/ngeo/journal/v8/n8/full/ngeo2489.html. Arctic Sea Ice Ice thicker and more volume.
Changing the metric to Ocean Heat Content doesn’t change anything. The deep ocean currents take centuries, nearly 1000 years, to complete their cycle. I guess disappearing heat for centuries is not the message we want spread.
The carbon limit is an interesting concept, since the fossil fuels were all resident as CO2 at some time. At the highest it was almost 20 times higher than today, and still there was no runaway anything. Especially not warming!
I’ve called BS on 2slugs many times in the past. This is just another time.
re: http://www.nature.com/ngeo/journal …
One dot in a tickertape parade does not an argument make.
http://neven1.typepad.com/blog/2015/07/asi-2015-update-5-late-momentum.html#more
“Perhaps 2015 can still make the top 3, but it will require a continuation of weather conditions that are conducive to melting, compaction and transport all the way to the minimum. Either way, the rebound (or ‘recovery’, as some called it prematurely) is in danger of getting wiped out, which brings us back to square -10, meaning that Arctic sea ice loss is still progressing much too fast.”
Yes the disappearing land ice from Greenland is slipping into the ocean and temporarily increase the volume of sea ice of its coast. Exactly as predicted by the climate models. Unfortunately when land ice become sea ice (as observed Greenland and parts of Antarctica) it contributes to the rising of sea levels. In Antarctica the reduced land ice volume has been helping increase the sea ice surface area (countering roughly 50% of the lost sea ice area in the arctic). In Greenland the geography has meant that the lost land ice has mostly led to thicker sea ice rather than countering or reversing the lost sea ice coverage area. That is unfortunate because the concerns about consequences of global warming are rising oceans due to lost land ice but reduced sea ice surface area as a source of increased solar heat absorption in the summer. It would have been nice if the total global ice area had stopped increasing so we didn’t have to worry about the feed-back loop (where the globe absorb more heat because of loss of reflective ice surfaces and that heat melts even more ice, etc.). It would also have been nice if those local increases in sea ice were not associated with loss of ice on the associated landmasses. Even better would be if the changes of the past few years turn out to be part of a change in long-term trend rather than a short-term aberration. Jumping on a few years of aberration from the trend has never been particularly smart, as can be seen when examining the data from NSIDC (http://nsidc.org/arcticseaicenews/).
Error that was “total sea ice are stopped DECREASING so we…” http://arctic.atmos.uiuc.edu/cryosphere/IMAGES/global.daily.ice.area.withtrend.jpg
DeD, this is the actual long term temperature trend. http://jonova.s3.amazonaws.com/graphs/lappi/gisp-last-10000-new.png What does scare me is this is really on the horizon. Some say we are overdue. for sea level rise we have this long term look http://climatesanity.files.wordpress.com/2009/08/holocene-sea-level-rise-graph.jpg
We have an excellent historical record of the negative impacts of the latest warming peak. NONE! For that matter the previous warming peaks were given names associated with human expansion. Don’cha just get amazed by that science.
Stop the emoting and think logically. Think critically. Do the simple math. Be surprised at the science that actually fits those new parameters.
It is unfortunate that the oil industry has developed these alternative universes that will present graphs taken either by misrepresentation of actual scientific data from or simply plugged directly out of the website authors dumb ass.
This is not unlike what has been done by those who are more interested in defending their specific economic narratives than finding the truth.
Any further communication with a person who pulls information from a website called “climatesanity” would be a waste of time.
Since this economics post is about the politics of global warming (aka climate change aka climate disruption), perhaps this post from another economics blog about this might be interesting. It certainly is more in depth… and may offer perspectives that neither “alarmists” nor “deniers” offer up.
http://www.econtalk.org/archives/2015/06/matt_ridley_on.html
Oops, sorry Rick Stryker. I didn’t mean to step on your comment earlier.
CoRev There are many different ways to measure the thickness of sea ice. The satellite data referenced in your link is one way, and it does show some thickening in the last couple of years. However, we only have 5 annual observations, so you wouldn’t want to put too much weight on that satellite data. And as NOAA points out, the algorithms used to estimate the ice thickness from the satellite data still have a lot of room for improvement. But another indicator of ice thickness is the age of ice, and here we have a much longer timeframe. What we see there is a long run decline in the amount of old ice, but a slight increase in the last couple of years….those years also happen to track with the satellite data on thickness. In other words, the thickening that you are alluding to is noise due to year-to-year variability. Looking longer term, the age of the sea ice is younger and thinner now than it was 25-30 years ago…and by quite a big margin.
Peak Trader Yes, everyone knows that CO2 levels have been much higher at certain points in earth’s history. We all know that. But back then there were forces in play that tended to keep temperatures from running away. For example, the sun put out less energy, the earth today is very slightly closer to the sun than it was tens of millions of years ago, the earth’s tilt varies, the land masses were consolidated causing different ocean currents, etc. What concerns folks at NOAA is that most of those forces that kept the earth’s temperatures from running away and turning Earth into Venus are no longer in play. The temperature/CO2 balance is a knife edge thing. In the past it was higher temperatures that released CO2, so CO2 concentrations lagged temperature. That’s not the case today. Today it’s the CO2 concentrations that are increasing the temperatures, so we can’t count on the same self-correcting forces that kept things in equilibrium tens of millions of years ago. The difference between 3 parts in 10 thousand and 2 parts in 10 thousand is the difference between an habitable earth and a frozen earth. We should be equally worried about the difference between 3 parts in 10 thousand and 4 or 5 parts in ten thousand.
This is incorrect, Slugs.
2slugbaits, so you’re saying, because of changes in the sun’s energy output, changes in the earth’s distance to the sun, changes in the earth’s tilt, different ocean currents, etc., when CO2 levels rise again to pre-human levels, temperatures will run away and the earth is doomed.
If you believe humans have a significant or lasting effect on CO2 levels, then we’re lucky the use of fossil fuels, for a few hundred years, happened to take place when CO2 levels are near a historic low.
2slugs, on the Arctic Sea Ice you might have stumbled on a truth that the ice is cyclical. It wouldn’t be uncommon, as we are finding more cycles in the climate as we study it. Hve we reached a turning/tipping point? Only time and Ole Mom Nature can tell us about the Arctic Sea Ice.
BTW, how does this Arctic Sea Ice melt support AGW?
Arctic sea ice extent appears to be lowish, but not significantly worse than the last couple of years, and much better than the 2011-2012 period. Having said that, we’re entering peak melt season, and conditions can change pretty rapidly during this stretch.
http://ocean.dmi.dk/arctic/plots/icecover/icecover_current_new.png
Antarctic sea ice continues above average, but not as far above as we have seen in recent times.
http://nsidc.org/data/seaice_index/images/daily_images/S_stddev_timeseries.png
Global sea ice, which had been absolutely average for the last two years, just took a dive, probably on the back of a reduction in Antarctic sea ice and a sudden dive in Arctic ice, at least by the particular anomaly measured.
http://arctic.atmos.uiuc.edu/cryosphere/IMAGES/global.daily.ice.area.withtrend.jpg
Global satellite temps. No warming since 1998.
UAH: http://www.drroyspencer.com/wp-content/uploads/UAH_LT_1979_thru_June_2015_v6.png
RSS: ftp://ftp.ssmi.com/msu/graphics/tlt/plots/rss_ts_channel_tlt_global_land_and_sea_v03_3.png
steven, those are surface temps? my understanding of the data indicates the volume of oceans, not simply the surface, is increasing in heat content (holding more energy). this also coincides with rising sea levels as the water expands. anybody who wants to argue for a hiatus needs to explain the increasing heat content of the oceans. the surface measurements are a very small element compared to the total volume, and while they do provide some information regarding heating/cooling, it is the total volume of ocean water that would be more important. even small increases in ocean heat content represent large stores of energy, indicating a hiatus is not actually occurring. arguing for a hiatus using a subset of surface temperature data, against the trend associated with the larger data set measuring the volume temperature, does not appear to be correct. i would imagine as the deep water thermal measurements continue to accumulate, the picture will become clearer, but it looks like the data is against the hiatus and supporting warming.
Satellites measure the atmosphere, Baffs.
It’s problematic to make the case that the oceans are warming and the atmosphere is not, certainly over a 17 year period.
The ocean measurements, by the way, are spotty and recent. And as I recall, we’ve now also seen some tampering with the ARGOS buoy data.
Indeed, we’ve seen numerous manual adjustments to the GISS and now HADCRUT data sets to try to make the hiatus disappear.
https://stevengoddard.wordpress.com/data-tampering-at-ushcngiss/
Data’s not supportive, Baffs, and the attempts to falsify the data record ex-post are criminal.
steven, the deeper ocean data does indicate continued rise in heat content. this also coincides with increased sea levels due to thermal expansion. it takes far more energy to raise the ocean heat content that it does to do the same in the atmosphere. simply look at the materials specific heat to understand this. so when you say
“It’s problematic to make the case that the oceans are warming and the atmosphere is not, certainly over a 17 year period.”
that is wrong. this is not a “case” being made. this is exactly what the data is saying. for those who use the “hiatus” of surface temperatures as proof global warming is not occurring, you need to rectify this argument with the increase in ocean heat content. the rise in heat content does not lend credibility to an argument for a “hiatus”. it indicates warming has continued on a global scale.
Steven,
The data have not been “tampered” with. They have been processed, as all large and inhomogenous datasets taken over large time periods need to be, in order to generate a sensible final product. Would you adovate drilling an oil well with raw, unmigrated seismic data? Or would you rather use data which had been “tampered” with to remove noise and bias by educated professionals?
Before you suggest that “data is not supportive” I would suggest you go back a reread an undergraduate text on time series analaysis, and maybe some statistics, and then try running a few regressions over various time periods, looking at the errors in your regressions, and thinking about what that might mean. Go and run a lowess smoother on the temperature dataset of your choice, and see what you get. Maybe subtract a linear trend from the post 1970 data, look at the residuals and see if they indicate a change in trend. You’re a smart man, so stop being stupid.
Steven,
The satellite measures the lower troposphere temperatures. Unless your main residence is a dirigible I would dare to suggest that surface temperatures are of more relevance to you.
As I have repeatedly asked, please stick to the oil analysis. It’s what you’re good at.
Upper troposphere, even.
From the surface to the lower stratosphere, even.
Steven,
You seriously damage your credibility by using 1998 as a base. It was a wild outlier on the upside. Anybody using it as a base is just spouting propaganda, either consciously or as a fool.
Menzie, surprisingly there are more comments, compared to your economy topics.
Guess you could change your blog into a climate discussions related one.
Anyway, I would say it’s good news if it’s getting warmer.
Historically speaking, mankind did better in warmer times, believe it or not.
But personally, I do not believe “man made global warming”. But I do believe about what Al Gore’s friends in St. Barth did discuss, and I tell you Menzie: it’s all about the money.
Johnny: I think if one calculated a Herfindahl (concentration) index, you would find the numbers are inflated by contributions by several individual true deniers.
Menzie, if you cannot discuss the science you use analogies or name calling? Other than the existence of the pause/hiatus, what has been denied?
Sorry, CoRev, the trend is back up. We have had months recently that are the hottest ever recorded for their months.
Your turnaround for a global temperature is going to start when and what is going to cause it, please?
This is always true for climate change subjects – seen it on every blog I have followed. Part of it is that the subject is very complicated. Probably only about 1000 people in the world who have sufficient expertise to discuss climate models, yet the subject draws huge attention. This opens the subject up to “denier” type “debate”. Furthermore, the financial interest of “big carbon” ensures that there is plenty of money to finance pseudoscience and provide deniers with graphs. The big contributions from “big carbon” has also ensured that one of the main political tribes has been backing this particular type of denierism to the point of looking silly. So these debates also draw energy from the main political tribalism,
DeD, using the term “denier” doesn’t answer the question I posed: “what has been denied?” Otherwise, you again show your ignorance about the models: “Probably only about 1000 people in the world who have sufficient expertise to discuss climate models,…”most commenters and comments are about their predictions and the exaggerated and unfulfilled impacts from those predictions.
While we are talking about the GCMs, why is do you think those managing the datasets are so enamored of the AGW hypothesis? Do nearly all have their own version of a GCM? Please notice I’ve refined the generic term model to its subject-based name General Circulation Model. To save you looking it up here’s the Wiki definition: “A general circulation model (GCM), a type of climate model, is a mathematical model of the general circulation of a planetary atmosphere or ocean and based on the Navier–Stokes equations on a rotating sphere with thermodynamic terms for various energy sources (radiation, latent heat). …” https://en.wikipedia.org/wiki/General_Circulation_Model
Gosh, CoRev, are you an expert on Navier-Stokes equations? So, what is about the N-S equations in the GCMs used by the AGW people that are wrong, please? Hopefully while you are at it, you can prove a few theorems as well as cite the academic journals publishing your “studies” on these matters, please.
Where do conservatives find all these nut jobs? There must be some underground network.
Roy Spencer. Creationist and evolution denier as well as climate denier who signed on to the “Evangelical Declaration on Global Warming” which states that God has his hand on the climate throttle, so not to worry. Favorite guest of Rush Limbaugh.
Steven Goddard. BS in geology whose work has been declared bogus even by fellow climate deniers Anthony Watts and Judith Curry. When even your fellow nut jobs say that you are a nut job, you might be a nut job (cf. Trump and the Republicans).
Matt Ridley. My favorite nut job. That’s 5th Viscount Lord Ridley to you plebs — yes, he’s genuine royalty — and holder of the coveted James Inhofe seat in the House of Lords. As Chairman of Northern Rock, he presided over the first bankruptcy of a British bank in more than a century, thereby demonstrating his incompetency on subjects outside his chosen field of zoology.
You would think that Steven Kopits, who presumably sells his expertise in his day job, would be embarrassed to tarnish his reputation by his association with these nut jobs, but I suspect it doesn’t matter because his clients are primarily other nut jobs and nuttiness is considered a plus.
Your characterization of anyone who disagrees with you as a “nutjob” leave a lot of intellectual depth to be desired.
Joseph,
As I think you know, I tend to reference data, not people. If you read my comments above, you’ll see I reference two satellite temps set and two or three satellite ice measurement sets. The UAH temp dataset is managed by Roy Spencer. I haven’t had much reason to think Roy has manipulated the data downward (although he tries hard to keep comparability with RSS data), but if he did, I would be as opposed to that as I would with anything Jim Hansen of NASA did with GISS. Data is sacred. Without data, there is no knowledge.
As for my clients, they include the biggest hedge fund in the world and the industry’s leading oil trader.
I may have to change my mind. I thought the regular bizarro right-wing nut-jobs that troll this blog (and whose writhing antics in the face of Menzie’s implacable deployment of educational statistics are a big part of the entertainment value for me) were paid professionals. But the crazy is just a little too deep here. It seems improbable that people, even as focused as the Kochs, would pay for such stupidity. But maybe so! Like Johnny says, follow the money.
Menzie, Joseph, Russell, if you can not discuss the issue why comment? It only makes you look shallow and ignorant of the subject.
To be clear, Menzie’s own expert reference http://www.pnas.org/content/108/29/11790.full.pdf recognized the pause/hiatus. Do you deny its existence? Influence on the science? Importance in this discussion? Just what are you protesting?
I have backed up most of my comments with references and data graphs. Where’s yours?
CoRev: New data a’coming; as you know (since you commented) on this post.
Menzie, not new, why are you referencing old entries? Remember my first comment in this thread citing NOAA’s unjustified adjustments? The explanation in the graph says: “…the latest corrected analysis…” How unjustified? The data baseline they used for adjustments was lower than their adjustments, and the ignored the best mors recent data, the Argo data, for the late adjustments. Worse they even adjusted the Argo data.
Notice the divergence at the end of the two data types: http://www.woodfortrees.org/plot/gistemp/from:1979/offset:-0.25/plot/rss WFT does not collect NOAA data. So I used GISS because it is the NOAA data primarily with some extrapolation for the polar regions. It is offset to adjust it to the same baseline as RSS.
Some basic facts the surface stations data all use 90=95% of the same stations and there is only one sea surface. The satellite data is now at nearly the same level of same sources. So we essentially have two datasets showing different trends; Until the latest NOAA adjustments all the datasets showed the hiatus with slightly different start dates and lengths.
Watch the next few years. We should have a la Nina following this el Nino and that will extend both the hiatus and the cooling trends. That will making the surface data adjustments even more obvious.
Menzie, as a further comment on the surface temps t\dataset claims of warmest evah, the global averages hide a lot of details. Much of the 2014 warming was due to two things, 1) the ensuing, building el Nino, and the warm blob of wter in the N. Pacific. These two thing acounted nearly all the warming.
The hoax is about the claims that ACO2 is the climate driver, and the the model’s based exaggerated claims which have failed to occur.
It seems, CoRev, if the data do not fit the narrative, the data must be wrong and adjusted. That’s why so much of what passes as climate science is nothing more than political rhetoric striving to be as accurate as astrology. Of course climate changes… always has, always will. Of course humans can affect their environment and thus their climates. Strip off a rain forest and you’ll get climate change. Build extensive wind farms or solar arrays and the local climate can be affected significantly. But the alarm over CO2 is political hype with the intention of taxation, control, concentration of power and wealth.
Meanwhile, the EPA with all of the good intentions in the world releases 3 million gallons (and counting) of seriously toxic water into our rivers. Wonder how many smelt that saved.
You can’t follow this issue at all without knowing that there are very credible and thoroughly demonstrated instances of pervasive data tampering by NOAA. You also can’t follow this issue at all without knowing that there are several other independent data sets, most notably the two satellite data sets of UAH and RSS covering the period 1979 to present, that do not show the warming that the NOAA data shows.
And if you know the slightest thing about the technology then you will know that the UAH and RSS satellites were not appropriately adjusted to provide reliable data on temperatures. We know that because the data from them didn’t reflect the observations from actual temperature measurements on the ground. To scientists that is a clear indication that your algorithms need to be corrected/adjusted. That did that such that their data actually reflected ground based measurements and there is was now they also showed global warming. No big conspiracy just regular scientific process identifying and correcting an error so that the data reflect the irrefutable facts on the ground. You can find a pretty good summary of the whole story at Wiki, including the reference to the scientific papers where the problems were identified and resolved the way scientist do these things (you know data and calculations and arguments for why something is right/wrong, and showing how modeling/inferences become more in line with the irrefutable physics observations of temperatures).
http://wattsupwiththat.com/2015/07/15/both-noaa-and-giss-have-switched-to-noaas-overcooked-pause-busting-sea-surface-temperature-data-for-their-global-temperature-products/
This does require reading, however.
DeD, you have yet to support any of your claims, And if you know the slightest thing about the technology then you will know that the UAH and RSS satellites were not appropriately adjusted to provide reliable data on temperatures. If its that clear to you then explain the http://www.woodfortrees.org/plot/gistemp/from:1979/offset:-0.25/plot/rss the nearly identical trend lines until around the start of the pause/hiatus. Show us that error in the actual data, then explain why Ricardo’s comment this AM: “…there are very credible and thoroughly demonstrated instances of pervasive data tampering by NOAA.” is wrong.
While making absurd claims you use words like physics and irrefutable in a discussion centered on refuting both the physics and the divergence between the two major datasets, you continue to berate anyone not of your own mindset.
Let me explain just a little bit about science. No scientist would call any science irrefutable. Moreover in the scientific process there are several steps that must be passed to prove a hypothesis. Most important is that of experimentation/tests which provides positive predictions confirming or falsifying the hypothesis. For climate science both the science and the AGW hypothesis reside in the GCMs. To date the GCMs have failed the critical step of experimentation/tests which provides positive predictions confirming the hypothesis. Not just in the past, but in each and every round to date. The last round, the CMIP5 runs, using the 8.5 scenario, the CO2 continuing as usual, failed (diverged from reality) even before the ink was dry on the IPCC AR5 report. Making it even worse, the model runs closest to reality were those using the scenarios minimizing anthropogenic CO2. In any other science, except some of the social sciences, this would require adjustment or abandonment of the hypothesis, but nor in climate science, where doubling down is the norm.
So, “…showing how modeling/inferences become more in line with the irrefutable physics observations of temperatures.” is neither irrefutable nor in line with the observations. The satellite data is the data most stable and the surface data is the most adjusted. When those adjustments are all in the same direction and based upon the expected results from the clearly in error GCMs, then the accuracy of the surface temperature estimates are the more suspect. Unless of course being incapable of critically thinking when reviewing the science, then those efforts are indicators of having moved into religious zealotry.
I have a simple set of tests for classifying remarks/commenters. 1) can they support the comment with a reference? 2) Have they considered the simplest logic/math of the claim. Number two is a critical test. for instance claims that the glacier melt (not Greenland and Antarctic ice caps) is accelerating leading to their imminent disappearance. If you are familiar with the science some numbers are intuitive — glaciers make up 41,000 cubic kilometers of ice, and the melt rate in these claims have accelerated up to ~3 cubic kilometers/year. Simple math leads us to an estimate for them being disappeared in ~13.5K years. That’s as long or slightly longer than the current interglacial.
These claims come from the models, or the blind belief in AGW and observations. In the claims from glacier observations, they were made using measurements/estimates from 0.26% of the worlds glaciers. You folks fall upon your knees worshiping such ?science?, and call those not worshiping with you names. Really?
I am sorry to be such a fussbudget, CoRev, but just who the heck are you to lecture other people about what “science” is? Again, tell us about your publications and how highly cited they are, not to mention the intellectual institutions that you are associated with, please, before you spout off again on what “science” is or is not.
The greatest socialist crony industry according to the Insurance Journal
this data adjustment conspiracy theory blather needs to end. those promoting this either are ignorant of measurement science or are pursing an agenda. let’s be very clear, the satellite data that corev, rtd, ricardo, steven, bruce et al allege to be manipulated is based on a false narrative. first you need to understand, there is no “raw” temperature data that is being manipulated. all the temperature data from those satellites, from day 1, have been measured by proxy. you cannot measure the temperature directly using these remote sensing systems. a completely different parameter is measured, and this parameter is correlated and calibrated to the surface temperature. typically this parameter provides relative measurement changes, so it must be baselined to some known temperature measurement and condition on the ground. this is one source of possible error that has been adjusted over time. in addition, over time we have found many factors which influence the correlation, and were not known when measurements first were obtained. the adjustments that are made are basically to include this new found knowledge in the correlation between proxy measurement and temperature. the raw data is not changed. the only difference, over time we have improved what we know about the correlation between the satellite proxy measurement with surface temperature.
for those who are interested, the quick overview of satellite measurement data can be seen on some wiki sites such as dedude recommended
https://en.wikipedia.org/wiki/Satellite_temperature_measurements
https://en.wikipedia.org/wiki/UAH_satellite_temperature_dataset
so the next time you hear somebody argue how satellite temperature data is being manipulated, you should understand the raw data is not being manipulated. the original correlation and calibration has simply found to be inaccurate. anybody arguing a return to that data is not using better measurements, but actually a poorer model in the correlation equation used to provide the temperature value. ALL the temperature data has been correlated from proxy measurements from day 1. you can learn more about measurement sciences at nist, the government agency responsible for accurate and validated measurement techniques.
Baffled, who has said: “so the next time you hear somebody argue how satellite temperature data is being manipulated,”??? Its not the satellite data being manipulated but the measured surface data! Your whole comment is pointed at the wrong data.
However, you did say something very meaningful about base-lining the data. In the beginning the satellite data after being calibrated on earth before launch was adjusted to the surface station data after being in space for some time. What DeDude missed was for decades the trends were in lock step with the surface data.
The surface data also uses calibrated equipment, and the resulting data being older technologically and frequently changed, those calibration techniques shifted with time. Since it was the only mechanism for base-lining adjustments they were used to base line satellite data adjustments bringing them into alignment. Surface data has many, many more warts (data drops, station moves, equipment changes, hand written and the associated errors, errors generated in digital conversions) than the satellite data. So to develop averaged temperature records they are processed right from the beginning of their collection. A processing step used by satellite and surface datasets use homogenization algorithms to center the data in various size grid cells, otherwise most processing steps are different.
Satellite data also takes processing steps to create temperature from various frequencies of infrared light in accordance with Wien’s displacement law. Satellite adjustments are based upon known and observed parameters mostly associated with orbit and equipment drifts noted by the on board calibration sets. Satellite data can also be calibrated against the many thousands of weather balloon data collected all over the world and at altitudes similar for which the satellites were collecting.
Soon after the pause/hiatus was noted climate scientists started to question why the models were drifting/diverging from the surface record. Kevin Trenberth was found to say in his 2009 climategate emails: “The fact is that we can’t account for the lack of warming at the moment and it is a travesty that we can’t.” This confirmed what skeptics had been noting for nearly a year prior.
The point of Trenberth’s and other climatologists concern was that the surface temps were showing no warming where the science represented in the GCMs predicted it should. Soon thereafter we started to see adjustments being made to the surface record to better match them with the expected temperature from the GCMs. Accordingly it appears that the surface temperature datasets are now baselined against the GCMs. The latest such adjustment has been the NOAA sea surface temperature adjustments. I’ve already explained why these adjustments apparently were unjustified.
So we have the well calibrated satellite data, less adjusted with well documented processing changes, continuing to show the pause/hiatus, and the less calibrated highly and more poorly documented adjusted surface data showing less of a pause/hiatus.
corev, you are wrong.
“Accordingly it appears that the surface temperature datasets are now baselined against the GCMs”
it may appear this way, but this is not the case. the datasets were not calibrated to the models. however, the appropriately revised calibrations between satellite measurements and the surface temperature produced a data set that is more consistent with the climate models. your problem is you need to deny this aspect by any means necessary. what this indicates is those much maligned climate models are probably better than you were willing to admit. unfortunately you have backed yourself into a corner, and now will never be able to admit that the data and climate models do show good correlation.
Baffled, support your statements. Here’s mine: http://www.woodfortrees.org/plot/gistemp/from:1979/mean:12/offset:-0.25/plot/rss/mean:12/plot/rss/from:1997/trend/plot/gistemp/from:1997/offset:-0.25/trend I’ve already shown in an earlier comment the models divergence. As you say: ” your problem is you need to deny this aspect by any means necessary. “
Baffled, it worse than I thought. Impotant satellite raw data is calibrated against the models:
“First is a statement in Hansen et al. (2011) The Earth’s Energy Imbalance and Implications. James Hansen, as you’ll recall, is the former (retired) director of GISS. In that paper, they discussed a problem with the satellite-measured energy imbalance at the top of the atmosphere and how the climate science community worked around it (my boldface):
The precision achieved by the most advanced generation of radiation budget satellites is indicated by the planetary energy imbalance measured by the ongoing CERES (Clouds and the Earth’s Radiant Energy System) instrument (Loeb et al., 2009), which finds a measured 5-yr-mean imbalance of 6.5Wm−2 (Loeb et al., 2009). Because this result is implausible, instrumentation calibration factors were introduced to reduce the imbalance to the imbalance suggested by climate models, 0.85Wm−2 (Loeb et al., 2009).”
From this excellent article discussing the models and their projections of the climate fundamental energy balance at TOA. For those unfamiliar with the terms its balance of energy that gosinta and that cumsouta the planet’s atmosphere.
To which satellite did they refer? CERES! the satellite measuring the energy that gosinta and that cumsouta the planet’s atmosphere.
This is an important analysis.
And when you get tired of the climate denier trolls (and the troll army they call in after a day or two); you can always just send them over here:
http://grist.org/series/skeptics/
Every one of their standard “concerns/denials” answered in short form. Wasting your time is part of their tactics – no need to feed them.
DeD, please get something at least reasonably current. Nearly all these counter arguments are from before recognition of the pause/hiatus. At least improve your searching capabilities to cover recent science.
Is that supposed to support your inane comments?
CoRev,
if you understood the difference between temperature and heat (energy) then you would not claim that there is a pause.
Why
corev,
let’s straighten you out once again. you rely on rss to prove your point. rss is not direct temperature measurement. it is an outcome of a complex algorithm using various proxy measurements to produce an estimate of temperature. rss produces a model of the global temperature. you agree with it. fine. other models do exist, and show a different trend. why do you think your selected model is superior????? it is a model, an interpretation of the raw data only.
so we have a couple of models of temperature based on proxy data from satellite and ground stations. the models show 2 different trends over the past 15 years. you claim your model is correct and the recent models are fake. how so? one thing you should consider, is your model indicates a distinct change occurred about 15-20 years ago, and produced a change in a decades long trend of rising temperature to a hiatus. the other model does not show a distinct change in trend, and temperature continues to rise.
what changed on planet earth which you feel would lead to the distinct change in trend 15 years ago? this was an apparently abrupt change which has been maintained since. you should have some reason for this break from trend if you feel your temperature model is correct. on the other hand, the most recent revised models do not show this distinct, significant change in trend, indicating there was no distinct change in global temperature trend. which model is more accurately reflected by events observed on planet earth?
your problem is you believe rss and other data sets are direct, accurate measurements of temperature. they are not. they are models based on algorithms of proxy data to present an estimate of temperature. you place your faith in a false god.
I agree, all temperature datasets are models of the temperature. You then go on to make even more unsubstantiated comments observations, which make them personal opinion. The issue was whether the surface datasets were being adjusted to better coincide with the models output. I gave you and example where James Hansen, the director of NASA’s climate unit, keeper of the NASA temperature data/processing, leading originator of the climate alarmist movement, thought it perfectly logical to adjust key data for results in his paper.
How important was the subject of the paper? It was a paper estimating the cornerstone of climate, the Top of Atmosphere Energy Balance. My example was the balance of energy that gosinta and what cumsouta the planet’s atmosphere. Is it is not normal to fudge the measurement data over the black box model outputs in most sciences. If he did it for that what other areas did he also implement the same kinds of change?
As for the surface datasets, they all show the hiatus. They are different from the satellite data versions, not because something changed in the climate but the data underwent unjustified adjustment. NOAA did this: In the recent NOAA paper by Karl et al. (2015), the authors decided to adjust modern ocean buoy temperatures upward to agree with older, problematic, engine-room water-intake temperatures. The decision to adjust high quality data to agree with lower quality data is, at best, unorthodox. The authors did not give a good reason for the decision. As one defender remarked, whether one adds temperatures to the anomalies on the right or subtracts them on the left, the slope stays the same. True, but the result is to have a higher ending-temperature than if the more orthodox approach was taken. Supporters of anthropogenic global warming are then ‘justified’ in claiming an uninterrupted increase in recent temperatures and any claimed pause in warming is an illusion. The baseline dataset used for the adjustments was lower than what the the adjustments were.
The most recent major satellite adjustments was to adjust the UAH data for orbit and equipment drift and other similar well documented changes. Furthermore this adjustment was published for nearly a year before implemented. In the end the UAH data nearly matches the RSS data and after the latest NOAA adjustments (also accepted by GISS and HadCru) the surface records are now diverging even more than before.
As a quick comment re: GCMs and the satellite data, both are more similar than the GCMs to the surface data. Both similarly output a temperature average for an atmospheric 3 dimensional grid. Not so for the surface data, where great effort is needed to mix and match sub-surface sea temperature readings taken at various depths with consistent 2 meter high land readings.
corev, you still support a temperature data model which includes the “hiatus”. again this is a model, not direct temperature measurements. so there has been a correlation of measured radiance (and other proxy measurements) which then represents somebody’s best estimate of global temperature. and you are entitled to believe this model is an accurate representation. but once again, i ask you about the hiatus. this model shows a distinct change in trend after decades of temperature rise. what caused this change in trend? is it a distinct change in global climate? and if so, have we observed this event which has continued over the past 15 years? or could it be possible that the correlation used to create the data set is no longer accurate? this needs to be answered, because you are not making direct temperature measurements, you are using a model from proxy data measurements. on the other hand, other recent data models do not have the hiatus. which is most consistent with observations on planet earth?
corev, you have a lot riding on the notion of a hiatus, but i don’t think you have even considered the fact the hiatus could simply be an artifact of of the data models you have accepted as fact. considering deeper ocean data indicates there is a continued accumulation of heat content in the oceans, and sea level rise continues, one should be careful to place so much weight on the hiatus as a bedrock of one’s denier convictions.
Baffled, you persist in this falsehood: “on the other hand, other recent data models do not have the hiatus. which is most consistent with observations on planet earth?” All temperature datasets, surface and satellite, show the hiatus! WE know why some of the surface datasets have a reduced hiatus. 1) We are going through a lengthy el Nino which temporarily will raise the surface temperatures. 2) The major surface dataset have undergone a unjustified adjustment in sea surface temperatures.. I’ve already explained in the comment above why it was unjustified. What amazes me is the need to ignore such data and explanations for you own personal opinion.
Now lets briefly discuss your fixation on the OHC. Let’s move your fixation from the oceans to the land. The heat contained under the land will someday erupt and be felt in the atmosphere, just as in your assumption of the OHC.
About this time you are probably saying what a crazy comparison. They are far more similar than different. The physics are the same, fluid dynamics are still driving their changes. We have almost no measures of how much heat is resident in both media. The big difference is the time for the changes to manifest. Just as it is in comparing OHC to atmospheric heat content!
Of the two of us, you seem to be relying on the weaker arguments that are based upon falsehoods and personal opinion. Your cognitive dissonance is extreme.
CoRev,
Let me note that when somebody starts emboldening (or capitalizing) words in their posts, this is prima facie evidence that their argument is weak and that they are losing it. This is the written equivalent of shouting, and it weakens your case, not strengthens it. Rather than convincing anybody open-minded that you might be right, it mostly suggests that perhaps you need psychiatric treatment instead.
Baffled, i almost forgot the critical question. How does OHC support AGW?
What’s going on with these captchas?
Rick Stryker: Please explain your question.
James the captchas seem to be on/off. I’ve had 1 or two comments where they were required and nearly all others where none were. Don’t know ir that is RS’s issue also.
Corev,
If you solve the captcha, does your comment post? Mine never does.
I didn’t know we had any captchas active currently and I’m not sure where they’re coming from.
I believe you are using google analytics on this site. It may be that you have reCaptcha implemented from the google tools.
Hi JDH,
Whenever I’ve try to comment I’ve often been taken to the captcha page. Sometimes the captchas are pretty easy and sometimes they are so difficult that no human can reliably solve them. However, I’ve noticed that whenever I comment and solve the captcha, the comment doesn’t post. The page just hangs.
Up until recently, the way I’ve gotten around that is get a captcha challenge on going to the page initially before I comment. Then, if I solve the captcha, to the page, and comment quickly, I can usually comment without having to face an additional captcha. But over the last few days, I’ve gotten to the page without any captcha challenge. But when I comment, I get the captcha and even if I solve it the comment is not posted.
To make things more interesting, it seems to be related to the size of the comment. If I have a long comment, I get a captcha. Otherwise not. We’ll see if this comment is too long to get through.
JDH,
Since my comment got through it looks like the captcha problem may be related to the length of the comment.
Given all the comments, I find it amazing that anyone can take the once and future Democrat Donald Trump’s views about anything seriously, especially climate change. Does he really believe what he’s saying? Trump’s campaign so far has reminded me of his bet with Vince McMahon in wrestlemania 23. Each billionaire chose his champion to square off if the ring, with the loser getting his head shaved publicly by the other. This video is pretty entertaining and is strangely reminiscent of Trump’s performance at the Republican debate.
I have entered this rather late and made a number of comments, mostly directed at CoRev (one at Steve Kopits for falling for the old “let’s measure things from this ridiculous outlier, 1998, as a base” shenanigan). So, more general observations here (as somebody who has been involved off and on with climate research for over a third of a century, including with some people now identified as “skeptics,” ones with publications).
What Menzie showed in his post was the raw average global temperature trend of “anomalies” as reported by NOAA. Simply eyeballing that, one can discern a slower rate of increase for some period after 2001, but it looks as if the stronger trend may be reappearing, with in fact data so far for this year setting new highs, not that one should make too much of short period time spans. He also added a quote from a 2011 article that had Stock as a coauthor that said that what had been happening up to 2008 was consistent with models of anthropogenic influence from CO2 on warming. Nothing was said about “catastrophes.”
While lots of commentators have accused Menzie of being a “socialist” or “leftist” or whatever for posting this, I note that he said not a single word about what politcies should or should not be done about this. It is indeed the case that in the US (and also China), GDP will probably be increased by about another degree F at least of warming (lower winter heating bills offsetting several other areas where losses will occur), with it going negative after that, whereas for poorer tropical countries (especially low-lying ones like Bangladesh) any further average global temperature increases will be damaging, and for small island ones possibly “catastrophic,” to use a word that CoRev likes to embolden as he frequenstly uses it.
So, what should be the policy response to all this is very much a matter of wide open public debate, with huge debate over whether taxation versus cap and gains being a big part of it, even if one can agree on how much if anything should be done. Without doubt banefit-cost analysis is relevant, and we must recognize that there are lots of uncertainties about lots of the numbers going into the debate, including a considerable variance regarding the likely future trend.
As a personal aside, I note that there is a current fad for Pigouvian taxes,some of this driven by reaction to problems in the European carbon market. But taxes have their own problems, with an effort over a decade ago by the Nordic nations to set up a harmonized system of carbon taxes that would be adjusted at their borders failing. However, I must admit that I am biased as having been part of setting up the world’s first cap and trade (or tradeable emissions permits) system in the world back in the mid-1970s for BOD pollution on the Fox River in northeastern Wisconsin. But, I think the current fad for Pigouvian taxes is overblown and problematical, but this is an aside, given that Menzie did not even discuss policy. All he did was post the temperature trend chart, and he got accused of all sorts of things by a whole bunch of people calling names, but then getting all sensitive and hurt when people called them names back. What an embarrassiung spectacle a lot of you have put on. Really, all of you calling Menzie names should be ashamed of yourselves.
Oh, I understated how long I have been involved with climate research. It is over 40 years. Going senile I am, :-).
Barkley very interesting series of general comments with zero specifics. I’ve showed data and trends. referenced papers, showed how the current (Karl et al 15) NOAA adjustments are unjustified, and finally explained why AGW is a hoax. Did you choose to address any of them? None.
I know some one with 40 years association with climate science knows the name Kevin Trenberth. His science is beyond recent, it will be printed in tomorrow’s issue. When you ask for papers here’s the latest of many trying to explain the pause/hiatus. http://www.sciencemag.org/content/349/6249/691.full
I will present just some of the sections I consider important, and yes, I will bold those points so that no one misses the specific point
” However, the role of human-induced climate change has been discounted by some, owing to a markedly reduced increase in global mean surface temperature (GMST) from 1998 through 2013, known as the hiatus (1–3).”
and there is much meat between these two comments
“Because of global warming, numerous studies have found large regional trends over the past 40 years or so, the period for which we have the best data. However, the associated changes in the atmospheric circulation are mostly not from anthropogenic climate change but rather reflect large natural variability on decadal time scales. ”
Menzie sarcastically claims “Global Warming” is a hoax due to his selected source The Donald, and seems to rely on a paper claiming there is no pause/hiatus. In it though this can be found:
“The original statistical model (7) is estimated with data through 1994. Here, we update the model by estimating it with data through 1998. The
selected sample ends just before the recent period of slowed warming. As such, the parameter estimates do not use information about the post-
1998 period. Model simulations reflect these pre-1998 parameters and post-1998 observed levels of radiative forcings, SOI, and volcanic sulphates.”
For some reason you come forward late with no data, references and just opinions, arrogance and sarcasm while only making the most general of opinionated comments. Was Menzie correct that the now quite old Stock paper supported his sarcasm about the “hoax”? Trenberth also took on the Karl et al 15 adjustments to the NOAA data, Ya’no the dataset Menzie chose to use while ignoring the satellite data. So is the pause/hiatus important?
So if you are not going to add anything of value to the conversation, why join?
CoRev,
I am not going to post beyond this. I did not come in earlier because I had not looked at the blog for some days as I am very busy with some professional academic work that is on a deadline. As it is, if I had time I would have replied to many more of your posts than I did that contain egregious errors of various sorts. Needless to say, I am not surprised that you have announced that you will be showering folks here with more papers you have pulled up from wherever, with your misinterpretations and errors that some others have done their best to reveal, but I figure any effort on my part will lead you to refuse to admit your errors and just continue, with our emboldening, which is the sort of thing that people like you do, which I am not going to characterize more specifically beyond what I have already said.
Anyway, my only other comment is that while you complained that I did not cite any papers, I notice that you provided zero refutations of anything I have said, and you will not be able to because I am completely correct. Deal with it, CoRev, and frankly, you are just wasting your time here. People see through you, and it became clear what you are the minute you attempted to turn Mark J. Perry into someone somehow superior to Menzie Chnn in any way whatsoever. This is an econoimics blog, and we do know who our people are and what they are worth.
Goodbye and good riddance.
Barkley, I did not respond because you did not actually make or refute any points except for the personal attacks. This BTW way is symbolic of the quality of your comments: “People see through you, and it became clear what you are the minute you attempted to turn Mark J. Perry into someone somehow superior to Menzie Chnn (sic) in any way whatsoever.” Is that what triggered your reaction to Global Warming commentary? T’wasn’t me, and I never participated.
Kevin Trenberth’s paper/article is an interesting read if you wish to actually research the subject. And, quite an admission if you can get past the reaction to the my bolding to accept or even review his points. One of the alarmist stalwarts having serious doubts about the AGW hypothesis???? But, you, an economist with 40 years of association with climate science have none. Yup! Got it! Just like all the others supporting the hypothesis, critical thinking is no longer required. Personal opinion, yours in particular, is fully supported by “the one” science that is settled.
Goodbye and good riddance back at’cha!
I shall bother with one more fact. When I was first involved with climate science it was with a group in the early 70s that was studying the possibility of global cooling. While this is not accepted by most AGW enthusiasts, I actually know the lit, and in 1971 it was evenly split between those who thought the cooling effects of rising aerosols would dominate versus those who thought the warming effects of rising CO2 effects would dominate, with many saying it was unclear. Those ice age stories were not just a Newsweek cover story as many now claim. I actually published a letter in the Washington Post back in the 1970s pointing out this split. As it was, for a variety of reasons the lit (that is, the generally accepted scientific view) shifted to that CO2 would beat aerosols within a few years, even prior to the actual emergence of the warming trend, which began basically in the early-to-mid-70s. So you are not dealing with somebody who is a thumb-stuck-up-his-behind AGWer, and I regularly point out things that most of them do not, such as the one I made above as to how in fact a bit more warming is in fact favorable for US GDP, if not for Bangladesh;s.
Oh, and like JDH, I happen to support the XL pipeline, if not with great enthusiasm.
Now I am really outtahere.
Well, looking at the chart above, it might as well explain some things then. Perhaps the people in the late 1800 intuitively felt the world was cooling off and knowing that the last extinction event was triggered by ice not heat, they panicked and intuitively sought out a solution to prevent the imminent apocalypse upon them and then by magic, puff …. , the drill baby drill strategy was conceived. Ok, so now you are saying we have the reverse problem. Right, let’s get onto it then.