Do stock price indices follow a random walk? No, but log stock price indices do…kind of
Here’s a graph of the Standard and Poors 500 price index, level (blue) and the log (red).
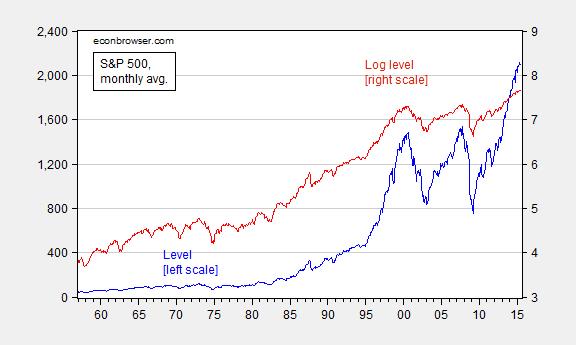
Figure 1: S&P 500 stock price index (blue, left scale) and log (red, right scale). Source: FRED, and author’s calculations.
Both processes look nonstationary, but the levels process more so (technically, “explosive”). Which one is the more appropriate to examine? A little theory might be helpful. Consider an asset pricing model for stocks. Ignoring dividends,
Pt = (EtPt+1)/(1+i)
Where P is the stock price, i is an interest or equity discount rate, and Et(.) is an expectations operator, conditional on time t information. Notice if errors are normally distributed, then the price level at t+1 is a multiple of that at time t (imposing an auxiliary assumption that the interest rate is constant and nonstochastic). Assume instead expectations errors are log-normally distributed (where p denotes log(P)). Then:
pt = Etpt+1 – ln(1+i)
pt+1 ≈ pt + i + et+1
Where et+1 is a true innovation. If one runs a regression in levels, the coefficient on the lagged variable is 1.04, and the process appears explosive. In logs, one obtains:
pt = 0.0052 + 1.0000pt-1 + ut
Adj.-R2 = 0.999, SER = 0.035, Nobs = 702, DW = 1.47.
The coefficient on lagged (log) price is not statistically significantly different from one.
Another hint about what specification is more appropriate comes from inspection of the first differences. Figure 2 depicts both.
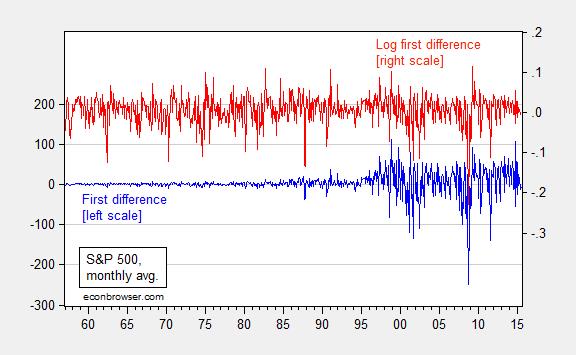
Figure 2: First difference of S&P 500 stock price index (blue, left scale) and first difference of log (red, right scale). Source: FRED, and author’s calculations.
The log first differences exhibit much less heteroskedasticity, and the distribution is less fat-tailed.
Note that in neither levels nor logs are these classic random walks (where the residuals are true innovations). The errors reject the no serial correlation null and no ARCH effects. But less so for the logs specification.
Digression: Great post from David Giles, on retrieving elasticities from different specifications (h/t Mark Thoma).
The annual NYSE volume in the mid-60’s was about 1 billion. I didn’t want to get into this deeply but I know the annual volume in the early 2000’s was about 350 billion. Comparing those eras requires a scaling method … like logs.
Menzie,
I’m not sure I understand your point in this post. Some questions:
1) How did you conclude that the coefficient on the lagged logged variable is not statistically significant from one? If you used that same argument on the coefficient of the level variable that estimated explosive, could you also conclude that the coefficient is not statistically different from one?
2) Why do we care that the log difference specification shows less heteroskedasticity and less fat tails? Why does that induce you to prefer the log specification?
Rick Stryker:
1) Standard errors for levels specification indicate I could reject a coefficient of unity on the lagged dependent variable. On the other hand, in the log-level specification, I cannot reject the unit coefficient.
2) Example: Consider ADF test regression (a zero lag ADF is isomorphic to this regression). Proper inference requires normally distributed residuals…
Menzie,
I guess I’m not seeing it unless I misunderstand what you are saying.
1) If you can reject rho = 1 on the levels specification, are you then saying it’s a stationary series, i.e., rho < 1? That's not plausible although the alternative that the series is explosive is even less plausible. How did you do this test? Is it the standard regression test, i.e., (rho – 1)/s.e.(rho) distributed asymptotically normal or something else?
2) Why do you need normally distributed residuals for an ADF test regression? Asymptotically, you don't need that and you do have a pretty large sample here.
Rick Stryker:
1) In level Y[t] = alpha + 1.04Y[t-1]. Using the standard errors churned out by OLS, I can reject a unit coefficient. Now, it’s likely that in finite samples the estimated coefficient is far from the true, so the standard errors are likely distorted. But this was a quick pass. More formal testing discussed in this paper. To be clear, I haven’t done this.
2) I dunno, is 700 observations big or small? Depends on what you’re looking at. Testing hypotheses serial correlation properties, I like to remember Summers’ paper at such times.
Menzie,
But what you did do is invalid. The whole point of the unit root literature is that you can’t do standard OLS hypothesis tests under the null hypothesis that rho = 1, since the distributions of the test statistics are non-standard, being functionals of Brownian motion.
Since these series are trending, you would need to have estimated the regressions with a time trend included and then tested the hypothesis that rho = 1. Given that the residuals show evidence of heteroskedasticity, you could account for that using something like the Phillips-Perron adjustment to the test statistics. I’m not disputing that you would still find that rho = 1 for the log of the S&P 500, which I think is a standard result. But I would think it a pretty weird situation if you didn’t conclude the same for the level of the S&P. That the level of the series is truly explosive just isn’t plausible. But I’ve never done the tests so I don’t know what you’d find.
I don’t get your second point either. These tests are generally justified asymptotically and in this case the number of data points you have should make you feel more comfortable about this assumption, given the typical size of data sets. If you had to establish that the residuals are normal before doing ADF tests, which they never are, no one would ever do these tests at all.
Moreover, I don’t understand why you are worried about heteroskedasticity and fat tails. The change in the logs of the S&P 500 on higher frequency data, such as daily data, can be well-described by an EGARCH process in which the conditional (as well as the unconditional) residual distribution has fat tails. Heteroskedasticity and fat tails are a feature of the data.
Rick Stryker:
1) Concur I didn’t the “right” thing. But what you propose is not “the right thing” either. As far as I can ell, the Phillips article I linked to is more “the right thing”. By the way, if I do a Phillips Perron test w/constant, I get a positive t-stat consistent with explosive series on levels, not so in logs.
2) See page 120 here. I think in an ADF test you do want at least homoskedasticity.
I think acres burned data would make some of these points more forcefully. For example, in levels the data are clearly heteroskedastic. In logs, not so much.
It would probably be a good idea to explain the difference between an explosive coefficient (e.g., 1.04) and a unit root coefficient that is not significantly different from 1.00.
Menzie,
No, I think the procedure I proposed is the right thing. You’d want to start the analysis with the standard tests for both series, which is what I proposed. If you did reject the null that the coefficient rho is 1 on the levels series using Phillips-Perron, then you’d want to explain that. As I mentioned, given your simple autoregressive specification, neither alternative possibility is plausible: rho 1 implies the levels series is explosive. Phillips, Shi, and Yu agree with my earlier point that rho > 1 (1.04) in your regression is implausible, since they say about equation (5) in their paper, which corresponds to your levels regression, that:
“Model (5) is formulated with a non-zero intercept and produces a dominating deterministic component that has an empirically unrealistic explosive form (P. C. B. Phillips and J. Yu, Unpublished Manuscript 2009, PY hereafter). Similar characteristics apply a fortiori in the case of the inclusion of a deterministic trend term in model (6). These forms are unreasonable for most economic and financial time series and an empirically more realistic description of explosive behaviour is given by models (4) and (7), which are both formulated without an intercept or a deterministic trend.”
Put another way, if I believed that your levels regression of the S&P 500 were correct and the series really is explosive, I think I’d want to re-allocate my 401K!
Phillips, Yi, and Shu form a more realistic alternative hypothesis of a time series that exhibits bubble behavior that periodically collapses, so that it is not permanently explosive. I’d agree with you that this is a sensible test to run to explain your finding on the level of prices.
Sorry, that should read above:
neither alternative possibility is plausible: rho 1 implies the levels series is explosive.
That’s interesting. The blog software is truncating the words so that I got the same error the second time. Anyway, I’m trying to say that the alternative to a unit coefficient in the regression is that the levels series is either stationary or explosive, neither of which is plausible.