The Shanghai stock market has undergone some wild gyrations over the last year… and back in 2008. Following up on To Log or Not to Log, Part IV:
Here’s the picture, as usually depicted.
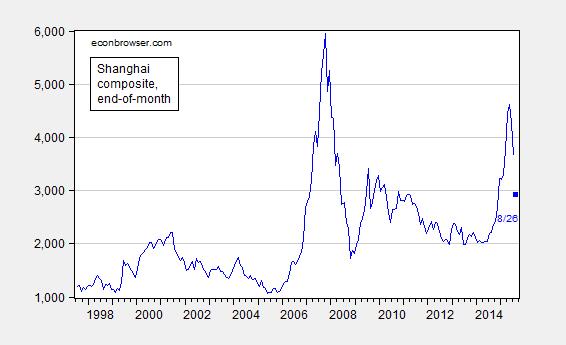
Figure 1: Shanghai composite stock market index, end of month close. August observation is for 8/26. Source: Quandl.
The movements look a bit different (but still scary) in logs.
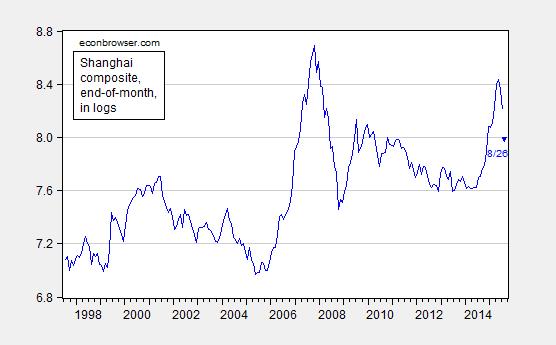
Figure 2: Log Shanghai composite stock market index, end of month close. August observation is for 8/26. Source: Quandl and author’s calculations.
I think those look quite similar and not very scary. I know there’s been a big decline but it follows a huge, rapid increase – which the log scale captures nicely – and things were obviously much worse only a few years ago and China blew past that problem.
You are used to log the series, so log(5000) shows at 8.5, which is weird for someone used to the levels and numbers.
I am a advocate of using logs, but however I would use an logged axis, similar to monolog paper (http://fisica.uems.br/lab1/monolog.pdf).
This way, your numbers are still preserved.
What you are interested in, as a long term investor, is the REAL return,
market value plus reinvested dividend minus tax and inflation
http://de.slideshare.net/genauer/sp-500-long-term-real-return-is-4
What is short term (less than 5 years) a non-Gaussian random walk diffusion + jump process,
is long term a pretty well defined development, a constant share of GDP going to capital