As does the fiscal experiment.
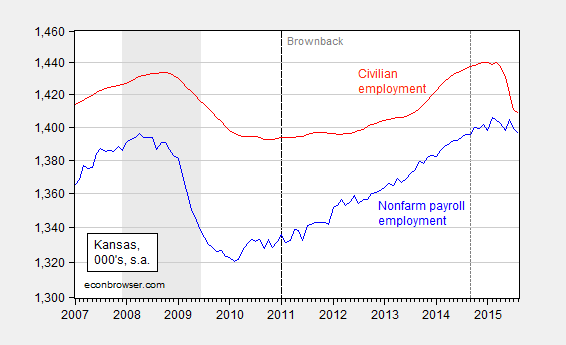
Figure 1: Kansas nonfarm payroll employment (blue), civilian employment (red), in 000’s, seasonally adjusted, Log scale. Dashed line denotes last period establishment series is QCEW benchmarked. Source: BLS.
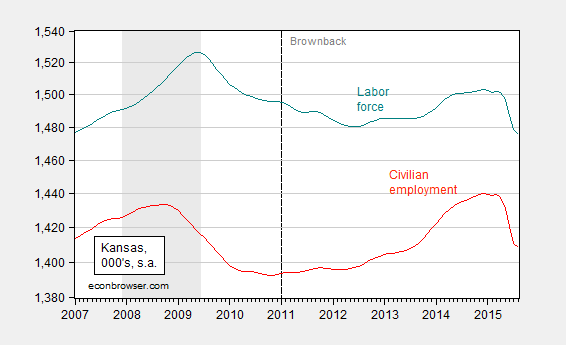
Figure 2: Kansas labor force (teal), civilian employment (red), in 000’s, seasonally adjusted. Log scale. Source: BLS.
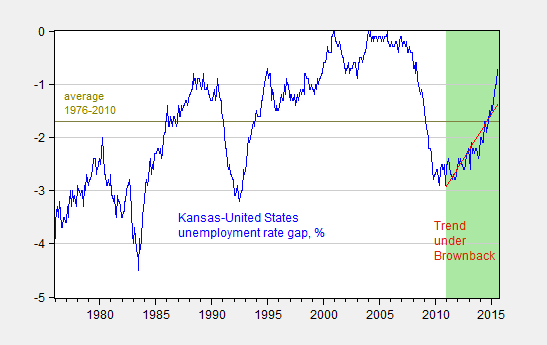
Figure 3: Kansas minus US unemployment rate, in percentage points (blue), and linear trend in this differential over the Brownback terms (red). Average over 1976-2010 (chartreuse) Green shaded area Brownback terms. Source: BLS, and author’s calculations.
Update, 9/19 9:45am Pacific: Kansas City Fed documentation of various Kansas indicators relative to Nation’s, here. The precarious state of the budget is discussed here.
Update, 9/21: As noted here, the Kansas Governor’s Council of Economic Advisors’ reports are no longer being posted online.
The postings stopped during last year’s statewide elections, with the council’s director saying it was “the subject of careless scrutiny.” A representative of the Kansas Department of Commerce said the IKE reports were dropped because they were viewed as a comprehensive overview of the state economy, rather than a snapshot of indicators. The public can request a copy of the report, he said.
Julian Silk conjectures that the collapse is partly driven by the drop in mining and logging activity. This might be true qualitatively but does not seem quantitatively important. See the Figure below.
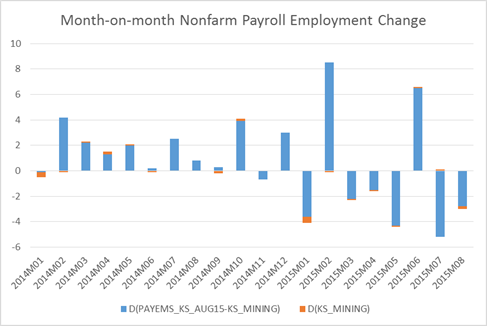
Figure 4: Change in employment in Kansas mining and logging (orange) and in rest-of-nonfarm payroll (blue). Source: BLS and author’s calculations.
Update 9/22: See also this assessment by KC Fed economist Jason Brown.
Are there a lot of people who are not in Kansas anymore – or are they just not employed i Kansas anymore.
DeDude: Hard to say; the population increased by 8,220 from mid-2013 to mid-2014, 0.3% growth. Could be in 2015 it’s actually negative growth.
Looking at the borrowing numbers (http://www.kansasbudget.com/2015/08/record-borrowing-indicates-financial.html), to me, it looks like things started going pearshaped in 2000. Brownback tried some economic voodoo and it did not work. I am not sure anything would work. I wonder if states can get trapped in economic cycles they can’t control with tax or spending policies. I once was an adjunct prof at UK. Loved the place and the kids.
Was reading your favorite governor has hit the zero bound. Polls that is. Seems the product that dominates in WI does not do well Nationally. More salesmanship needed STAT!
Menzie, do you think other factors could be at work here other than a “fiscal experiment?” What caused the other variations in those graphs in earlier years? How do you know its not something else?
Dear Menzie,
There is no love lost by me for the Kansas experiment, and the constant lag of manufacturing employment seems to strongly justify the critics. But the real collapse in the thing seems to have happened over the summer with the collapse in mining and logging employment. Was there something special that occurred – e.g., loans came due for oilfield projects and the oil prices weren’t there to pay for them – that sparked this worsening? Neither oil nor natural gas prices changed much over the last few months, so the collapse seems very surprising.
Julian
Julian Silk: Not sure. Added Figure 4, which provides an employment decomposition.
Menzie, Kansas looks terrible. I was wondering if you had any thoughts on the recent improvement in Philadelphia FRB Coincident Activity Index for Wisconsin? Data was released last week. I see growth of 4.4% over the last year. We have not really seen that sort of growth since the late 1990s.