Thank goodness for Kansas, it makes even Wisconsin look good!
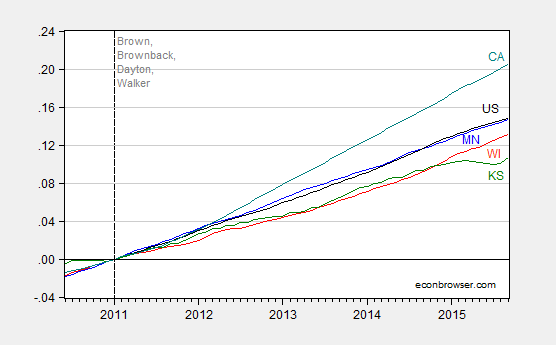
Figure 1: Log coincident indices for Minnesota (blue), Wisconsin (red), Kansas (green), California (teal) and US (black), all normalized to 2011M01=0. Dashed line at 2011M01. Source: Philadelphia Fed September 2015 release, and author’s calculations.
One criticism leveled against this graph, where I have normalized on a level at a certain date, is that it abstracts from trends. The question is what trend to use. I use the concept of cointegration to identify a trend, rather than using a time series model (either linear deterministic trend or a random walk with drift). Hence, I am constructing a counterfactual; disbelievers in such things should click elsewhere.
I follow the procedure used in this post:
The logs of the coincident series for Wisconsin and the US do not reject the I(1) null at conventional levels. At the same time, they appear to be cointegrated according to standard test (Johansen, constant, no trend, 2 lags of first differences, at 5% msl).
Hence, I estimate a single-equation error correction model, assuming US economic activity is weakly exogenous for Wisconsin, over the 1990M01-2010M12 period. Let wi be the log coincident index for Wisconsin, and us be the log coincident index for the US. Δ is the first difference operator. The resulting estimates are:
Δwit = 0.008 – 0.0060wit-1 + 0.0042ust-1 + first and second lags of first differences
Adj-R2=0.92, SER = 0.00074, N = 252. Significance at 5% msl using HAC robust standard errors denoted by bold face.
Observation 1: This is a pretty high coefficient of variation. Statistically, the m/m growth rate in Wisconsin economic activity is well explained.
Observation 2: The cointegrating relationship between Wisconsin output and US is about 0.70.
I use the equation estimated over 1990-2010 to dynamically forecast out of sample over the 2011M01-2015M03 period, taking as given the ex post realization of the US coincident index. (Technically this is a ex post historical simulation.)
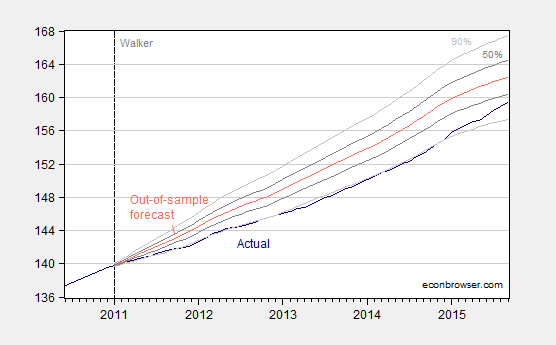
Figure 2: Coincident index for Wisconsin (dark blue), forecast (red), 50% confidence band (dark gray), and 90% confidence band (light gray). For forecast, see text. Source: Philadelphia Fed and author’s calculations.
This outcome suggests that Wisconsin has been underperforming since 2011M01 relative to a counterfactual based on historical correlations in place over the 1990-2010 period. As of September 2015, actual activity is 1.9% (log terms) below what it should be.
Using GDP figures reported in the Wisconsin Department of Revenue’s May 2015 Economic Outlook, and assuming the coincident index shortfall is proportional to the real Gross State Product (GSP) shortfall, I calculate the cumulative loss since the beginning of 2011 is about 18.6 billion Ch.2009$, representing about 6.7% worth of 2015 forecasted GSP (according to Wisconsin’s Department of Revenue).
I would be somewhat wary of putting too much weight on the surge in activity registered in the last year which puts the actual within the 90% band. That’s because the last year’s worth of data do not incorporate directly the Quarterly Census of Employment and Wages (QCEW) data that the Walker Administration has touted as being very precise (at least, in the past; that refrain is seldom heard now). More discussion of this issue here.
See more on the Governor’s assertion that Wisconsin is moving in the right direction.
Over the last 12 months, whag is the growth rate on this coincident activity index for Wisconsion and Minnesota, respectively?
Neil: Wisconsin 3.9%, Minnesota 3.0%, m/m annualized in log terms. The difference in growth rates is not statistically significant at the 5% msl, using White standard errors.
Who could have thunk that reducing demand by cutting incomes to consumer class individuals; then handing that money to investor class individuals; in an economy that operates below capacity; would be bad for economic growth. I mean its not like the GDP formula is a 5’th grade math problem –or what?