That’s the title of a op-ed written by Governor Walker. I’ll let others assess some of his assertions, but I do wonder about the veracity of the depiction of a buoyant Wisconsin economy.
First, consider employment. Month-on-month nonfarm payroll growth is flat, while private employment declined in preliminary estimates for September.
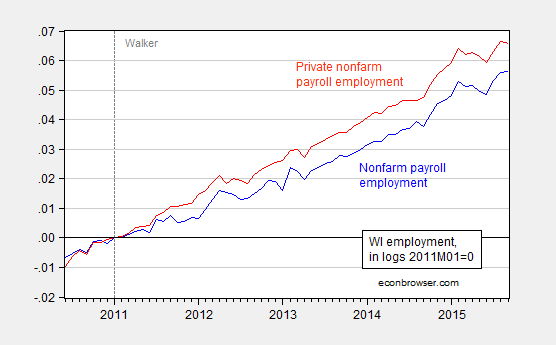
Figure 1: Wisconsin nonfarm payroll employment (blue) and private nonfarm payroll employment (red), s.a., in logs normalized 2011M01=0. Source: BLS and author’s calculations.
As noted elsewhere, Wisconsin employment growth lags that of the US (and neighbor Minnesota).
The Governor cites unemployment rates; he omits the fact that Wisconsin unemployment rates throughout the period for which data are available are typically lower than that in the US overall — about 0.77 percentage points. Figure 2 shows the US minus WI unemployment rate differential, with the 1976M01-2010M12 average in orange.
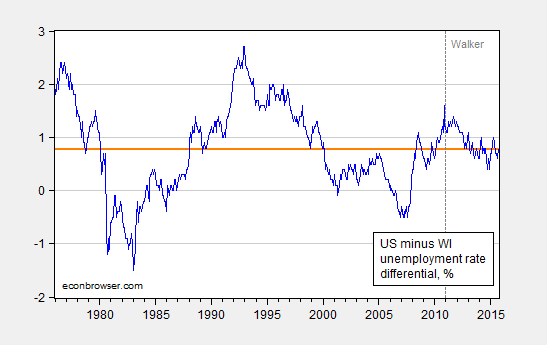
Figure 2: US minus WI unemployment rate, s.a., in % (blue) and 1976M01-2010M12 average (orange bold line). Source: BLS and author’s calculations.
Not only is Wisconsin’s unemployment performance exactly where one would expect on average, over the Governor’s tenure, the US has improved more rapidly than Wisconsin, in terms of unemployment!
Finally, mass layoffs are rising. Figure 3 depicts numbers reported through October 16th of each year, and those numbers normalized by nonfarm payroll employment in September of each year (October figures for 2015 not yet available).
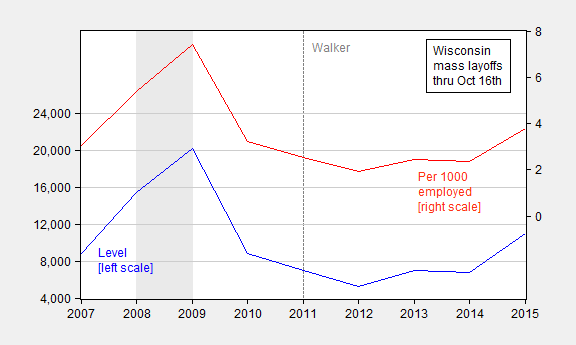
Figure 3: Mass layoffs, reported through October 16th of each year (blue, left scale), and per 1000 nonfarm payroll employed (red, right scale). NBER defined recession dates shaded gray. Source: DWD, BLS, NBER and author’s calculations.
I let the reader decide whether Wisconsin is “moving in the right direction”.
You say “I let the reader decide” but you know many of your readers don’t care about data. Maybe you should say, “I know the knuckleheads won’t listen.”
the graphs are so bad, the authors PhD should be revoked
just take the first one – almost no pre walker history to judge trend, and the ludicrous one data point comment “private employment declined in preliminary estimates for September. ”
i don’t get why people take this blog seriously; if a student turned in a paper like this she would get red blasted
ezra abrams: If you click on the second link in the post, you see a post with three graphs with data running back to 2007, and regression results (used to conduct an ex post forecasting simulation) based on data going back to 1990. The the monthly state-level (establishment) data extends back to only 1990, so I regret to inform you I did not use a sample encompassing the Revolutionary War.
Menzie: Across a broad spectrum of economics, the data this recovery show that many previously robust pre-crisis relationships no longer hold in this post-crisis era. Much has changed. Hence I deem it unwise to use an error correction model based on pre-crisis observations to make post-crisis projections. The model you refer to does exactly this. Since the correlation between WI (or any other state) and the US would be strong during the downdraft phase of the 2008-9 recession, the post-crisis starting point should be placed no earlier than the recovery month of July 2009. Hence 18/247ths of your estimating observations are pre-crisis. Pre-crisis estimation dominates your post-crisis forecast. My argument is that the structure of the economy has changed, and on a case to case basis without good reason it is not appropriate to put much weight on parameters estimated from mostly pre-crisis data if they are going to be used for current period forecasts.
We observe that US and WI nonfarm payroll employment bottomed in Feb 2010. That gives 10 months of pre-Walker post-crisis data (Feb as the base). WI employment rose at a monthly rate of .097%. Ideally, a multistate structural model is what’s called for. In lieu of this, one can simply ask did WI did as well or better in the Walker era than during the 10-month period before Walker took office. Answer, yes. Latest month (Sep 2015) actual = 2900. Projected WI employment based on extrapolating the 10-month pre-Walker trend = 2891.
Many reading this will say 10 months is a slender reed. To which I’d say, exactly my point! Old relationships estimated with pre-crisis data are also a slender reed. The statistics appear robust but that’s only appearances. There can be no substitute for either (a) structural models with appropriate independent variables also taking account of the wrenching structural change in 2008 or (b) error correction models estimated on data wholly within this new era and not from before, or (c) long wave models for which what is happening at present is a natural part of the model.
It is difficult for a business to grow if they can’t get their products transported: “Gov. Walker addresses construction delays, asks to borrow $350 million”
http://wbay.com/2015/10/20/gov-walker-in-fox-valley-to-address-plans-to-avoid-construction-delays/
“Some road construction projects could be delayed in Wisconsin until 2022”
Also, difficult to have a quality workforce if local schools are not funded: “Most of Wisconsin’s public school districts will receive less state aid this year than last year, according to figures released by the state Department of Public Instruction.”
http://www.wauwatosanow.com/news/tosa-schools-state-aid-cut-14-percent-b99598195z1-335076391.html
I see that over the last year, nonfarm payroll employment has been growing faster in Wisconsin than in Minnesota by slightly over 0.5ppt.
Why is it a bad thing that Wisconsin is moving at the US average on unemployment? Does Wisconsin have massive oil production of the Dakotas? Does it have the low tax structure of Texas? Wisconsin is moving toward Texas on taxes, regulation, and government spending but it is still ahead of Minnesota. Minnesota has the luxury of an historical lower tax and spend structure than Wisconsin. Menzie has a habit of comparing apples and oranges.
I would be curious how public employment has grown in Minnesota versus Wisconsin.
There is a term, “fall out blessings,” that is important to this analysis. When an irresponsible government lives off of a past responsible government times can be very good – for a while. “Whatever a man shall sow, that also shall he reap.” Minnesota and Wisconsin are in the planting season. Let’s see what the harvest brings.
Four years is a long planting season — what are you raising, oak trees?
Spencer,
As I said Wisconsin is still in the planting season. Four years is a long time but the Wisconsin Democrats have prevented the tax structure of Wisconsin from falling below that of Minnesota. If Republicans attempt to plant oak trees but the Democrats keep pulling them out of the ground, you may not get a crop in 8 years.
You are on drugs. Democrats haven’t had an ounce of power for years. Republicans do what they want when they want.
To say otherwise shows a willful ignorance that is awe-inspiring.
Colorado’s unemployment rate is very low (10th in the nation, even lower than Wisconsin’s, which is also doing well at 15th). Colorado is extremely economically conservative due to the 1994 Taxpayer Bill of Rates (TABOR) that maintains very low tax rates for individuals and corporations (4.6%) and makes it unconstitutional for government revenue/spending to increase beyond inflation/population gains without voter approval. This economic-conservatism makes it very appealing to both companies and individuals. Furthermore, Colorado’s educational system performs well (well, most of it does) despite spending relatively little on education.
And the low unemployment number is occurring despite a slowing of the oil industry in northern Colorado. And we have legalized marijuana, which should help the general overpopulation of prisons that is occurring in the United States. Based off of Colorado’s experience, all states should be economically conservative!
How does more pot heads, like more alcoholics, reduce crime?
A drink in one hand and a joint in the other is a powerful combination.
At least you can’t get drunk on a glass of wine.
When you decriminalize or legalized something, you get more of it:
Marijuana use, disorders doubled since 2001
Reuters
Oct 22, 2015
http://www.reuters.com/article/2015/10/22/us-health-marijuana-use-disorders-idUSKCN0SF2NC20151022
because they are economic substitutes, not economic compliments
The proportion of the U.S. population using alcohol hasn’t changed much:
http://www.gallup.com/poll/1582/alcohol-drinking.aspx
http://www.gallup.com/poll/141656/drinking-rate-edges-slightly-year-high.aspx
However, U.S. consumption of stronger drinks increased:
http://blogs.wsj.com/numbers/anatomy-of-american-alcohol-consumption-1522/
Yet, marijuana users doubled. Perhaps, marijuana has become stronger?
Is turning most Americans into pot heads a worthy goal?
peak, you probably have to be careful accepting the marijuana usage rates from polls. this is an illegal drug, and as such accurate polling numbers may be difficult to come by-although trends may be observable. in addition, a decade or two ago, people were probably far less inclined to honestly fess up to illegal drug use compared to today, where the political and criminal climate are a bit moderated towards that activity. this factor alone would probably show an increase in usage over time from the polls, irregardless of whether the increase is truly happening.
Baffling, if you read the article, marijuana abuse and dependence doubled too.
The U.S. had the drug revolution in the ’60s and ’70s that came out of hell and spread like wildfire when drug laws were lax and lenient.
The reality is tough laws, like hanging horse thieves in the Old West, are very effective in preventing crimes.
There are other ways to measure changes in drug or alcohol usage:
Actually, Prohibition Was a Success
New York Times
October 16, 1989
“What everyone ”knows” about Prohibition is that it was a failure. But the conventional view of Prohibition is not supported by the facts.
First, the regime created in 1919 by the 18th Amendment and the Volstead Act, which charged the Treasury Department with enforcement of the new restrictions, was far from all-embracing. The amendment prohibited the commercial manufacture and distribution of alcoholic beverages; it did not prohibit use, nor production for one’s own consumption. Moreover, the provisions did not take effect until a year after passage -plenty of time for people to stockpile supplies.
Second, alcohol consumption declined dramatically during Prohibition. Cirrhosis death rates for men were 29.5 per 100,000 in 1911 and 10.7 in 1929. Admissions to state mental hospitals for alcoholic psychosis declined from 10.1 per 100,000 in 1919 to 4.7 in 1928.
Arrests for public drunkenness and disorderly conduct declined 50 percent between 1916 and 1922. For the population as a whole, the best estimates are that consumption of alcohol declined by 30 percent to 50 percent.
Third, violent crime did not increase dramatically during Prohibition. Homicide rates rose dramatically from 1900 to 1910 but remained roughly constant during Prohibition’s 14 year rule. Organized crime may have become more visible and lurid during Prohibition, but it existed before and after.
Fourth, following the repeal of Prohibition, alcohol consumption increased. Today, alcohol is estimated to be the cause of more than 23,000 motor vehicle deaths and is implicated in more than half of the nation’s 20,000 homicides.”
Hey Menzie you again forgot to correct for what Wisconsin would look like if it defunded its pensions to match Minnesota and Illinois and whoever else you compare it to.
MMMMM? The NY Times had this article that might add some info as to why WI is slowing. Maybe. http://www.nytimes.com/2015/10/25/business/energy-environment/americas-heartland-feels-a-chill-from-collapsing-commodity-prices.html?hpw&rref=business&action=click&pgtype=Homepage&module=well-region®ion=bottom-well&WT.nav=bottom-well
The Times is not a real go to source so read with a shovel of salt.
The Philadelphia FRB released their coincident activity indicators last Friday. Over the last year, Wisconsin is up 4% while Minnesota is up 3.1%. It appears that Wisconsin has been outperforming Minnesota fairly consistently since the summer of 2014. Of course, Wisconsin’s economic performance had been lagging Minnesota from 2008 to 2013. Am I reading the data right?