With implications for assessing Wisconsin post-January 2011.
There has been some debate regarding the pace of economic growth in Wisconsin over the past four years. In order to compare the outcome with what might be expected, I construct a counterfactual, based upon the historical correlation of Wisconsin economic activity with US economic activity over the 1990-2015 period. I use as a proxy for economic activity the Philadelphia Fed’s coincident indices, which apply the Stock-Watson approach to extracting a state factor from multiple time series (of possibly differing frequencies).
The log of the coincident series for Wisconsin and the US do not reject the I(1) null at conventional levels. At the same time, they appear to be cointegrated according to standard test (Johansen, constant, no trend, 2 lags of first differences, at 5% msl).
Hence, I estimate a single-equation error correction model, assuming US economic activity is weakly exogenous for Wisconsin, over the 1986M01-2010M12. Let wi be the log coincident index for Wisconsin, and us be the log coincident index for the US. Δ is the first difference operator. The resulting estimates are:
Δwit = 0.008 – 0.0064wit-1 + 0.0047ust-1 + first and second lags of first differences
Adj-R2=0.92, SER = 0.00076, N = 252. Significance at 5% msl denoted by bold face.
Observation 1: This is a pretty high coefficient of variation. Statistically, the m/m growth rate in Wisconsin economic activity is well explained.
Observation 2: The cointegrating relationship between Wisconsin output and US is about 0.62.
Observation 3: Estimating the equation over the entire 1990M01-2015M03 yields similar coefficients with statistical significance. A Chow test at 2011M01 rejects the constant coefficients null.
I use the equation estimated over 1990-2010 to dynamically forecast out of sample over the 2011M01-2015M03 period, taking as given the ex post realization of the US coincident index. (Technically this is a ex post historical simulation.)
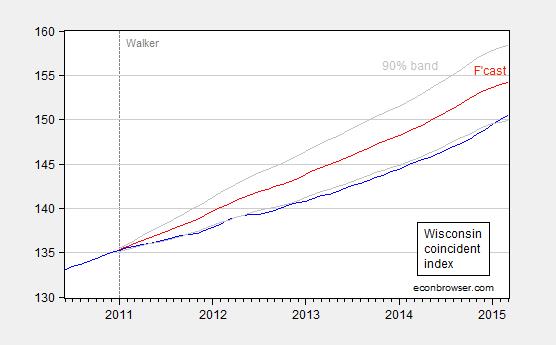
Figure 1: Coincident index for Wisconsin (blue), forecast (red), and 90% confidence band (gray). For forecast, see text. Source: Philadelphia Fed and author’s calculations.
This outcome suggests that Wisconsin has been underperforming since 2011M01 relative to a counterfactual based on historical correlations in place over the 1990-2010 period. As of March 2015, actual activity is 2.4% (log terms) below what it should be.
I would be somewhat wary of putting too much weight on the surge in activity registered in the last few months which puts the actual within the 90% band. That’s because the last six months of data do not incorporate directly the Quarterly Census of Employment and Wages (QCEW) data that the Walker Administration has touted as very precise.
The specification is very simple. One thing it omits is the differential impact arising from shocks, such as the dollar’s movements. Given the relatively heavy share of manufacturing, one would think Wisconsin should have disproportionately benefitted from the weak dollar until about six months ago. And yet, Wisconsin has been underperforming for most of the past four years, according to my estimates.
Meanwhile in the real world; http://papers.ssrn.com/sol3/papers.cfm?abstract_id=2605533
‘ By analysing financial-market movements caused by clearly exogenous changes in expectations about the election winner, I find that market participants expected higher equity prices and a stronger exchange rate under a Conservative Prime Minister than under a Labour P.M. There were little to no partisan differences in interest rates, expected inflation, or commodity prices. These results cast doubt on the empirical validity of zero-lower-bound New Keynesian models.’
The results were virtually instantaneous. Within one minute of the exit polls being released.
Patrick R. Sullivan: A plausible alternative implication is that Conservatives will lower the tax rate on capital relative to Labour, and hence equity prices should be anticipated to be higher under that outcome (hello, “observational equivalence”). The fact that the interest rate and expected inflation has no effective change is actually not consistent with any model wherein there are expected differences in macro policies.
I am still waiting to hear you admit you were in error regarding depth of the downturn in Canada vs. US during the Great Depression. As you recall, you stated unequivocally:
And this statement is wrong.
Professor Chinn,
If you were the chief economic advisor for Wisconsin, what would you advise the governor to do now other than your desire (I assume) to have him resign?
One thing Walker could do is reform the agency he created and runs: the Wisconsin Economic Development Corporation. Again the non-partisan Legislative Audit Bureau cited the WEDC, “WEDC did not consistently follow statutes or its policies when making grant, loan, and tax credit awards, and it did not comply with all statutory requirements related to program oversight.” You can find the report here: http://legis.wisconsin.gov/lab/
But who cares about a program that is supposed to create jobs when you have a $2.2 billion state budget shortfall?
Also the WI Republican legislature’s attempt to redo FoodShares program is a terrible idea. Making dietary choices for individuals on an ideological basis doesn’t make sense. Why is buying shellfish (i.e., lobster) a not idea? Of course, all dairy products (including custard, ice cream, frozen novelties) are exempted from the restrictions. http://rhrealitycheck.org/article/2015/05/04/wisconsin-gop-restrict-food-stamp-recipients-choices/
Let’s do something productive for the state, invest in education, take care of the older adults, build some infrastructure.
I take it you never considered the high R^2 is a function of overfitting the sample period and your model just sucks out of sample? Convenient that your sample period for estimating the regression includes all periods prior to 2011.
Jay: Yes, I always consider that, but that’s why I tried a parsimonious specification (it’s bivariate) and has a first difference dependent variable. Since the data is available are available at the Philadelphia Fed, you can check yourself. I just shifted the sample back to 1990-2009, and forecasted out of sample from 2010 onward. You will see a similar pattern; actual output rises relative to forecasted until about 2011M01, and then reverts, falling below actual 2011M09, and staying below.
I also tried deleting the second lags of first differences; this yields a bigger gap.
Busy season at work. I don’t have time to run side projects in. I was referring to the additional lag. You can usually get a high R^2 between any variables if you specify it as an AR(12) model, heck throw in an MA(12) for good measure.
Obviously this is a blog post but so often do people specify models and not bother to test out of sample. I see you have added additional color.
Jay: An ECM with two lags of first differences doesn’t seem extravagantly overparameterized to me. Previously I used an AIC (I think) to set the lag length at 3 (consistent with VAR in levels at 4).
By the way, in the past 8 posts using ECMs, 7 do out of sample forecasting…
Jay: By the way, I bet you wouldn’t be so confident about getting high R-squareds with an ARIMA on log exchange rates …
Operative word “usually”
I’m curious about the percentage of econbrowswer readers who truly understand the statistical method(s) described and have enough expertise to critique them. Are there other approaches that are at least as defensible as the one shown here that would produce different results?
I’m a big fan of lay folk employing the skills of people with expertise in applied statistical analysis, but absent the review of other unbiased experts, advanced statistical techniques can be used by motivated analysts to produce results in line with their priors.
tew: Well, these are incredibly well-known methods that over a decade ago, I taught my master’s students. There are very many people who understand how to do this analysis, and moreover the data is on-line, so people can replicate (reader AS for one has asked for code in the past).
Since I aim a good portion of the commentary at those who do know these techniques, I suspect there is a high percentage who understand.
Yes, it seems this blog’s readership has a much higher percentage of people with “expert knowledge”. It may not seem special to you (as you describe it as having been taught years ago to mere masters students), but I’d guess it’s a low single digits percentage of the general population and even a minority of those reading other econ blogs who understand it.
tew: Well, I think it’s a slightly higher proportion of those reading this blog; I intentionally do not shy away from econometrics. There are 18 posts mentioning “regression” in the current year alone (written by both me and Jim).
Personally, I think if you don’t know what a regression is and what a standard error is (and haven’t read a statistics text to remedy that deficiency), you shouldn’t be professing to have an informed opinion on macroeconomics.
I have a direct question for Menzie Chinn. It’s a really important one for readers to understand.
Do you sometimes perform analysis and upon finding that the results do not align with the narrative you’d like to tell decide not to publish it? In other words, is the analysis presented on this blog *filtered*?
If the answer is “yes”, then readers should understand the “meta” in what they’re reading. Though the statistical methods and analysis for each post may be sound and unbiased, the aggregate of the posts would be biased. It’s an interesting and urgent topic.
tew: Yes, for instance, on exchange rate determination, I don’t post on Econbrowser all the instances where I can’t outpredict a random walk, or don’t get statistically significant results. I just mention my paper with Cheung and Garcia Pascual. This paper by the way documents the finding we were not looking for — but I’ll take the citations (over 650 in Google Scholar, but more welcome, so please cite it!).
Thank you. It was the latter type of example I was referring to.
To not publish something where you’ve failed to achieve a result or in which you’ve simply demonstrated a commonly known result (e.g. “I can’t outpredict a random walk…”) does *not* result in a “filtered” output – the subset of published results contains the same information as the full set, but more efficiently.
However, if, say, one were to run the Wisconsin analysis and find outperformance or in-line performance vs. counterfactual would that result be published? Or would it either be unpublished or critically mentioned as an aside in favor of another method that showed underperformance?
This is the key question for all of us receiving knowledge, especially from sources with… a perspective.
[So, yes, I’m tossing some dirt into the ring, but let me reiterate my thanks for your replies and your well done and well communicated work.]
Michael Zoller, an economist at Moody’s Analytics – January 2013:
“Indiana has better types of manufacturing, a lot of medical devices. It’s more resistant to outsourcing. Wisconsin is more traditional — paper, heavy machinery. Paper is very cyclical, it’s easy to mechanize. Heavy manufacturing is the same way,” Zoller said.
Wisconsin is home to a lot of small- to mid-sized companies. Those are easier companies to acquire,” Zoller said. “Financial industries have shut down entirely and moved to Minnesota or Chicago or have been gobbled up by foreign companies.”
“At Moody’s, we see the growth drivers in the nation are in higher skilled industry — health care, professional services, finance. People migrate because of money and jobs. You have to create high quality jobs to create a better economy,” Zoller concluded.
Bret Mayborne, economic research director for the Metropolitan Milwaukee Association of Commerce – May 2013:
About 16 percent of Wisconsin’s employment is in manufacturing, double the national average.
The biggest problem for manufacturing jobs, Mayborne said, is that Wisconsin’s durable and nondurable goods base continues to erode, hit in the 2001 recession and hit harder in the latest and worst economic slump in recent memory. And the sector doesn’t look to recoup anywhere near all of those lost jobs.