Or, why I think Governor Brainard is right to say it’s too soon to tighten.
Tim Duy’s interpretation of the last FOMC statement as a dismissal of international concerns as laid out by Governor Lael Brainard is troubling.
The removal of international factors from the statement reminds me that we ignore the external conditions at our peril (see also Krugman’s take). Here’s a cautionary tale from my youth.
Thirty five years ago, I took my first course in intermediate macroeconomics. Professor James Duesenberry, a developer of an precursor to the model of habit formation in consumption theory [1] (the “habit theory”), was the instructor, and on the day after Ronald Reagan’s election, he took time out from the course to discuss the macroeconomic implications of the new president’s program of massive supply-side tax cuts and elevated defense spending on the US economy. He predicted – rightly – that purported unicorn-like (my words) supply side surges in tax revenue would not appear; he also predicted – rightly – that there would be massive crowding due to the collision of fiscal and monetary policy. Where he was wrong was where the crowding out would occur: it occurred in net exports, rather than in investment. I wonder if policymakers — particularly those schooled in thinking of America as a closed economy — are again about to under-estimate the openness of the US economy.
Here are some observations to keep in mind:
1. Trade is an increased share of GDP
During the mid 2000’s, net exports increased to record share of GDP – nearly 6%, dwarfing the international sibling of the “twin deficits” of the 1980’s experienced under Reagan. More importantly, the economy is more open: exports plus imports as a share of GDP is now around 30%, as compared to 25% between the previous two recessions, as shown in Figure 1.
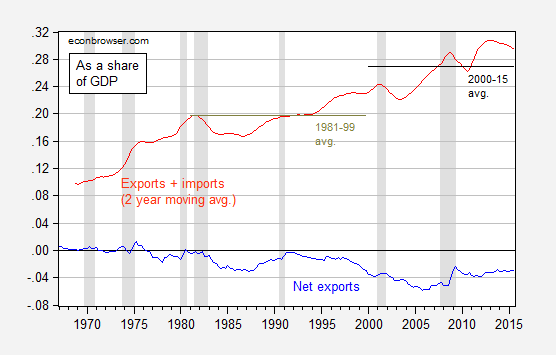
Figure 1: Nominal net exports to GDP ratio (blue), and nominal sum of exports and imports to GDP ratio, 8 quarter moving average (red). NBER defined recession dates shaded gray. Source: BEA, 2015Q3 advance release, NBER, and author’s calculations.
2. The relative importance of the contribution of net exports to growth has increased over time.
Using the decomposition of contributions to growth (in an accounting sense) as reported in Jim’s post on the GDP release, it can be shown that over time the absolute value of GDP growth (SAAR) has decreased, while the absolute value of net export contributions to growth has remained largedly unchanged.
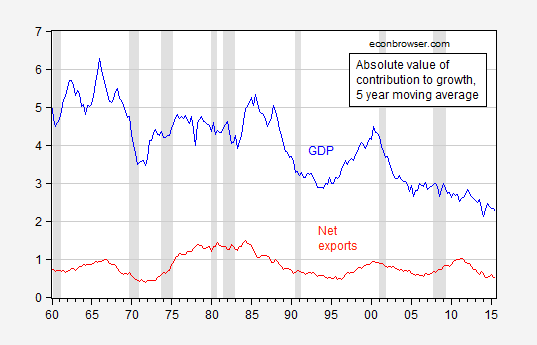
Figure 2: Five year moving average of absolute value of GDP growth (blue), and of net export contributions to growth (red), all SAAR, in ppts. Source: BEA via FRED, and author’s calculations.
3. The responsiveness of trade to exchange rates has risen
US exports and imports also appear to be more responsive to exchange rates than they were in previous periods. Hence, the observation that the recent appreciation has not reached heights recorded in the early 2000’s and in the mid-1980’s is not necessarily sufficient to dismiss worries. In this post (extended in Chinn (2010)) I report estimates that indicate that export price (exchange rate) elasticities are greater in the more recent period than in earlier; similarly IMF (2007) (Table 3.2) finds that price elasticities are higher over the 20 year period up to 2006 as compared to the entire 33 year period.
In this context, the 15% appreciation in the real value of the dollar, against a broad basket of currencies, shown in Figure 3, takes on greater significance than it might have in times past.
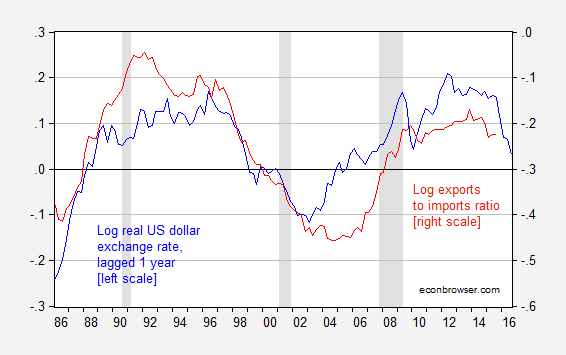
Figure 3: Log real dollar exchange rate against a broad basket of currencies, 1973M01=0, lagged one year (blue, left scale), and log real exports to imports ratio (red, right scale). Exchange rate defined so down is a dollar appreciation, so that the two series should exhibit positive correlation. NBER defined recession dates shaded gray. Source: Federal Reserve Board via FRED, BEA, NBER, and author’s calculations.
The impact of the rapid appreciation is yet to have shown up in exports and imports, if the past is any guide. Moreover, with the continuation of quantitative easing in the euro zone and the continued financial turmoil in China, there is little to suggest the dollar’s appreciated value will disappear anytime soon.
There is some indication of the dollar’s impact in indicators of tradables — approximated by manufacturing — activity.

Figure 4: Log real dollar exchange rate against a broad basket of currencies, lagged one year (blue, left scale), and log manufacturing employment, s.a. (red, right scale), and log manufacturing output, s.a. (green, right scale), all series normalized to 2012M01=0. Exchange rate defined so down is a dollar appreciation, so that the three series should exhibit positive correlation. NBER defined recession dates shaded gray. Source: Federal Reserve Board via FRED, BLS, NBER, and author’s calculations.
With the US economy already exhibiting weakness, and the global economy in flux [2], it hardly seems the right time to appreciate the dollar, which tightening would likely do.
OK, so put up the Case Shiller index and tell me there’s no bubble forming in housing.
https://research.stlouisfed.org/fred2/release?rid=199
I don’t see a housing bubble – by your own link, the Shiller index is now where it was in 2005, and flattening out. How is that indicative of a bubble? Same price as a decade ago!
Some markets may be frothy, but no, I don’t think there is a second housing bubble. General inflation has been low, but steady in the 10 years since the last bubble peaked, so you have to adjust nominal prices to real prices. Also, the most important indicator of bubble is rent to price ratio, which in real terms has being moving side ways in recent months. Building is still barely reaching levels that were bottoms for past cycles, when U.S. population was smaller. http://www.calculatedriskblog.com/2015/10/real-prices-and-price-to-rent-ratio-in.html
The reasons new rental and for purchase units are not appearing in the coastal cities where there is the most economic growth is a combination of right and left wing NIMBYism and local zoning rules, which restrict new development, particularly of multi-story housing and density. This increases the value of existing housing stock, increasing the incentive to restrict supply to build up value. http://www.npr.org/sections/codeswitch/2014/01/06/260282186/eight-reasons-why-the-rent-is-too-damn-high
Generally, I hate both sides arguments, but where local politics control housing, it is unfortunately true. The Left wing almost reflexively promotes rent control and is anti-developer, while the right wing promotes zoning rules that require huge amounts of parking for cars, single family housing, and no mix use. Also, they are often pretty anti-developer in built up areas where more housing could could put downward pressure on the price of existing housing stock. In the ex-urbs, its develop away, but with no increase taxes for the roads or for the schools that will be needed by those new people replacing corn stalks and trees.
@Steven: “OK, so put up the Case Shiller index and tell me there’s no bubble forming in housing.”
https://research.stlouisfed.org/fred2/graph/fredgraph.png?g=2o0c
https://research.stlouisfed.org/fred2/graph/fredgraph.png?g=2o0F
https://research.stlouisfed.org/fred2/graph/fredgraph.png?g=2o0h
https://research.stlouisfed.org/fred2/graph/fredgraph.png?g=2o0z
A bubble as large as the one in 2004-07 began inflating in 2012-13 and has actually begun to deflate.
https://research.stlouisfed.org/fred2/graph/fredgraph.png?g=2mM4
The broader equity market is in a bear market.
https://research.stlouisfed.org/fred2/graph/fredgraph.png?g=2o0U
https://research.stlouisfed.org/fred2/graph/fredgraph.png?g=2o0Y
Household net worth is contracting YoY.
https://research.stlouisfed.org/fred2/graph/fredgraph.png?g=2mPb
Not coincidentally, the foregoing are occurring with a recession-like collapse in the acceleration of money velocity.
https://research.stlouisfed.org/fred2/graph/fredgraph.png?g=2n0D
https://research.stlouisfed.org/fred2/graph/fredgraph.png?g=2f9t
The Fed is going to raise rates with contracting acceleration of money velocity, a deflating housing bubble, an incipient equity bear market, contracting household net worth, a strong US$, and a recession in the energy, energy-related transport, and industrial sectors?
It’s too late to raise the funds rate, which was highly unlikely to have occurred in any case given the precedent of the Schumpeterian depression, secular stagnation, and liquidity trap of the debt-deflationary Long Wave Trough (1830s-40s, 1890s, 1930s-40s, and Japan since the late 1990s to early 2000s).
Thus, the Fed is much more likely to resume QEternity in 2016, including the potential for NIRP at some point.
https://research.stlouisfed.org/fred2/graph/fredgraph.png?g=2o1z
As for the US$, the sum of net exports and the deficit by definition suggested as long ago as 2013 that the trade-weighted US$ would strengthen.
Moreover, US FDI to China-Asia ceased growing and began contracting after 2013 coincident with growth of China’s investment, production, and exports decelerating to contraction today and global trade decelerating to ~0%.
Given that flows of capital, investment, and trade have largely reached parity between the three major global trading blocs with trade no longer growing, it follows that the major fiat currencies will trend around par with one another hereafter, whereas so-called “currency wars” or “beggar-thy-neighbor” policies will have little net effect on domestic economic activity and exports, apart from short-lived, one-off effects that will result in hardly more than a balance of payments accounting reconciliation, if you will.
Your first four graphs say bubble to me.
Is it a full blown bubble yet? No. But half-blown? Sure.
https://research.stlouisfed.org/fred2/graph/fredgraph.png?g=2o4q
https://research.stlouisfed.org/fred2/graph/fredgraph.png?g=2o4t
@Steven: “Is it a full blown bubble yet? No. But half-blown? Sure.”
I am persuaded that the housing echo bubble peaked in 2013 and is deflating ahead of another housing recession, only this time it will be high-end, buy-up housing that will be hit the hardest.
Consequently, anyone who mortgaged a house in the past 2-3 years with less than 20% down will be underwater for years to come, a situation that will likely require another Fed/gov’t bailout of the mortgage market.
One more perspective for Steven and all:
https://research.stlouisfed.org/fred2/graph/fredgraph.png?g=2o2O
https://research.stlouisfed.org/fred2/graph/fredgraph.png?g=2o34
No objective observer can refute the evidence at the link above that an equity market bubble larger than in 2000 and 2007 occurred and is now likely deflating. All bubbles burst, and the largest bubbles burst spectacularly with large-scale dislocations and long-lasting effects.
Despite the unprecedented equity bubble to GDP, real final sales per capita are barely above the level of 2007-08, and capital formation to GDP is 15% below the highs in 2000 and 2006.
So, now we have clear evidence of deflating bubbles for equities and housing with the Fed pegged at ZIRP and global and US economic activity decelerating with CPI at ~0%.
One would be rather naive to believe that Fed officials, Fed eCONomists, and the Fed’s owners, the TBTE banks, are unaware of the bubble metrics and the implications. That they know and persist in insisting that either there are no bubbles or that bubbles cannot be discerned in real time is clearly a deception. That is, they are lying.
That begs the question of why they are lying. One need not be a cynic to infer the answer . . .
Hey, I can still (barely) fog a mirror. Who wants to lend me a mil?
Anyone? Anyone? Bueller?
The stronger dollar coincided with lower commodity prices – priced in dollars – particularly oil prices.
Oil importing countries need fewer dollars to buy oil and the appreciation of the dollar compensated for the decline in oil prices, I.e. foreigners exchange their currencies for fewer dollars to buy oil priced in dollars or sell their goods to the U.S. for fewer dollars to buy oil at lower prices.
And, regarding the housing market, it’s a bubble only if it bursts.
However, housing starts and the homeownership rate don’t show a housing boom at all.
Most people live month-to-month. So, higher housing prices are needed for lower mortgage rates.
Homeowners should be thankful the Fed increased their equity.
Peak, it’s a price bubble, and it’s global. All bubbles burst. This is the largest bubble as a share of GDP in world history. The bursting of this bubble will be the bubble to end all bubbles because it will coincide with another equity bubble bursting with unprecedented debt to wages and GDP at 0% CPI, real final sales per captia since 2007 near 0%, and nominal GDP per capita trending below 2% since 2007.
All the Fed and TBTE banks can do at this point is print trillions of dollars more in reserves indefinitely to shore up banks’ balance sheets, fund deficits, and prop up equity index futures with increasing leverage (now 50-80:1 vs. 25-30:1 in 2005-08) via offshore shadow banks’ pass-through entities using HFT.
Gov’t deficit spending hereafter will have little or no multiplier effect, as the bulk of incremental deficit spending will be to make up the shortfall for SS, Medicare, Medicaid, and to fund food stamps, unemployment payments, SSDI, SSI, and the myriad working-class income support programs for subsistence.
When economic growth picks-up, higher interest rates may result in lower or slower asset prices.
What’s important is economic growth (of goods & services).
And, you don’t know it’s a bubble, unless it bursts. For example, it looked like the Colorado housing market was forming a bubble by the mid-2000s, but it didn’t burst.
“When economic growth picks-up,”
They’ve been saying that for 6 years. Hint: It’s not going to happen. 2% is the new normal. We are buried in debt and regulation, and people have limited incentive all across the labor pool be productive.
New from McBride. Looks even more bubbly.
http://www.calculatedriskblog.com/2015/11/corelogic-house-prices-up-64-year-over.html
Right, Steven, and aided no doubt by the growth of automatic-underwater mortgages:
http://www.businessinsider.com/financial-advisor-insights-october-30-2015-2015-10
http://mymortgageinsider.com/100-financing-home-loans-zero-down-mortgage/
http://money.cnn.com/2015/02/16/real_estate/low-down-payment-mortgages/
https://confoundedinterest.wordpress.com/2015/11/02/fannie-maes-instant-underwater-mortgage-homeready/
Another one, Steven and all, to imply the extent of the housing echo bubble.
People who can’t afford 20% downwith monthly payments no more than 25-30% of income cannot afford to be mortgage debtors, and the gov’t should not be enabling and subsidizing mortgages to people who can’t afford them, only to be required to bail out mortgage investors when millions of renters-turned-mortgage-debtors can’t afford their mortgage payments.
Zell and Shiller know it’s a bubble and that it’s deflating.
Menzie wrote:
“Thirty five years ago, I took my first course in intermediate macroeconomics. Professor James Duesenberry, a developer of an precursor to the model of habit formation in consumption theory (the “habit theory”), was the instructor, and on the day after Ronald Reagan’s election, he took time out from the course to discuss the macroeconomic implications of the new president’s program of massive supply-side tax cuts and elevated defense spending on the US economy. He predicted – rightly – that purported unicorn-like (my words) supply side surges in tax revenue would not appear[PROOF]; he also predicted – rightly – that there would be massive crowding due to the collision of fiscal and monetary policy [PROOF]. Where he was wrong was where the crowding out would occur: it occurred in net exports, rather than in investment [A CONCLUSION BASED ON BAD THEORY]. I wonder if policymakers — particularly those schooled in thinking of America as a closed economy — are again about to under-estimate the openness of the US economy.”
Menzie,
I can see that your economics has been confused for very a long time but it is surprising that with so much evidence proving your theories wrong over the past 35 years that you still hold to them so strongly. The Mundell supply-side changes created one of the most prosperous periods in US history. The height of the demand side theories, the 1970s and the 2000s have been disastrous. This is especially obvious when compared to the supply side periods of the 1920s and the 1980s.
But the interesting thing is that supply theory agrees significantly with your conclusion, “With the US economy already exhibiting weakness, and the global economy in flux, it hardly seems the right time to appreciate the dollar, which tightening would likely do.” Once again we see that the broken clock is right twice a day.
Supply theory would say let the value of the currency remain stable, something Yellen has significantly done since 2013 with great effect, remove the wedges to production, especially Sarbox and Dodd-Frank, releasing the economy to produce. Once that happens the money supply can be increased as necessary (as indicated by the price of gold) to support the increased production without inflation.
It is a little surprising though that with your analysis you are not joining Krugman to push for another round of QE and monetary expansion. Isn’t that the demand side solution to every economic problem?
Ricardo, supply- and demand-side conditions vary depending upon the position and progression of the Long Wave.
Supply-side effects dominate during the Long Wave Downwave reflationary regime when falling nominal interest rates and decelerating price inflation induce reflationary effects, as during the 1820s, 1870s-80s, 1920s, and 1980 to 2007. These periods historically were characterized by an increase of lending/debt to GDP, increasing returns to capital share, and falling labor share.
Demand-side effects dominate during inflationary LW Upwaves when interest rates rise with accelerating inflation and increasing labor share into a Long Wave Peak, which occurred in the 1790s-10s, 1840s-60s, 1900s-20, and 1960s-80.
We are currently in the late Long Wave Downwave, or specifically the Schumpeterian depression and debt-deflationary regime of the Long Wave Trough. Lower interest rates (ZIRP and NIRP) and increasing debt to GDP no longer results in reflationary growth as occurred during the debt cycle of the LW Downwave reflationary regime from the 1980s-2007.
We have avoided outright debt/asset, price, and nominal GDP deflation so far due to the hyper-interventionist acts of central banks and deficit spending, as well as the fact that gov’t, private health care and education, and financial services (low- or no-productivity sectors) make up over 50% equivalent of GDP and act as a massive “automatic stabilizer” (anchor). But in the process of the hyper-interventionist response, non-financial corporate debt to GDP is back to the level prior to the GFC and at the level of the US in 1928-30 and Japan in 1987-94. ZIRP and $3.8 trillion in bank reserves has resulted in an even larger debt/asset bubble than before the GFC.
Moreover, the further deep, recession-like contraction in the acceleration of money velocity, CPI at 0%, the energy, transport, and industrial sectors in recession, decelerating real GDP per capita to “stall speed”, a deflating housing bubble, and an incipient bear market in the broader equity market implies that the Long Wave’s debt-deflationary regime’s effects are again manifesting to test the central banks and gov’ts and thus likely prompt them to further expand reserves to run fiscal deficits to prevent contraction of nominal GDP hereafter.
Peak Boomer demographic drag effects imply that the Long Wave Trough’s debt-deflationary regime’s effects will persist well into next decade, including China’s demographics rolling over into the mid-2020s.
BC,
The Wave vs Demand and supply theories is somewhat a chicken and egg situation: which comes first? There is a trend in the Wave if you look at the past, but I am not sure that proves the Wave drives economies. It seems to be a measure of lost institutional memory. Supply theory policies create prosperity and then crackpots convince politicians that spending is the way to Nirvana and down comes the prosperity – hello Wave. My goal is to do it right all the time.
This is why I don’t buy into Menzie’s economic philosophy. The so called “counter-cyclical” types really only believe in two policy stances. Ultra-expansionary and very expansionary. Unemployment is under 6%, we’ve had years of uninterrupted growth, yet now is still not the time to raise the Fed rate by even .25 and of course sit would be INSANE to cut Federal spending.
If the economy can’t withstand 3% FF rates it isn’t a strong economy and we have fundamental problems.
Anonymous: “If the economy can’t withstand 3% FF rates it isn’t a strong economy and we have fundamental problems.”
No question about it. The fundamental/structural problems are many, including Peak Oil; population overshoot; resource depletion per capita; climate change; peak demographic drag effects; excessive private and public debt to wages and GDP; a record low for labor’s share of GDP; record high for profits to GDP, including financial profits to GDP rising from 1% in the 1970s-80s to 4-4.5% today; deindustrialization and financialization; regressive taxation of labor/production and favorable tax treatment for non-productive rentier speculation; obscene, Third World-like wealth and income concentration to the top 0.001-1% to 5-10%; and prohibitively costly for-profit dis-ease care services and medical insurance.
That’s the short list.
The Fed printing trillions of dollars in fiat digital debt-money to credit TBTE banks’ balance sheets to fund deficits and create financial bubbles is not a solution but a panicked response to the increasing evidence of systemic weakness and dysfunction and ongoing structural decline.
“The Fed printing trillions of dollars in fiat digital debt-money to credit TBTE banks’ balance sheets to fund deficits and create financial bubbles is not a solution but a panicked response to the increasing evidence of systemic weakness and dysfunction and ongoing structural decline.”
This is spot on.
Anonymous wrote:
“If the economy can’t withstand 3% FF rates it isn’t a strong economy and we have fundamental problems.
Yep, that is pretty much right.
But the biggest fear is not a 3% FF rate but a 3% Treasury rate.
why is 3% so important? low interest rates are not slowing the economy. the rates are low because of a slow economy. in essence, there is a lack of good opportunity to put capital to work. raising interest rates will not change that situation. one reason we have lack of opportunity, is most investment types are too focused on high profit margin opportunities. low profit margin opportunities typically imply you will actually have to work to make your investment positive. too much focus on passive investment opportunities. this is killing the rentier society-understood. but it simply means rentiers will have to work harder for less dollars. low rates exist because capital is not as valuable as it is in a high growth rate environment. given the low population growth rate, why would one expect rates to be similar to higher population growth rate environments?
baffeled,
This is the closest you have come to real economics and the truth in a long time. 3% or 4% or what ever is actually pretty meaningless, but the demand economists have the fear that if the FED raises rates the Treasury will have to raise their rates and the interest on the public debt will become one of the primary drivers of the budget overwhelming both spending on welfare and defense – left and right will no longer have viable political issues with both their oxes gored.
ricardo, the problem with your argument is that it is a hypothetical with no basis in reality. you worry about the hypothetical situation of a rise in rates. but the conditions of the past years, and probably foreseeable years, do not indicate we should have higher interest rates. these are the real conditions on the ground. you have a solution to a problem that does not exist. japan should be your poster child, but that example is counter to your claims. when you have a theory that says something should happen, and that something never manifests itself, you should re-examine your theory.
Under what conditions should the Fed tighten policy in your view?
while that is an interesting question, it is not really the appropriate question. the appropriate question is simple. are today’s condition such that the Fed should tighten policy? it is misleading to have somebody state explicitly what conditions in the future warrant the move. too many conditions, or possible arrangements of conditions, exist with various perturbations and outcomes, for future predictions to exist. this is why the fed really does not want to be tied to a specific metric. if something unaccounted for occurs in the future, they want the flexibility to address it.