Governor Walker blames the workers.
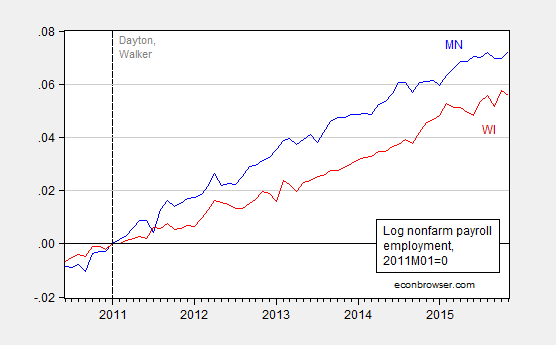
The BLS released state level data on Friday a week and a half ago. Here is a comparison of Minnesota (blue) against Wisconsin (red).
Figure 1: Log nonfarm payroll employment normalized to 2011M01=0 for Minnesota (blue) and Wisconsin (red). Source: BLS establishment survey, author’s calculations.
Since Governor Walker took office, Wisconsin nonfarm payroll employment has risen 6.9%, while Minnesota employment has risen 8.4% since Governor Dayton took office. Nationwide, employment has risen 10.8% since 2011M01. Note that, as shown in this post, Wisconsin employment growth has lagged what it should under a counterfactual implied by the historical correlation between US and Wisconsin employment. Hence, one cannot appeal to differences in trends as an explanation for Wisconsin’s lagging fortunes, since the cointegration methodology takes account of this issue (see this paper).
Here is Governor Walker’s explanation. From WPR:
Gov. Scott Walker says Wisconsin continues to rank relatively low in job creation because not enough people are ready to join the workforce.
New data from the U.S Labor Department shows Wisconsin ranked 37th among states in adding private jobs during the 12 months ending last June, with an employment increase of 1.5 percent. Wisconsin is 32nd over the last five years.
Walker said that more companies would add jobs if more workers were job-ready.
Note that these figures cited in the article are the Quarterly Census of Employment and Wages the Governor used to cite as the “gold standard” before he stopped touting them as the gold standard.
From the conclusion to a 2013 La Follette School study written for the Legislative Council:
Our analysis of the economic indicators does not provide evidence that a skills gap exists large enough to be detected by those indicators. Our projections suggest that a skills gap may exist in a few key areas of Wisconsin’s economy between now and 2020, most notably in occupations typically requiring formal education in computer science and information technology. However, we did not project an educational attainment-based skills gap in the Wisconsin economy in aggregate in the near future.
(As an aside, it seems less than optimal then to cut university level funding, as the Governor as proposed and the legislature has put into law [1] [2]).
As noted in Levine (2013), if there is a skills mismatch, one would expect to see wages to rise in order to equilibrate supply to demand.
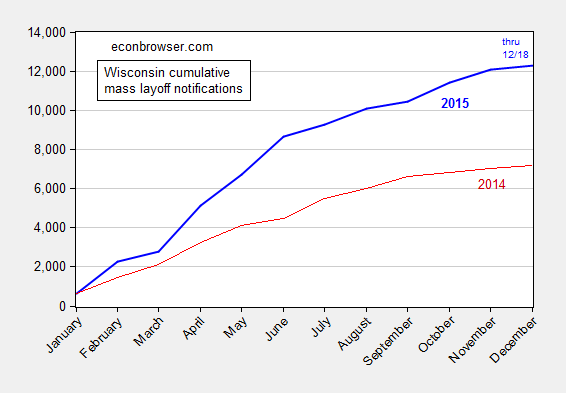
One additional puzzling aspect of the mismatch argument (at least in formal matching models) is that while it would seem to plausibly explain the slow pace of new jobs, it has little to say about less so about layoffs. And here, there’s some ‘splaining to do.
Figure 2: Wisconsin cumulative mass layoff notifications by end-month, for 2015 (bold blue) and 2014 (red). December 2015 observation is for data through 12/18. Source: DWD and author’s calculations.
As of December 18th, mass layoff notifications are 71% above total 2014 levels.
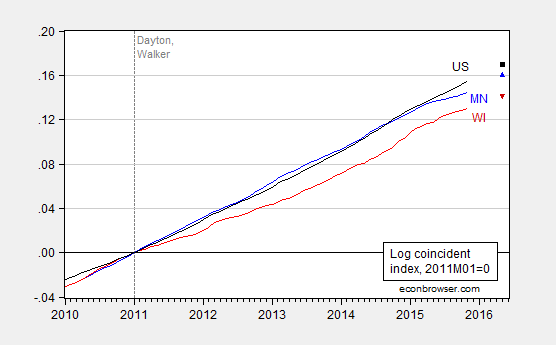
Finally, the newly released Philadelphia Fed coincident and leading indices suggest no succor in the near term for Wisconsin.
Figure 3: Log coincident indices for Minnesota (blue), Wisconsin (red), and US (black), all normalized to 2011M01=0; May 2016 observations are implied levels using leading indices. Source: Philadelphia Fed [3] [4] and author’s calculations.
Update, 2:30pm Pacific: Reader Steven Kopits writes:
If one checks the list of mass layoffs, about 1000-1300 of 9500 are plausibly associated with energy or commodities.
…
A lot of layoffs are coming from old line companies, ie, Oscar Mayer laying off hot dog makers in Madison. You want hot dog manufacture in Madison? You’re welcome to it.
Let me note the closure of the Oscar Mayer facility is not included in this tabulation; only the smaller cutback announced in August is (and to add insult to injury, the name is misspelled in the Excel spreadsheet).
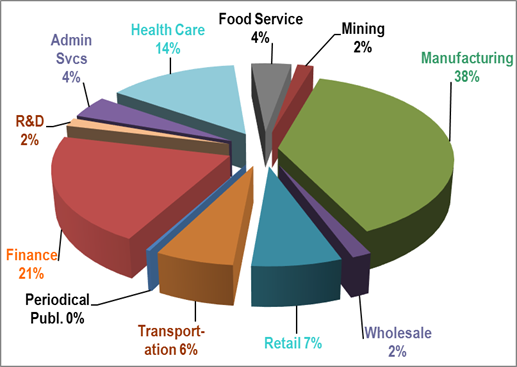
The point that the layoff are due to the energy downturn is plausible, although I can’t see it clearly in this pie chart from DWD:
Figure 4: Wisconsin cumulative mass layoff notifications by sector, for 2015 through 12/18. Source: DWD.
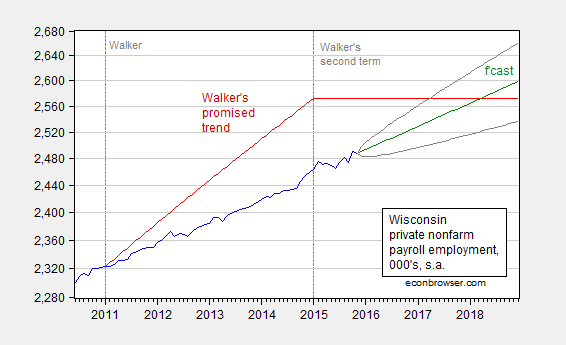
Reader Joseph reminds me of Governor Walker’s August 2013 promise to achieve a net gain of 250 thousand new private sector jobs by the end of his first term.
Figure 5: Wisconsin private nonfarm payroll employment (blue), and path promised by Walker in August 2013 (red), forecast from random walk with drift estimated over the 2011M01-2015M11 sample (green), and 90% band (gray). Left scale is logarithmic. Source: BLS, Milwaukee Journal Sentinel, author’s calculations.
My midpoint estimates suggest the 250 thousand goal will be achieved by March 2018 (just three years late), with a 90% forecast interval that includes as early as March 2017.
I think by job-ready he means willing to work for $7.25 per hour.
If one checks the list of mass layoffs, about 1000-1300 of 9500 are plausibly associated with energy or commodities.
A number of other closings are manufacturing related and probably influenced by the dollar exchange rate.
A lot of layoffs are coming from old line companies, ie, Oscar Mayer laying off hot dog makers in Madison. You want hot dog manufacture in Madison? You’re welcome to it.
Steven Kopits: The mass layoff statistics do not include the closure of the Oscar Mayer facility.
I have added a pie chart of the distribution of layoffs.
There as Oscar Mayer layoffs on the list.
Steven Kopits: Yes, but minor (and should have been a warning signal to the Administration). Not the thousands that are yet to come.
Kraft-Heinz is planning about 700 layoffs in Madison and another 250 transfers of staff to offices in Chicago. I believe something like 285 layoffs were listed on the Wisconsin mass layoff list. Most of the jobs lost will be union jobs.
This is part of the consolidation process associated with the merger of Kraft and Heinz and associated investment by Warren Buffet and Brazilian cost-cutting PE firm 3G. Six other locations will also be downsized or closed, including plants in Maryland, PA, CA (of course), NY (no surprise) and Canada.
The unemployment rate in Dane Country, where Madison is situated, is 2.7%, the lowest of the state’s counties.
I would personally consider the closure of a hot dog packaging facility to be progress for Madison. I cannot even imagine a discussion in Princeton regarding meat packing. This is a town which has banned fracking–even though we have no hydrocarbon resources! In Princeton, twinning a natural gas pipeline has proved traumatic, even though it would lower our energy costs.
In any event, I would take the closing as a sign of the gradual transformation of Madison towards education and services.
Steven Kopits: The correct number is 165. That’s why I said it was a minor number, compared to the cuts to come.
Menzie, what do you think is the current driver of US employment growth? A good place to look would be areas where costs are rising and have been rising for some time as generally our economy will have to devote more resources to it… a great example would be health care. Now think of an industry where costs have been falling and that has been in long term decline due to this fact… manufacturing. Which state, Minnesota or Wisconsin would benefit from these trends? Are these trends due to political changes or due to a combination of other factors? Would a historical counterfactual model be able to take into account these changes in where money is predominantly being spent… or would it hold these constant? Does our nation as a whole spend its money the same way now as we did in 1960? That seems implausible. The fact is that different groups of people specialize in different things, and they tend to be focused in very distinct regions, people are not randomly distributed. Is it possible some other overwhelming factor is causing these trends and Governor Walker’s policies have very little to do with it? I absolutely think so… however the problem with that line of thinking is it does not allow those working in academia to be our knights in shining armor, with special knowledge and policies that only they can provide to save us from ourselves.
Kirk: Recall, the ECM is estimated over the 20 year period prior to Governor Walker’s ascension — not back to 1960, just 1990. Hence, compositional changes would be to some extent in incorporated. Are you arguing that the shift in compositional effects relative to recent pas has been so great in the past five years as to invalidate the prior correlations?
I would welcome some data based informed guesses as opposed to wild, wandering, surmises. In particular, I welcome any statistically coherent interpretation.
In 1990 education and health services made up 10% of total employment. Today it makes up 16%. Conversely, in 1990 manufacturing made up 16% of total employment, today it makes up 9%.
Today, in Minnisota education and health services make up 18% of total employment, while manufacturing makes up 11%. Conversely in Wisconsin education and health services make up 15% of total employment, while manufacturing makes up 16%. Jobs in Wisconsin are more focused in sectors that historically have been industries growing slower than average.
Your co-integration analysis requires that these variables are stationary (time invariant), they clearly are not.
Kirk: Gee, and I would have thought what I needed was the individual variables were I(1) and cointegrated, and not exhibit a structural break over the sample period…In any case, your remarks demonstrate a lack of understanding of cointegration. The slower growth of Wisconsin is accounted for by the fact that the cointegrating vector has coefficients of about -1 0.6.
Now, further note my sample ends in 2010M12, so my question is how much of a structural change has occurred in the last five years so as to invalidate the analysis.
Really, I suggest you read Jim Hamilton’s Time Series Analysis before trying to bluff your way through an econometrics argument.
Menzie, you understand my point, no need to be rude. Basically what you are doing is saying the difference in the change in coincident indexes between the US and Wisconsin remains the same in the future. You are right, it has not as your analysis clearly shows. I’m saying that it could be due to other factors than scott walker being elected, such as the US shift away from manufacturing, which was something that was in fact accelerated during the recession. Additionally you comparing Minnisota to Wisconsin and thinking everything else is equal is not due to the focus of their economies.
It’s possible a structural change happened during the recession. In fact your blog partner Jim Hamilton just wrote a peice about that idea regarding long term unemployment. Run your analysis out to 2009 or 2010 and see if the forecast starts to diverge immediately as well. It is interesting that right at the end of your analysis (2011) it diverges immediately from the expected trend. When does the model start actually over predicting? We know that Wisconsin is under performing historically, but we don’t know why from your analysis and we don’t know when this started happening.
Kirk: I have done what you requested (you could have done it yourself, given all the data are available online).See here.
Kirk: “Is it possible some other overwhelming factor is causing these trends and Governor Walker’s policies have very little to do with it?”
Unfortunately, Governor Walker disagrees with your premise. Walker specifically campaigned on the fact that his tax-cut and austerity policies would create over 250,000 new jobs.
There is nothing wrong with a good hot dog manufacturer in my opinion and not to be scoffed at. But, I would note that the Madison OM location included numerous other jobs as well: marketing, commodity buyers, procurement, etc. Also, the Weinermobile operation was located there.
Dear Dr. Chinn,
I find your work tracking the nexus of legislative policies and performance very valuable. Thank you.
As an aside, I am very interested in how economics functions at the grass-roots community level. For example, trades between people such as: “I will give you a ride to work in my car if you mow my lawn.” I would like to find out more information about how communities can improve these types of transactions. For example, timebanks etc.
For a non-economist, are there any good books or other materials that you suggest I could read as an introduction to this subject?
Thanks!
Energy is a sub-sector of mining — 2% in the pie chart.
So 2% would be the maximum unless yoou make some heroic assumptions about employment in other mining industries.
Pretty soon people are going to wake up and Gov Walker is going to be flattened by Rolling Log coincident indices