According to the Energy Information Administration’s Monthly Energy Review database, world field production of crude oil in September was up 1.5 million barrels a day over the previous year. More than all of that came from a 440,000 b/d increase in the U.S., 550,000 b/d from Saudi Arabia, and 900,000 b/d from Iraq. If it had not been for the increased oil production from these three countries, world oil production would actually have been down almost 400,000 b/d over the last year.

Monthly U.S. field production of crude oil, thousands of barrels per day, Jan 1973 to Sept 2015. Data source: EIA Monthly Energy Review.
But the U.S. situation will be very different in 2016. The number of active U.S. oil rigs today is about a third of the levels reached in 2014. JODI’s separate database estimates that U.S. oil production was already down year-over-year by October 2015. And the EIA’s drilling productivity model estimates that production from the U.S. counties associated with the tight oil boom will have fallen another 500,000 b/d from the September values by the end of next month.
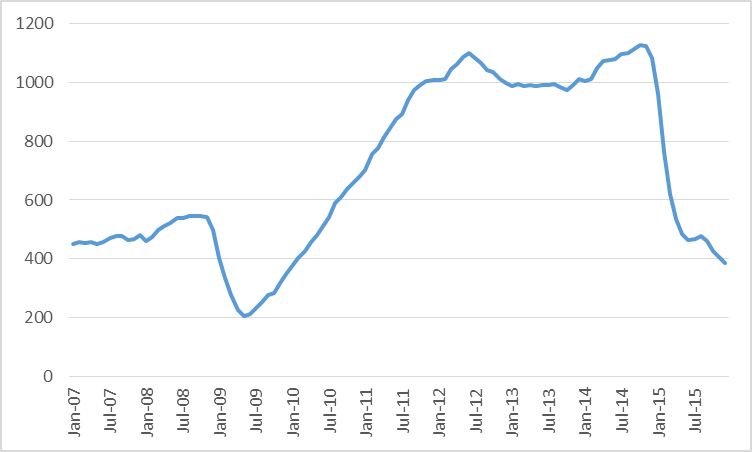
Number of active oil rigs in counties associated with the Permian, Eagle Ford, Bakken, and Niobrara plays, monthly Jan 2007 to Dec 2015. Data source: EIA Drilling Productivity Report.
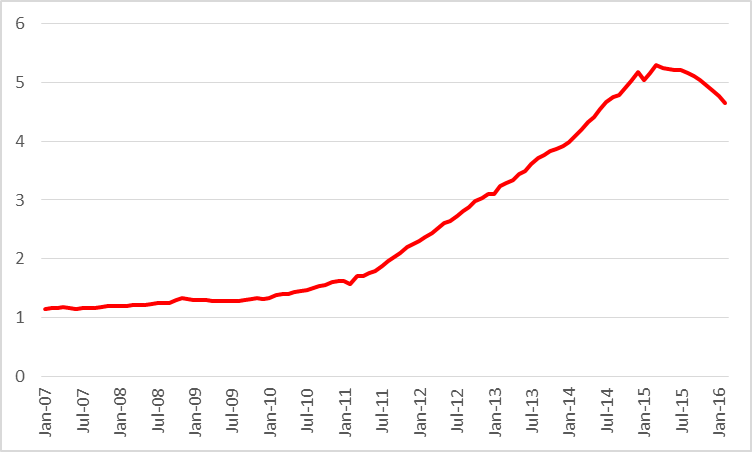
Actual or expected average daily production (in million barrels per day) from counties associated with the Permian, Eagle Ford, Bakken, and Niobrara plays, monthly Jan 2007 to Feb 2015. Data source: EIA Drilling Productivity Report.
Still, it is hard to see prices increasing until U.S. inventories begin to come down.
U.S. commercial crude oil inventories. Source: EIA.
The much-discussed increase from Saudi Arabia only puts the kingdom’s oil production back to where it had been in August 2013.

Monthly Saudi Arabian field production of crude oil, thousands of barrels per day, Jan 1973 to Sept 2015. Data source: EIA Monthly Energy Review.
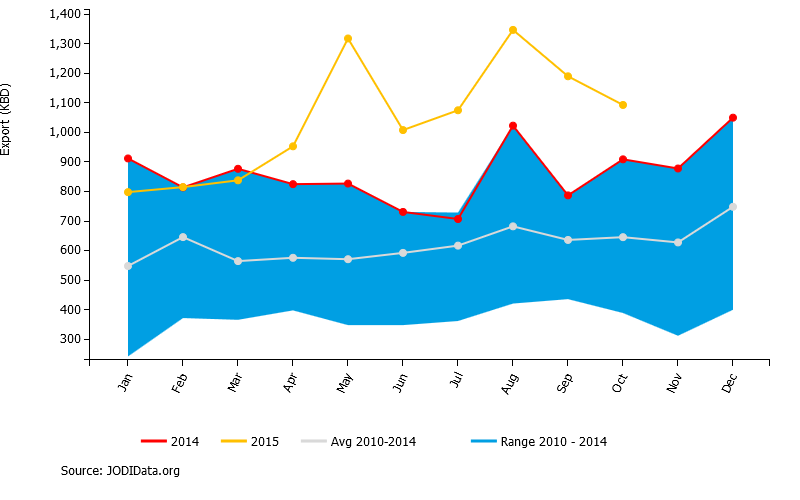
It’s worth noting that also leaves Saudi exports of crude oil significantly below their recent peak. One important factor in the increased Saudi crude production since last year was the need to supply its greatly expanded refinery capacity. As a result, Saudi Arabia is now exporting more refined products in place of crude oil.
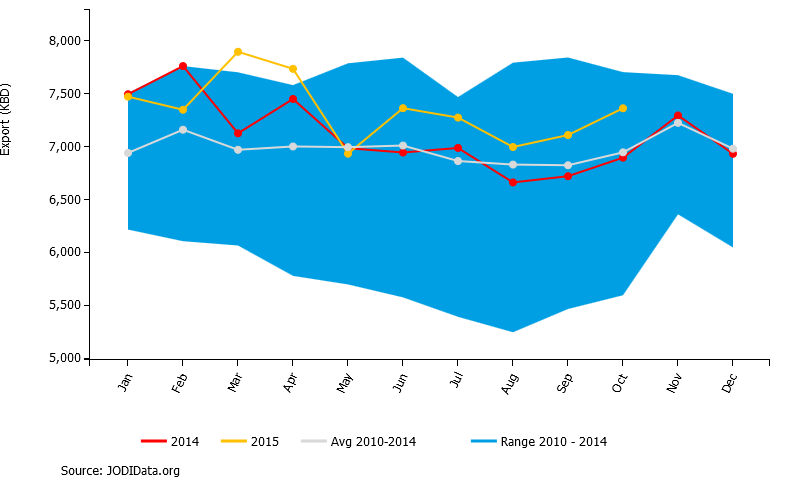
Saudi crude oil exports, thousand barrels per day, in 2015 (yellow), 2014 (red), and range over 2010-2014 (shaded). Source: JODI.
Saudi exports of refined petroleum products, thousand barrels per day, in 2015 (yellow), 2014 (red), and range over 2010-2014 (shaded). Source: JODI.
The big story up to this point has been Iraq. The country continues to log impressive increases in production despite ongoing turmoil in the region.

Monthly Iraq field production of crude oil, thousands of barrels per day, Jan 1973 to Sept 2015. Data source: EIA Monthly Energy Review.
And next up will be Iran, whose production has been depressed as a result of international sanctions that are now being lifted. Iran intends to increase oil exports by 500,000 b/d right away, in addition to the 30 million barrels Iran has stored in oil tankers in the Persian Gulf.

Monthly Iran field production of crude oil, thousands of barrels per day, Jan 1973 to Sept 2015. Data source: EIA Monthly Energy Review.
Even so, there’s clearly more than just new oil supplies from the Middle East influencing the market. Since I last updated these calculations in September, the dollar has appreciated 3% against our major trading partners, and the price of copper has fallen 16%. Based on a weekly historical regression of oil prices on these variables along with the 10-year Treasury yield, we would have predicted a 10% drop in the price of WTI from $46/barrel in $41.50 today on the basis of changes in the exchange rate, copper price, and interest rates since September, explaining about a third of the drop in oil prices since September from international factors that are not unique to oil markets.
Bob Barbera discussed the role of slowing world GDP growth as one of those factors. His graph below shows that the observed slowdown in world GDP since 2010 (shown in red in the graph below) could easily account for much of the drop in commodity prices through 2014 (in green). Barbera speculates on the basis of the numbers for Chinese rail shipments and electricity production that the true Chinese GDP growth for 2015 may have been significantly below the country’s official target of 7%. The dashed red line in the graph below is Barbera’s “what-if” calculation supposing we impute 2.5% real GDP growth to China instead of the 6.8% number that IMF is estimating that we will see in China’s official numbers for 2015, an exercise that could explain much of the drop in general commodity prices through last year.
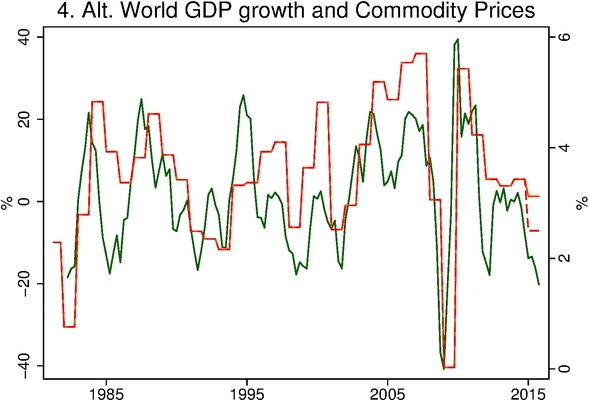
IMF estimates of annual growth rate of world real GDP (in red, right scale) and year-over-year percent change in commodity prices as measured by the quarterly average CRB/BLS raw industrials price index (in green, left scale). Dashed line is Barbera’s estimate of world GDP growth for 2015 if IMF 6.8% Chinese growth rate is replaced with 2.5%. Source: Center for Financial Economics.
The 44% drop in Chinese stock prices since last summer suggests that this kind of what-if calculation should be taken seriously.
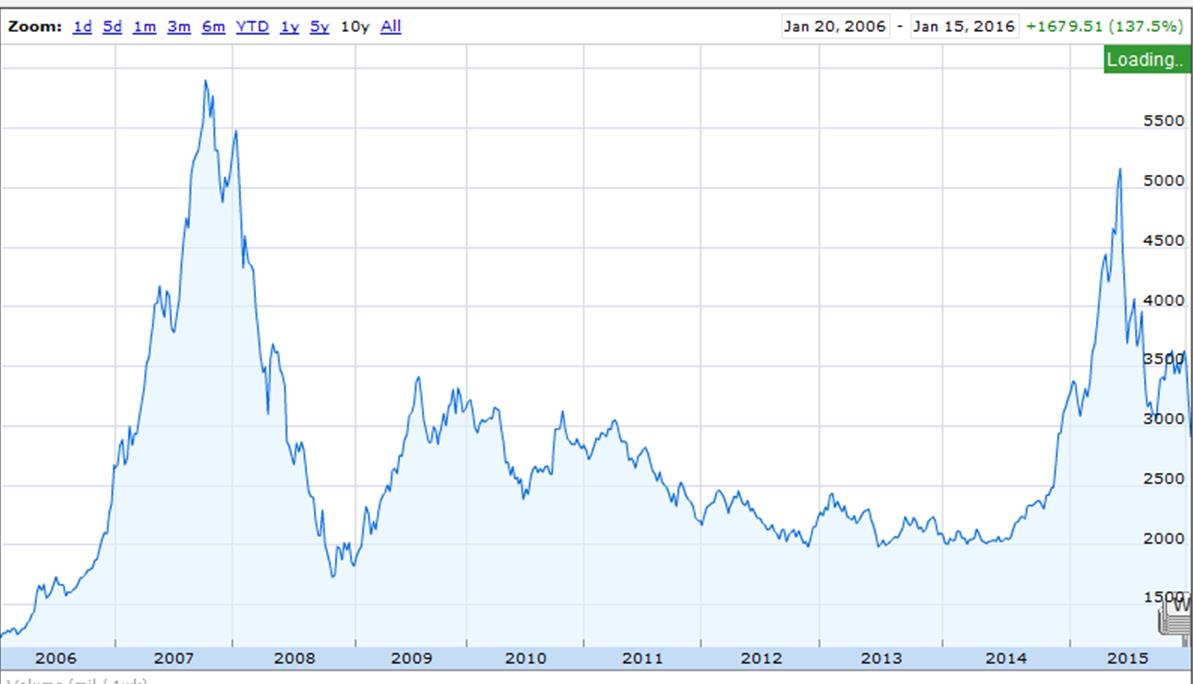
Shanghai Composite Stock Index. Source: Google Finance.
If Iranian production is about to surge, Iraqi production remains high, and the Chinese economy is stumbling, that can only mean that even bigger drops in U.S. oil production are inevitable.
“If Iranian production is about to surge, Iraqi production remains high, and the Chinese economy is stumbling, that can only mean that even bigger drops in U.S. oil production are inevitable.”
Sounds excellent. Why would the U.S. want to sell a dwindling resource if they didn’t have to?
The crazy thing is the recent budget deal. Instead of responsibly paying for spending with taxes, the Republicans forced a gimmick in which they finance spending by selling off part of the Strategic Oil Reserve. Buy high, sell low. That’s the Republican way.
How do you know what the price of oil will be when the U.S. sells 58 million barrels of oil from the Strategic Petroleum Reserve between 2018 and 2025?
Many U.S. oil companies may be bankrupt and there may be a real economic recovery by then.
if the future is so uncertain. what is the point in selling from the SPR to begin with?
The U.S. may have to sell a lot more assets.
why? a sovereign country is not a company. there is absolutely no need to “sell assets” to raise that kind of revenue. in addition, the idea of a SPR is to keep officials from needing to buy or sell an asset during crisis times. decisions during fire sale conditions are not good when made by elected officials. if you need revenue, you have elected officials raise taxes or cut expenditures. they would be even worse at valuing and selling assets.
And, trillions of dollars of additional federal debt in just a few years with hundreds of billions of dollars more each year show we haven’t been close “responsibly paying for spending with taxes.”
agreed. a couple of trillion dollars spent on two unpaid for wars was probably not the best use of taxpayer dollars or debt.
And we’re back to a discussion of incentives…
Since 2009, $5 trillion of additional federal debt for a depression was not the best use of taxpayer dollars.
Defense spending as a percent of GDP was low in the 2000s compared to every prior decade, since WWII, except for the “peace dividend” of the 1990s, after we won the Cold War.
Too little defense spending can cause other powers to emerge, e.g. Russia, China, Iran, ISIL, etc..
“Since 2009, $5 trillion of additional federal debt for a depression was not the best use of taxpayer dollars.”
If your gdp collapses due to the depression, which would have occurred without government support, do you think the country would be in better shape today? you may not like the current situation, but it needs to be compared to a realistic alternative scenario. there was not a realistic scenario where the government does not intervene and the economy continues to hold steady, much less prosper. without a backstop, the realistic scenario is an economy which contracts significantly. do you prefer a larger federal debt, or an economy which is 50% smaller?
Baffling, you give a false choice, while ignoring reality.
We need a much larger economy with much smaller federal debt.
no peak. apparently you believe the country would be better off today if we had not provided any support during probably the greatest financial crisis the country has seen. the support by the government actually was negative and held us back? foolish. as i stated, the point of view taken that the country would have responded better by lacking government support is not a reality. there is no false choice here.
“We need a much larger economy with much smaller federal debt.”
you would not have a much larger economy if the government had not supported the economy. you would have had a much smaller, collapsed economy. you may not like that choice, but it is the one you are stuck with. conditions did not allow for the outcome you describe and desire. i want the same, but not a reality. you cannot choose a fantasy.
Baffling, you’re just making things up.
Expansionary fiscal policy raises GDP, unless it’s offset with anti-growth policies.
Instead of your false choice, there can be larger GDP and smaller federal debt, certainly as a percent of GDP.
And, more defense spending is more government spending.
peak
“Expansionary fiscal policy raises GDP, unless it’s offset with anti-growth policies.”
first you need to educate yourself on what consists of anti-growth policies. during the financial crisis, your ideology seems to think these were the policies enacted. they were not. your claim regarding obamacare displays this clearly. you believe it is anti-growth, but it is not, and you cannot provide evidence to support your argument.
please tell me what you would have done differently in 2008-2013 that would have resulted in the lower deficits and higher gdp? and provide solutions that could have actually been implemented, politically, during that time frame. generic statements, such as simply reducing regulation, need to have some specifics in order to be valid. otherwise you are simply invoking the famous paul ryan asterisk on debt-simply a fiction of convenience.
Baffling, you’re just making things up. I explained before several times to you how a stronger expansion could’ve been achieved. You’re playing a political game.
peak, you simply speak in vagueness with unrealistic alternatives. you talk of anti-growth policies which do not exist. give me something concrete. don’t give me ideologies, give me specific policies which could actually be enacted.
Nothing unusually Republican about that. Government incompetence knows no party.
However, one could criticize Republicans for raiding the SPR rather than raising road taxes. The issue is more complicated than that, but that’s the general criticism.
Joe, yep. Only problem is the over investment because of monetary policy, Dodd-Frank, and post crisis aversion to mortgage lending.
There are good arguments for keeping our most easily extractable coal and oil in the ground as a medium-long term strategic reserve, but ideally what we would do is install infrastructure with a large operating range and operate at the low end except for under specific conditions and performance/maintenance checks.
“The crazy thing is the recent budget deal. Instead of responsibly paying for spending with taxes, the Republicans forced a gimmick in which they finance spending by selling off part of the Strategic Oil Reserve. Buy high, sell low. That’s the Republican way.”
No, eventually cheap electricity and storage and other alternative fuels will drive the price down. We should be producing now while prices are still high.
Copy of a previous comment, that is relevant to this topic, follows. Note that what the EIA calls “Crude oil” is actually Crude + Condensate (C+C). Also, note that US C+C production fell from 9.6 million bpd in April, 2015 to 9.2 million bpd in December, 2015.
When we ask for the price of oil, we get the price of actual crude oil. In the case of Brent and WTI, they both have average API gravities in the high 30’s, and the upper limit for WTI crude oil is 42 API Gravity.
But when we ask for the quantity of oil, we get some combination of crude oil + condensate + natural gas liquids (NGL) + biofuels + refinery gains.
The Great Condensate Con?
We have seen a large year over year increase in US and global Crude + Condensate (C+C) inventories. For example, EIA data show that US C+C inventories increased by 100 million barrels from late 2014 to late 2015, and this inventory build has contributed significantly to the sharp decline in oil prices.
The question is, what percentage of the increase in US and global C+C inventories consists of condensate?
Four week running average data showed the US net crude oil imports for the last four weeks of December increased from 6.9 million bpd in 2014 to 7.3 million bpd in 2015. Why would US refiners continue to import large–and increasing–volumes of actual crude oil, if they didn’t have to, even as we saw a huge build in US C+C inventories? Note that what the EIA calls “Crude oil” is actually C+C.
I frequently cite a Reuters article that discussed case histories of refiners increasingly rejecting blends of heavy crude and condensate that technically meet the upper limit for WTI crude (42 API gravity), but that are deficient in distillates. Of course, what the refiners are rejecting is the condensate component, i.e., they are in effect saying that “We don’t want any more stinkin’ condensate.” Following is an excerpt from the article:
U.S. refiners turn to tanker trucks to avoid ‘dumbbell’ crudes (March, 2015)
http://www.reuters.com/article/2015/03/23/us-usa-refiners-trucks-analysis-idUSKBN0MJ09520150323
My premise is that US (and perhaps global) refiners hit, late in 2014, the upper limit of the volume of condensate that they could process, if they wanted to maintain their distillate and heavier output–resulting in a build in condensate inventories, reflected as a year over year build of 100 million barrels in US C+C inventories.
Therefore, in my opinion the US and (and perhaps globally) C+C inventory data are fundamentally flawed, when it comes to actual crude oil inventory data. The most common dividing line between actual crude oil and condensate is 45 API gravity, although the distillate yield drops off considerably just going from 39 API to 42 API gravity crude, and the upper limit for WTI crude oil is 42 API.
In 2015, the EIA issued a report on US C+C production (what they call “Crude oil”), classifying the C+C by API gravity, and the data are very interesting:
https://www.eia.gov/todayinenergy/detail.cfm?id=23952
Note that 22% of US Lower 48 C+C production consists of condensate (45+ API gravity) and note that about 40% of US Lower 48 C+C production exceeds the maximum API gravity for WTI crude oil (42 API). The above chart goes a long way toward explaining why US net crude oil imports increased from late 2014 to 2015, even as US C+ C inventories increased by 100 million barrels, and I suspect that what is true for the US may also be true for the world, in regard to the composition of global C+C inventories.
Following is my analysis of global C+C production data versus estimated global crude oil production data, through 2014, using the available data bases:
Did Global Crude Oil Production Peak in 2005?
http://peakoilbarrel.com/worldwide-rig-count-dropping-again/comment-page-1/#comment-546170
How Quickly Can US Tight/Shale Operators Cause US C+C Production to Increase?
Because of equipment, personnel and financial constraints, in my opinion it is going to take much longer than most analysts expect for US operators to ramp up activity, even given a rising price environment.
Except for the 2008 “V” shaped price decline (which bottomed out in December, 2008), and the corresponding US rig count decline, the US (oil and gas) rig count has been around 1,800 to 2,000 in recent years. Note that it took about five years to go from around 1,000 rigs in 2003 to around 2,000 rigs in 2008, and it even took two years to go from around 1,000 rigs in 2009 to around 2,000 rigs in 2011.
And assuming a 15%/year rate of decline in existing US C+C production and assuming a 24%/year rate of decline in existing US gas production, the US has to put on line around 1.5 million bpd of new C+C production every year and around 17 BCF per day of new gas production every year, just to offset declines from existing wells. Based on 2013 EIA data, the estimated annual volumetric loss of production from existing US gas production exceeds the annual dry gas production of every country in the world, except for the US and Russia.
Iranian sources claim that their floating storage consists of fuel oil and condensate, but I guess we will find out:
http://www.reuters.com/article/iran-oil-idUSL3N1021Z120150723
I really wish we could push for a change in attitude. Not, when oil prices drop, we just go out and buy ginormous trucks, and stifle mileage standards. It’s like when your team gets a lead in a basketball game and you say, ok, now we can coast and stop trying. Why not be the team that says when we get a lead we go for the win! Now we pour it on to seal it, and not let them back in. Why not say, now we really raise mileage and efficiency standards so we crush oil prices once and for all, so they don’t come back, so we drive them to $10/barrel and keep it there!
Let’s go for the win now, permanently, so that we don’t have to keep sending all this money to some of the worst terrorist sponsoring and authoritarian regimes in the world.
I hope we can start having that attitude.
An item on monthly total vehicle sales in China:
http://www.tradingeconomics.com/china/total-vehicle-sales
And an interesting article on Chinese oil imports:
http://www.bloomberg.com/news/articles/2016-01-13/china-imports-record-crude-oil-as-price-crash-accelerates-buying
That’s right, Jeffrey. So we can see the domestic v export split. The domestic market–auto sales and crude imports–seems to be (or recently have been) doing fine. It’s exports that have suffered–again strongly suggesting a currency over-valuation. That’s entirely consistent with Jim’s ICE model.
So China needs to devalue the yuan. But it’s hard to overstate what a hash the PBoC has made of it. Right now, the China brand is going straight to hell, and leadership seems entirely baffled as to what to do about it.
alright M8
“If Iranian production is about to surge, Iraqi production remains high, and the Chinese economy is stumbling, that can only mean that even bigger drops in U.S. oil production are inevitable.”
Why don’t you formulate it that way : ““Iranian production will surge for sure, Iraqi production may be still high, given promising results in the fight against the IS, and the Chinese bubble is imploding, that can only mean that we will see 20 USD per barrel soon- though I, James Hamilton, thought I will never see oil below 100 USD per barrel in my life time again.” And yes, fracking is dead, just ask Steven K.
But you are right, the oil is out there in the tankers, just waiting, to rig the price at the futures market.
Some of those tankers have already gone. And a lot of the rest is sour junk. I think there’s less than meets the eye there.
Well, fracking is not quite dead enough.
For example, in the Bakken, we had 46 horizontal rigs as of last week, good for 60-ish new wells per month. We also have something like 680 excess drilled but uncompleted wells (‘DUCs’).
To hold production absolutely flat in the Bakken, about 100 new wells have to be brought on line every month. Thus, we could hold production flat for 17 months in the Bakken with the current rig count and the conversion of existing excess DUCs.
But that’s not realistic. More realistically, rigs could fall to 40 and we could convert a few DUCs per month to bring us to 60 new wells per month. This would let off about 175 kbpd over the course of the year. Something like that could happen.
However, the EIA pegs the current supply surplus at 1.5 mbpd, and OPEC wants the US to essentially carrying the entire brunt of adjustment. Now, oil consumption growth is also forecast by the EIA at 1.5 mbpd, so we sort of balance by year end. But, we have to throw another 500 kbpd or so in from Iran. So the US really does have to adjust, and 40 Bakken rigs sort of barely gets us there (assuming the Permian, Eagle Ford and other onshore US also take a pro rata share).
Now, of the 1.5 mbpd consumption growth, China and China-derived demand is maybe half. So if the US is going to take the whole adjustment on the supply side, then US production has to fall 1.25 million barrels per day. And then 40 Bakken rigs is way, way too many.
And if you understand that, then you understand why oil falls $10 every time the Chinese talk about devaluation. With the elimination of the flash PMIs, investors are using the exchange rate as a de facto PMI. (Oh, yes sir, they can do that.) In the mind of investors, devaluation = Chinese recession = unresolved overhang = unrelenting pressure to reduce US oil production.
So, to John’s point, fracking is not dead enough yet. Certainly not if China does gown the drain, and I have to tell you, I haven’t seen a management team tank like China’s has since my days on Wall Street.
https://app.box.com/s/vvt8ywyh6w3xxtgvv39myfny2jhgnu0e
https://app.box.com/s/xywlbqm8wswzhfmxh0paiil9cysh8cmk
https://app.box.com/s/h0p6s4ye96k6cx7smn0r2te0giganyy1
https://app.box.com/s/xcult10g1qfq3qi9wobow4j4l6j0pu0o
For the US and world economy with the post-2007 (and post-Peak Oil) average for real GDP per capita near 0% and the differential change rates for US oil consumption to final sales and final sales, oil at $30 is still not “cheap”, i.e., the US and world economy has been experiencing comparative post-Peak Oil recessionary conditions since 2007-08.
Because of the permanent global structural constraints resulting from Peak Oil, we cannot afford to extract profitable increasing marginal supply of costlier, lower-quality crude oil substitutes AND maintain the existing fossil fuel infrastructure AND grow real GDP per capita at a post-Peak Oil rate of faster than 0%. This implies that neither can we sustain growth of expansion of renewables without the necessary growth of real GDP per capita AND growth of crude substitutes to sustain current growth of real GDP per capita AND growth of renewables.
Something has to give, which will be growth of real GDP per capita and growth of renewables in order to sustain the existing fossil fuel infrastructure at declining oil production AND overall consumption.
Am I the only one who thought the release of the Iranian hostages was a huge coup for the Obama administration?
The issue to me is not whether it was the best deal, but rather that the US and Iran demonstrated an ability to reach some sort of agreement and more or less abide by it. The US sailors could easily have ended up as pawns in yet another deal, but they didn’t. And Obama got the detainees back, even though it wasn’t part of the nuclear deal.
To me, it’s not that the pig dances poorly, but that it can dance at all.
I agree with you, but I think it only occurred because of the context not which we were declaring the nuke deal a go.
Steven Kopits,
I don’t think anyone ever wins when a ransom is paid for a kidnapping victim.
Or, Steven, it was brilliant realpolitik tactics by the Iranians ahead of a selection year for CEO of the Anglo-American imperial corporate-state, permitting the Iranians to challenge the Saudis for some market share, secure much-needed revenues, and appear more like a cooperative state in order to mitigate the effects of Israel’s contentious rhetoric.
it was probably a sign that sanctions do actually work. the iranians evaluated the cost of a few detainees versus the cost of another round of sanctions. they do not want additional economic sanctions. they especially are not willing to continue to tank their economy to prove a point with a few detainees. cost-benefit does matter.
Cost / benefit calculations for the Iranians? Now that’s real progress!
Don’t be rude and sour to the Iranians, keep in mind that modern algebra was “born” in Persia (say Iran).
https://en.wikipedia.org/wiki/Muhammad_ibn_Musa_al-Khwarizmi
“But for now, the administration deserves some real credit for achieving at least some limited goals. An Iran thaw and the re-establishing of relations with Cuba may possibly come to be the lasting achievements of the Obama administration. If they do, they are significant achievements, indeed.”
I agree with this statement.
I was referring to the Iranians’ ability to transact.
A transaction means an agreement to perform some service, which is then performed and some counter-value received. We would call that a business-like relationship. It does not have to involve love, affection, empathy or anything like that. But it does involve discuss, negotiate, agree, perform, verify, and receive compensation. The Iranian government has been abjectly unable to interact on this basis with the US government since the fall of the Shah. Until now.
So, let’s see if the Iranians can hold it together, but we have now taken a couple of steps together, and maybe we can take a few more.
interesting, from what i understand the political leaders of iran were rather helpful in expediting the sailor and prisoner exchanges recently, in order to preserve the recent deals lifting sanctions. it has been reported (not sure how accurate) the release of the sailor video and delays in prisoner families was facilitated by the republican guard, who do not seem to support the nuke-sanctions agreement. probably because it is not in their (vast) economic and power interest. could be a schism forming internally in iran.
I acknowledge all the caveats, for example, the Iranians not wanting to repeat the whole Reagan thing and being more accommodating as a result. All conceded.
Nevertheless, we’ve seen some real progress. Will it be sustained? Who knows?
But for now, the administration deserves some real credit for achieving at least some limited goals. An Iran thaw and the re-establishing of relations with Cuba may possibly come to be the lasting achievements of the Obama administration. If they do, they are significant achievements, indeed.
Ever consumer loves a price war and that is exactly the situation now. Many think the purpose of a price war is to beat a competitor into submission, but in this case it is unlikely that any one competitor will be a victor. The history of oil prices (http://www.macrotrends.net/1369/crude-oil-price-history-chart) seems to indicate that in “normal” times a price of $40-50 per barrel is to be expected. Given the technology exists to expand supply (despite Jeffery’s pessimism) in response to price opportunities, we would expect $100/barrel prices only if there was a major global event disrupting supply. With the EPA demanding … mandating … that the automotive fleet of new cars average … average … nearly 55 mpg by 2025, we should see continuing pressure against demand. Sure, petroleum is used for many other products, but the USEIA indicates “Petroleum products include transportation fuels, fuel oils for heating and electricity generation, asphalt and road oil, and the feedstocks used to make chemicals, plastics, and synthetic materials found in nearly everything we use today. About 76% of the 6.97 billion barrels of petroleum products that were consumed in the United States in 2014 were gasoline (47% of total petroleum consumption; includes biofuels), heating oil and diesel fuel (21%), and jet fuel (8%).”
So, if nearly 50% of our demand is mandated to be reduced by 50% per vehicle, we can expect a downward demand curve, not only in the US, but around the world wherever vehicle usage is high.
you are in line with what Richard stated above. now is the time to push for electric/alternative models going forward. continue to depress the demand for oil/fossil fuels and move away from any dependence on the middle east for oil. this will be much cheaper than continuing to protect oil assets with wars overseas. mandating higher gas mileage is an ideal way to push this need ahead.
Agree that higher mileage vehicles will control demand for oil. The only issue is whether consumers will be willing to pay $30-40K (adjusted for inflation) for a basic vehicle. The goal should be reducing oil demand, but doubling mpg in less than 10 years is going to take a lot of arm twisting unless DARPA can come up with some miracles.
Just buying cars like the Prius would have an enormous impact, and they cost no more than a regular old Camry, or less, and are about as big, or bigger, depending on the model. The tech is already here, we just need to raise the standards. Otherwise, positional externalities, the pink elephant of economics, make people want to but the Camry primarily because more horsepower means more prestige and perceived quality, and that’s the bar of most people’s peer or reference group. But it wouldn’t be if the standards were raised, so your peers were typically buying hybrids too.
New car VMT is falling.
Here’s a short piece from me on new car miles per gallon.
http://www.prienga.com/blog/2016/1/18/us-new-car-mpg-january-2016
I noticed my commutes seemed to be getting longer in 2005. I looked at gasoline consumption and VMT and there was a downward trend in VMT/gasoline from late 2004 to the start of the recession. It disappeared when VMT was revised in 2010.
I agree that global natural gas, natural gas liquids (NGL) and condensate production have increased substantially since 2005, but what about actual global crude oil production (45 API and lower crude oil)?
A Tale of Two Oil Price Doublings
Annual Brent crude oil prices approximately doubled from $25 in 2002 to $55 in 2005. Annual Brent crude oil prices doubled again, from $55 in 2005 to an average of $110 for 2011 to 2013 inclusive, and Brent remained at $99 in 2014.
From 2002 to 2005, Global Dry Gas Production increased at 2.5%/year, Global Natural Gas Liquids (NGL) Production increased at 5.0%/year, and Global Crude + Condensate (C+C) increased at 3.3%/year.
From 2005 to 2014, Global Dry Gas Production increased at 2.5%/year, Global NGL Production increased at 2.7%/year, but Global C+C Production increased at only 0.6%/year.
Condensate, like NGL, is a byproduct of natural gas production.
OPEC + US C+C production in 2014 was 41 million bpd, which was about 53% of total Global C+C Production in 2014. Combining EIA estimates of US C+C production by API gravity with EIA and OPEC data for production from the OPEC countries (EIA C+C data, crude only for OPEC), suggests that US + OPEC condensate production probably increased at about 10%/year from 2005 to 2014.
If this estimate is approximately correct, and if the US and OPEC combined are generally representative of the rest of the world, it implies that as annual Brent crude oil prices doubled from 2005 to the 2011 to 2013 time frame (remaining at $99 in 2014), and as global oil and gas companies spent trillions of dollars on upstream capex (on both oil and gas projects), we have seen little or no increase in actual global crude oil production (45 API gravity crude oil). Therefore, what happens to actual global crude oil production given the large and ongoing cutbacks in global upstream capex?
Sorry, that’s new car mpg is falling.
Anyone interested in wading through some presentations of the 2015 Energy Research Council (University of Wisconsin-Madison) Symposium can download the zip file https://www.erc.wisc.edu/documents/symp15/erc-symp15.zip
Naturally, the focus is on technology. One aspect that got scant attention is connectivity. Most of the focus their is information flowing to the vehicle, but there is a significant opportunity for future connectivity from the vehicle. The most neglected aspect of reducing fuel consumption is not part of the vehicle, but the network of roads upon which the vehicle travels. Technology has made up for the shortcomings of that network, but the wall that all technologies face is dealing with fuel used to accelerate to cruising speed. The more often this happens, the less efficient the network.
Traffic flow management remains the last bastion of the 20th century.
Thanks a lot for this zip file, very interesting and competent content.
“Traffic flow management remains the last bastion of the 20th century.”
20th is past already, you mean 21st century of course …
Thanks!
I’m a very small investor. I have made and lost money in mining companies and oil . The experience has taught me that oil does not behave like other commodities.
I thought that we might have an oil shortage by now. Apparently so did Warrwen Buffet when he bought oil stocks right before the collapse in 2008.
There has been a lot of speculation about Saudi Arabia capacity . Are you aware of the announcemet that Saudi Aramco is going to take the company Public.
I wonder if this means a limit has been reached in the Saudi Oil reserve. Or are they raising money to buy shale oil reserves in the US. Or both.
When a Republican is elected president and robust recovery begins there will be a serious shortage of oil production. Remember what happened after the Greenspan deflation of the late 1990s? When recovery began with the Bush presidency the oil price skyrocketed. The current slump in oil is even more serious and production will decline even more than under the Yellen deflation that under the Greenspan deflation.
Would you like to see Trump (plus maybe S. Palin) as our next President ?
Heaven forbid! Trump is not a Republican. His money and ideas are all Democrat. He only wears a Republican button when he is looking for a handout.
there are a significant number of self described republicans who say otherwise. or perhaps the republican party, as you define it, is much smaller than you realize?
Is Jeb Bush a Republican in your definition ?
Yes, Jeb is a Republican. He has been all his life.
Understand Trump supported President Obama and the Clintons. He gave money to left wing governors of New York to help them get elected. His policies go from supporting partial birth abortion to single payer health care. He was a Democrat most of his life.
Now that he is running as a Republican he tries to hide his real views but they are all Democrat, except perhaps immigration.
trumps financial support has been almost exclusively to republicans over the past five years
http://www.npr.org/sections/itsallpolitics/2015/07/28/426888268/donald-trumps-flipping-political-donations
do you exclude people from the republican party who have not towed the party line their entire lives? seems like a plurality of republican voters seem to think he is a valid republican. perhaps most republicans define the position differently than yourself? maybe the republican party is not longer what you think it should be? guess we will find out in the polls.
The title leads one to expect something on supply, which is there, and demand, which in the post is more about world gdp growth than bbl consumption. Comparing bbl produced to consumed is more meaningful, in my opinion.
Re: Saudi Arabia
Based on EIA/BP data, Saudi total petroleum liquids + other liquids production was 11.5 million bpd in 2005 and 11.6 million bpd in 2014. Because of rising domestic consumption*, Saudi net exports fell from 9.5 million bpd in 2005 to 8.4 million bpd in 2014 (total petroleum liquids + other liquids).
EIA data put Saudi production at 11.9 million bpd for the first half of 2015. If we assume 2015 annual production of 12 million bpd and no change in consumption, Saudi net exports in 2015 would be at about 8.8 million bpd in 2015, versus 9.5 million bpd in 2005. In other words, it’s almost certainly true that Saudi net exports have been below their 2005 rate for 10 straight years.
*EIA shows 2005 Saudi consumption at 2.0 million bpd; BP puts 2014 consumption at 3.2 million bpd (EIA consumption data for 2014 not yet available for Saudi Arabia)
And a link to some comments about the current situation in Saudi Arabia, in regard to the royal family:
http://peakoilbarrel.com/bakken-up-in-november-plus-steo/#comment-556202
As annual Brent crude oil prices doubled from $55 in 2005 to an average of $110 for 2011 to 2013 inclusive, OPEC 12 net exports of oil fell from 29 million bpd in 2005* to 27 million bpd in 2013 (total petroleum liquids + other liquids, 2014 EIA consumption data not yet available).
*Incorporating revised 2005 EIA Saudi production number, but otherwise based on EIA data compiled in late 2014
A comment about US natural gas production:
The EIA is apparenlty forecasting that US natural gas production will be approximately stable in 2016 and then rising in 2017. Here is a chart showing the EIA’s current outlook for US gas production in 2016 and 2017:
http://peakoilbarrel.com/wp-content/uploads/2016/01/556826-1.png
I find the EIA outlook for US natural gas production to be interesting, given the collapse in the US total rig count, down to 650 currently, from about 1,700 a year ago, and it was as high as 2,000 rigs in the 2011 to 2014 time frame.
Assuming a 24%/year rate of decline in existing US gas production*, the US has to put on line about 17 BCF/day of new production per year to maintain current production. Based on 2013 EIA data (2014 data not available), 17 BCF/day exceeds the dry gas production of every country in the world, except for the US and Russia. In other words, to maintain stable output, the US has to put on line, in one year, more dry gas production per year than the 2013 production levels of every country in the world, except for the US & Russia–with a collapsing US rig count.
Here is the EIA data table for 2013 and 2014 international dry gas production, in thousands of BCF/year (as noted incomplete for 2014):
http://www.eia.gov/cfapps/ipdbproject/iedindex3.cfm?tid=3&pid=26&aid=1&cid=regions&syid=2013&eyid=2014&unit=BCF
17 BCF/day is 6.2 TCF/year (6,200 BCF/year).
Here the 2013 dry gas production numbers for three large natural gas producers around the world:
Iran: 5.7 TCF/year
Qatar: 5.6
Canada: 5.1
So, I estimate that in order to maintain current gas production, the US has to put on line, in one year, more gas production than the total 2013 gas production from any of these three countries–with a collapsing rig count.
*Supported by the observed 20%/year net rate of decline in Louisiana’s marketed gas production from 2012 to 2014 (net decline being the decline rate after new wells were put on line)
A question for Steven Kopits, and anyone else:
Waiting for high decline rates to have an effect on US gas production has been like “Waiting for Godot,” but on the other hand we have not recently had a sustained total US rig count in the 600 range.
Doesn’t this represent a clear and present danger to the US economy next winter, or I am I missing something?
So, here’s the campaign ad: Dodd-Frank leaves little place left for lending other than to oil production channeling QE to US oil production, formation of ISIS concentrates radicals in one region giving Iraq the breathing room it needs to get production up, Iran nuke deal boost supply and brings stored reserves online. Obama oil boom.