I’m not going to “pull an Ed Lazear” and declare “no”. But the current versions of indicators are not very supportive of a “yes” answer.
Reader BC writes:
The US is likely in recession, which was not (and will not be) preceded by a yield curve inversion.
As noted in yesterday’s post, no US recession is indicated by current spreads. Key indicators [1] monitored by the NBER’s Business Cycle Dating Committee (BCDC) do not suggest we are in a recession currently, save industrial production.
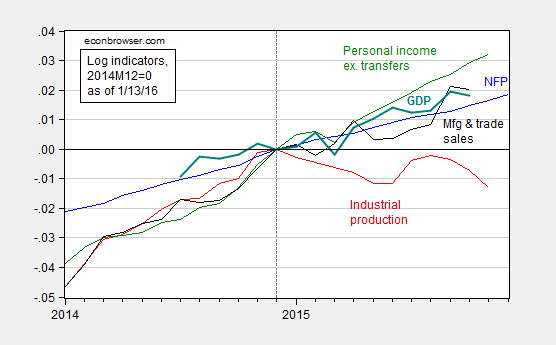
Figure 1: Log nonfarm payroll employment (blue), industrial production (red), personal income ex.-transfers in Ch.09$ (green), manufacturing and trade sales in Ch.09$ (black), and GDP in Ch.09$ (bold teal), all normalized to 2014M12 = 0, accessed 1/13/2016. Source: BLS, Federal Reserve Board, St. Louis Fed, and BEA via FRED, Macroeconomic Advisers December 15th release, and author’s calculations.
Industrial production is 1.3% below peak. Interestingly, manufacturing output is 1% above peak. The other indicators continue to trend upward. Notice the monthly GDP measure is an estimate provided by Macroeconomic Advisers. Figure 2 depicts another measure of monthly GDP, as well as the official BEA measure.
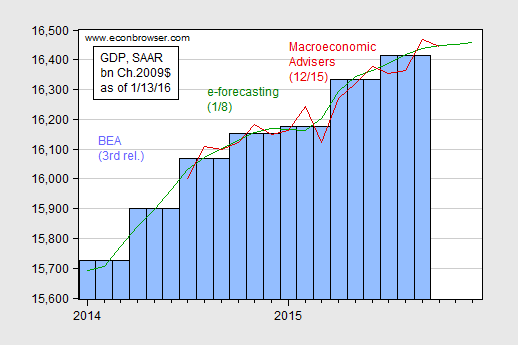
Figure 2: GDP from BEA (blue bars), and from e-forecasting on 1/8 (green), and from Macroeconomic Advisers on 12/15 (red), all in bn. Ch.2009$ SAAR, accessed 1/13/2016. Log scale. Source: BEA 2015Q3 3rd release, e-forecasting, Macroeconomic Advisers, and author’s calculations.
The 2010 BCDC memo lists Stock and Watson monthly GDP and GDI measures, as well as civilian employment and aggregate hours. Only the latter two series are freely available, so I’ll also plot those.
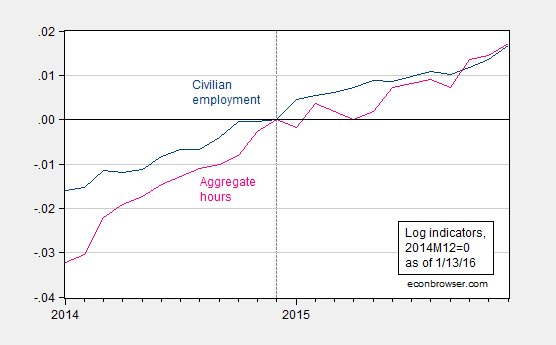
Figure 3: Log civilian employment (dark blue), and aggregate weekly hours in the private sector (pink), all normalized to 2014M12 = 0, accessed 1/13/2016. Source: BLS via FRED, and author’s calculations.
Both series are 1.7% above end-2012 levels.
Obviously, nothing definitive can be said; these series will all be revised. But with four out of the five indicators higher than they were in 2014M12, it seems to me at the minimum, the jury is still out on an ongoing recession.
Update, 1/14 9am Pacific: Tim Duy has an employment data-based assessment. The WSJ survey is out. In response to Anarchus’s comment regarding “now”, here is the histogram of forecasts for 2016Q1 q/q growth at annual rates.
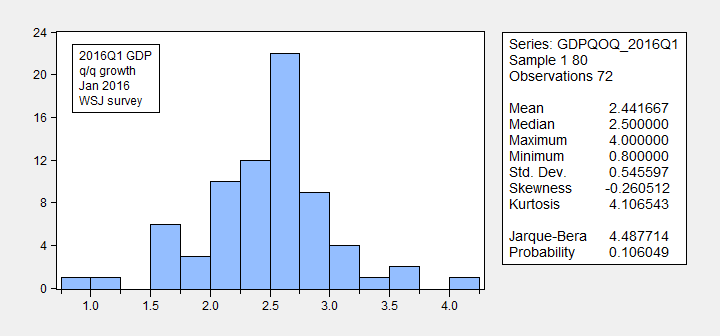
Figure 4: Histogram of forecasted q/q GDP growth rates in 2016Q1, from January 2016 WSJ poll of forecasters. Source: WSJ.
The problem with answering the question of: “Are we in a recession NOW” depends on what your definition of now is”.
All of the data we have currently is for 4Q 2015 and a lot of that data is subject to revision. I’ve been tracking the Atlanta Fed GDPNow report and I think it does a great job aggregating data, and it’s down to 0.8% for the fourth quarter of 2015.
Latest forecast — January 8, 2016
The GDPNow model forecast for real GDP growth (seasonally adjusted annual rate) in the fourth quarter of 2015 is 0.8 percent on January 8, down from 1.0 percent on January 6. The forecast for the contribution of inventory investment to fourth-quarter real GDP growth declined 0.2 percentage points to -0.8 percentage points after this morning’s wholesale trade report from the U.S. Census Bureau.
http://tinyurl.com/jp7bwx7
Back to my point: To me, NOW means the first quarter of 2016. As a professional investor, I would say we’re teetering on the edge. I like the manufacturing ISM as a decent tell. If it goes below 45 in the first quarter of 2016, I’ll have to make the call official – Recession.
http://tinyurl.com/gptbv7e
Anarchus: I have posted the 2016Q1 q/q forecast distribution from the January 2016 WSJ survey of economists.
not often you see GDP fading with such good jobs numbers, but every report i reviewed last week appears to subtract from 4th quarter GDP… both wholesale and factory inventories came in 0.3% lower despite just a 0.1% drop to finished goods prices…a drop in growth of inventories could take a 100 basis points off of GDP growth which already looks to have a fairly weak PCE component…the Atlanta Fed puts the 4th quarter growth at an 0.8% rate; this is the first time i’ve ever thought they might be too high…
if you have a recession, it will be regional, in energy producting states….retail receipts in N.Dakota, for instance, are down 25% YoY..
Professor Chinn, I would be careful of using the yield curve as a forecasting tool in times of deflation or near-deflation. The yield curve never inverted between 1931 and the mid-1950s. Here is a link to the relevant FRED graph:
https://research.stlouisfed.org/fred2/graph/?g=38GP
Thus it missed the severe 1938 recession, the 1945 post-war recession, and several other rather deep recessions.
That being said, the manufacturing recession is concentrated in the Oil Patch and those areas most exposed to global trade, and recessions don’t happen immediately after you add nearly 300,000 jobs a month for 3 months running.
This explains why the yield curve inversion didn’t occur for the 2 recessions between 1945-1950: “Between early 1942 and 1951, the Federal Reserve and the Treasury agreed to cap yields on long-term bond yields and peg the rate on short-term Treasury bills” – http://www.federalreserve.gov/foia/files/2.20081212.ZLB.memo.public.pdf
The 1937 recession wasn’t foreseen by a yld curve inversion but the curve did steadily flatten beforehand.
Japan had recessions in the 90s that were not foreseen by yield curve inversion however the curve did flatten beforehand.
Thanks very much for the Fed link. Helpful! Of course, the cap on long term rates wouldn’t have prevented an inversion via their going down.
There is mathematical recession and practical recession. Mathematical recession is based on the flawed indicator GDP and so is always a lagging indicator at best, but is better seen as a measure of government spending not real production.
Ricardo: And a “practical” recession is whatever Dick/DickF/RicardoZ/Ricardo defines?
I suspect that a mathematical recession is when someone else loses their job; and a practical recession is when you lose your job.
Or am I confusing a practical recession with a depression?
LOL.
Ricardo said: “There is mathematical recession and practical recession.”
An important distinction, IMO. We need to understand (define) what recessions really look like. What are their characteristics?
Take labor market conditions, for example. In (or approaching) recession, labor market conditions are changing from favorable to hostile. Is that happening? (No.)
In (or approaching) “modern” recessions, credit conditions are becoming more hostile. Is that happening? (No.)
In (or approaching) recessions, multiple sectors of the economy are deteriorating together. Is that happening? (No.)
Sebastian
Sebastian:
Even though payroll employment is still robust, labor market conditions are not especially rosy. The employment to population ratio is in sick territory. The best leading indicator of employment – initial unemployment claims – bottomed in October. Claims are on a trajectory that would put them in recession territory around April. The first quarter Manpower, Inc. index has ticked down. Also, the precipitous drop in the Dow Industrials will give pause to hiring, with momentum of lack of hiring and layoffs picking up as the Dow drops further. In July I commented that the Dow had almost surely entered a bear market.
Credit conditions are deteriorating rapidly. The credit impulse went negative in June, with increasing downward magnitude ever since. From the Fed’s Z1, convert the levels of overall domestic nonfinancial credit to monthly numbers and take the second derivative. See the body of Steve Keen’s work on this on this. Also, loan officers are tightening lending standards at an accelerating pace.
Multiple sectors of the economy are going down. Manufacturing is by many measures already in recession. Economy-wide, the transportation sector is in freefall. For current evidence on transportation, look at the Dow Transports index.
In some respects, we may not be out of the last recession:
https://research.stlouisfed.org/fred2/series/HOUST
https://research.stlouisfed.org/fred2/series/MEHOINUSA672N
In light vehicle sales, the U.S. has reach pre-recession levels:
https://research.stlouisfed.org/fred2/series/ALTSALES
…but there are concerns of a global slowdown:
http://www.wsj.com/articles/why-auto-stocks-are-sinking-after-car-sales-record-year-1452626877
What these mixed signals seem to tell us is that the economy is not exactly “humming” along and that until incomes rise, we might not have a consumer-driven economy as in the past. Hence, any “blip” could send the economy reeling again. I think that consumers have definitely benefited from the low oil prices just as the energy sector is suffering (good news; bad news).
One area to watch might be exports which peaked last year:
http://www.tradingeconomics.com/united-states/exports
i find it interesting that we are having a discussion about the possibility of a recession, right after we had the fed raise rates. it simply reinforces the view of many that rate raising was not a necessary step last month. i am not sure we have a recession upcoming, but i do believe we have equity markets which are overvalued. some may interpret that correction as a bit of a recession. and the china economy is going to sputter and cause not insubstantial downside risks with their financial sector over leveraged debt.
Here is the core and headline PCE vs the Fed 2% target. The last time we were at 2% was in the Spring of 2012.
http://tinyurl.com/z595pep
Better yet, let’s look forward. Here’s the 5-year, 5-year forward inflation break-even that Dr. Kocherlakota trolled the FOMC with on Twitter yesterday:
http://tinyurl.com/jxszrds
To the extent the Fed is supposed to control real world inflation and not inflation in their forecast, they’re screwing up.
Oh, wait! The Fed accidentally leaked their internal forecast for inflation last July – the PCE never got to 2% in their forecast, either. Some might call this madness.
“i find it interesting that we are having a discussion about the possibility of a recession, right after we had the fed raise rates. it simply reinforces the view of many that rate raising was not a necessary step last month”
Or maybe, just maybe, it reinforces the idea that our economy is a giant unsustainable bubble waiting to pop.
The post-2007 trend rate for real final sales/GDP per capita is near 0% vs. the long-term average of 2.1% and 2.6% during growth phases. Should a recession be underway, or imminent in 2016, we will be decelerating from a secular trend rate of near 0% instead of 2.1% (and ~1.1% trough to peak), which is well within the margin of error of the estimates for the deflator, inventories, and import prices. This is the similar trend of secular stagnation that has occurred in Japan since the mid- to late 1990s and in the US in the 1930s-40s (especially when focusing on private GDP growth), 1890s, and 1830s-40s.
Moreover, measures of liquidity such as the acceleration of velocity of Austrian Total Money Supply, demand deposits, M2 as a share of equity market cap, corporate cash flow and profits, and the Baa-10-year spread have been implying an eventual equity bear market and business cycle contraction since late 2014 to early 2015.
Corporate profits to GDP are at a similarly high-risk level as in 2000 and 2007. A similar cyclical decline for profits as a share of GDP would imply a loss of business income to GDP of 5-6%. If so, this would imply that the Fed would be required to print AT LEAST another $2 trillion in the next 2-3 years just to prevent nominal GDP per capita from decelerating to 0% or negative, which would not include any additional deficit spending as “stimulus”. This would put the Fed’s balance sheet at 70% of bank loans (not counting future charge-offs or run-offs) and 35% of GDP.
Bank C&I loan delinquencies and charge-offs began increasing YoY as of Q2-Q3.
I reiterate that US payroll tax receipts against reported wage and salary disbursements suggest that reported employment data are overstated and that YoY growth is barely positive as of May-July 2015 to date. This would explain the weak, recession-like growth of retail sales ex autos (encouraged by subprime auto loans and a marked increasing in loan terms), whereas the growth rate of auto sales has been decelerating.
Growth of consumer credit less student loans and subprime auto loans remains at recession-like levels of the past, implying that households are not levering up again outside student loans and subprime auto loans.
Housing entered another bubble in 2012-13, similar to previous bubbles against real wages and salaries, and Housing Bubble II has begun to deflate as of 2015. House prices are still much to high vs. Millennials’ incomes after taxes and debt service. Rising rents for 35% of the population along with increasing medical insurance premia (or out-of-pocket costs) are squeezing discretionary income of the bottom 90%.
US financial equities are at a precarious technical condition, not unlike in fall 2007 to winter 2008. Financials tend to lead the equity market and economy in and out of bear markets and recessions.
https://research.stlouisfed.org/fred2/graph/fredgraph.png?g=38Re
Finally, because of the nature of the hyper-financialization of the US economy, i.e., total net flows to the financial sector absorb an equivalent of virtually all annual growth of value-added output, the equity market (financial markets) is the economy. A sustained bear market decline for equities of the typical 35-50% would reduce equity market capitalization by $8-$12 trillion when US real, US$-adjusted net worth per capita has been in a deep, recession-like contraction since early 2015. The implied negative household wealth effect would be an equivalent of 2-2.5% of GDP (atop the loss of business income to GDP from a decline in profits to GDP), not counting the likelihood of another housing decline that would increase the negative wealth effect.
The reliance of the US economy upon successive asset bubbles with unprecedented debt to GDP renders the economy increasingly vulnerable to financial shocks, risk aversion, and liquidity preference, which is the historical characteristic of a Schumpeterian depression of the debt-deflationary regime of the Long Wave Trough.
Schumpeter and Irving Fisher and a few other of the old timers would know what to make of this “new” era, wouldn’t they?
For most of us who fall in the age range going from 45 to 80, our formative experiences were the “go go” sixties, the inflation/stagflation 1970s and 80s, and the still moderate inflation of the 1990s. For us, who came of age in that period money depreciated somewhat every year, our nominal incomes went up 5% or more every year, and the principal of our debts eroded 5% or more every year. This was what we came to see as “normal.” And like old dogs who are moved to a new house, we keep expecting everything to go back to the way it was in our puppy days. Hence we have dissociative response to facts of our new economic circumstances. But perhaps this is the more normal condition of Capitalism then the conditions that existed from 1939-1999, a period dominated by a great war and the preparations for a perhaps greater war, and residue of WWII and the Cold War finally ending with the reestablishment of something that resembled the international free trade capitalist societies of the late 19th century. And the feature of that Capitalism was a slow and steady price deflation, with an occasional sharp recession and panic. https://en.wikipedia.org/wiki/Long_Depression The Great Depression in 1929 it should be remembered was preceded by a period of steady moderate deflation (with stagnation in the U.K.), after WWI and post-war inflation came to an end in 1921. The secular stagnation theory first came up in 1937-38 as FDR’s New Deal inflation efforts dissipated. If WWII had not occurred, which caused Governments to create a huge demand for manpower and goods, one wonders if that stagnation would have continued. (The gold strikes on South Africa and Alaska in the late 1890s appeared to have created a moderate inflation under the international gold standard that provided debt relief and ended the Long Depression; also, in the following years European Governments engaged in an increasing arms race that spurred aggregate demand in period from 1900 to 1914, while the U.S. engaged in the large state capital project of building the Panama canal while also building modern Naval fleet.)
“Schumpeter and Irving Fisher and a few other of the old timers would know what to make of this “new” era, wouldn’t they?”
Indeed, including Kuznets, Juglar, Kondratiev, Minksy, Forrester, Wallerstein, Goldstein, Mandel, Rostow, Berry, et al.
Yep.
In the modern era, we have eccentrics such as Steve Keen and Michael Hudson, and that’s about it.
Carmen Reinhart and Kenneth Rogoff tiptoed into the waters but didn’t want to take on the world by going full-Austrian. Maybe they’re staying at home practicing their excel skills?
I see nothing in the official data that imply an extant or impending national recession in the US.
That said, one’s interpretation of data is inherently influenced by what he or she is experiencing day to day. Since the GR growth (or non-growth) in the US has been geographically fractured. There are major cities, and even entire States, where entry level jobs paying under $8 an hour still draw dozens, if not hundreds, of applicants of all experience levels. Areas where poverty rates are still topping 20%. There are others where fast food restaurants are offering $25k a year + $500 signing bonusses for new cashiers.
It may be human nature that when one sees continual economic carnage just outside the window, he or she becomes more likely to believe it to pervade the entire country, or world. Probably true for those who are living in booming areas as well.
I saw that back in the 80’s and 90’s as well.
The massive investment into tight oil and the huge amount of debt that is about to go under will cause another debt crisis in the united states. We are seeing the beginning of this right now and it will push the US into recession.
Except that investment is nothing. Sorry Kirk, this isn’t Residential investment or the computer revolution. There is little on that table. The lower oil prices also boost forms of investment. Crushing debt from this? Nope, nada and no.
15% of the high yield market seems like a lot… but maybe not enough. We shall see.
Just look at the spiking yields in the junk bond market in the energy sector. I’m sure those have been bundled into securities and sold… and risk aversion will make people avoid the sector as a whole. Junk bond market will be the origination of the crisis, though some of it may spill into investment grade and there are some tight oil companies like CLR and WLL that have somehow made this grade that are literally months away from bankruptcy
isn’t there a joke about economist predicting nine out of the last five recessions? Majority of economist can’t even get gdp right; can anyone remember what the forecasts were at the beginning of 2014? All this talk about low inflation – forget even measuring inflation; they don’t even know what the definition of inflation is.
No, that’s the stock market.
Economists pretty much have predicted none of the last 5 recessions.
Anarchus: Average recession in next 12 months probability in January 2007 WSJ survey was 28%.
The bond market predicted 9 out of the last five recessions. Economists gave you only five recessions.
How about Japanese-style deflationary stagflation, applied to some European countries, China, Brazil that puts off demand, as consumers (in US, at least) wait for prices to decline further before spending more? Lets not forget this lack of inflation is mainly due to an oversupply of oil, which is partly a temporary phenomena. But there will be big growth boost in developing countries due to Paris Climate Change accord that has developed countries paying developing countries to generate alternative energy technologies. The US is fine, due to $1.1 Trillion budget agreement that stimulates exports with renewal import-export bank, and increases spending on everything. Also, the $305 billion Highway Transportation bill will modernize-maintain our infrastructure.
I am gonna chuckle when OPEC cuts and oil prices go back to 45-50$. People will be screaming a inflationary holocaust is around the corner.
How much will they have to cut?? The US has enough wells waiting on completion we could bring on 1-2MM bpd in less than a year.
There is no recession, and I am not even on recession watch.
Interest rate differentials and recession probabilities, here:
http://www.prienga.com/blog/2016/1/18/us-recession-risk-assessment-interest-rates