BLS just released state level data. Wisconsin employment nonfarm payroll employment is up, but remains below what is expected given the historical relationship between US and Wisconsin employment — by 63.2 thousand…
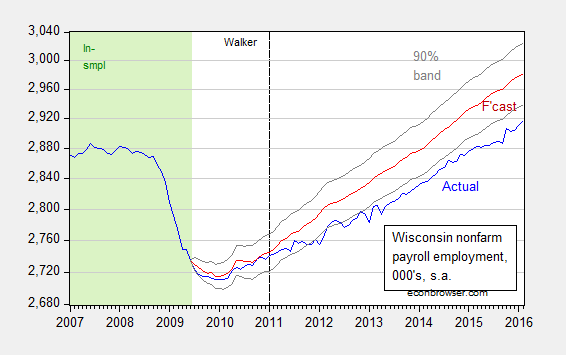
Figure 1: Wisconsin nonfarm payroll employment (blue), forecast from error correction model estimated over 1990M03-2009M06 (red), and 90% confidence band (gray lines), all on log scale. Dashed line at 2011M01 when Walker takes office, and light green denotes sample period. Source: BLS, author’s estimates (as described here).
Some have argued that Wisconsin’s lackluster performance is due to the strength of the dollar. This may be true, but it is not validated by the regression analysis. The dollar’s real value (as measured by the Fed) does not exhibit statistical significance in the error correction model. Moreover, the gap between the counterfactual and actual is not cointegrated with the (log) real dollar.
So beating up on first grade teachers apparently is a poor way to start economic growth?
This may be a factor that a simple regression analysis comparing Wisconsin employment to U.S. Total employment grow will not take into account.
https://en.wikipedia.org/wiki/List_of_U.S._states_by_population_growth_rate
Bruce Hall: I do not understand; the cointegrating regression takes account of the secular trends in US vs. Wisconsin employment. The long run elasticity of Wisconsin to US employment is around 0.6. Are you arguing that the trend has suddenly broken in 2011M01? It would help if you could couch your argument in terms of an equation.
No, I’m simply pointing out that Wisconsin has had very slow population growth versus the U.S. since 2010. It may well have been the same going back to 1950 (or whenever your series started), but it would seem, intuitively, that slower population growth should have an impact on absolute job growth. If population is, indeed, one of the regression variables in the model, then it probably does have a true indication of Wisconsin’s employment performance recently.
I would think that econometric models will include factors that can affect job growth; e.g. population, educational attainment, etc. A simple comparison of historical job growth/unemployment rates for Wisconsin versus the U.S. would seem to have a high likelihood of missing recent developments in factors affecting employment. Certainly, when I ran such models at Ford Motor Company for parts sales budgeting, we attempted to account for changes in clearly related variables (6-year vehicles in operations, average age of vehicles, etc.).
Bruce Hall: Wisconsin has long had slower population growth than the US. Eyeballing the ratio of Wisconsin to US population, I don’t see a trend-break in 2011.
Bad example Bruce. Wisconsin’s population growth has nearly been cut in half since Walker took office in 2011, with much of that decline due to increasing migration out of the state, and is a marked change from the relatively decent job growth that preceded the Walker age. Even worse, 1/2 of Wisconsin counties have lost population in the last 5 years, while less than 1/4 lost population from 2000-2010, and almost all are rural areas.
Bruce, give it up. It’s failing in pretty much any way you slice it in Wisconsin, unless you’re into increasing inequality and power-grabs by right-wing oligarchs.
Perhaps you may find this useful taking into account the 2010-15 growth estimate as well. You may find page 7 interesting. Economics is more than just political policies. Sometimes you can’t fight demographics.
http://www.apl.wisc.edu/publications/2010_census_chartbook_wi.pdf
Bruce Hall: I don’t see how that page you refer to is at all illuminating. *IF* trend population growth 2011 onward was less than pre-, relative to the US, then your point would be well taken. Otherwise, it’s irrelevant, given the incorporation of a cointegrating relationship in the estimation procedure.
Wisconsin’s population has been
growing for decades, although its
growth rate has fluctuated.
Between 2000 and 2010, the
state’s population increased by
6%. Taking a long-view, Wisconsin
grew at a faster rate during the
1950s, 1960s, and 1990s – decades
of general economic growth.
Growth between 2000 and 2010
was slower and is on par with
growth in the 1970s and 1980s,
the period of deindustrialization
and economic contraction.
Nationally, the population grew by
9.7% between 2000 and 2010. This is the slowest state
growth rate since the Great Depression (7.3% in the 1930s).
However, it was comparable to the national growth rate
between 1980 and 1990 (9.8%).
___________________________
From 2010 to 2015
38 Wisconsin 5,771,337 5,686,986 +1.48%
____________________________
It appears to me that population growth is stalling in Wisconsin… a phenomenon beginning at the start of the 21st century.
But you should really at least scan the rest of the document which covers the demographic makeup of the population, including the decline in younger age brackets and the growth of the retirees.
As I said, the “cointegrating relationship” may be losing it’s validity based on recent demographic changes. A good model will account for such changes.
It looks like Wisconsin is not the only place that has been experiencing downward revisions to employment figures: http://libertystreeteconomics.newyorkfed.org/2016/03/upstate-new-york-job-growth-the-bad-news-is-that-the-good-news-was-wrong.html#.VvqkzfkrKUk
I live in Minneapolis, and Uber entering the market has materially increased my quality of life. My typical cab fare from my apartment to Uptown and Downtown decreased from about $15 and $20 respectively, to $5 and $10 respectively using Uber. I can get an Uber within 10 minutes 100% of the time. A taxi will typically take 15 minutes during non-peak times, and 40 minutes (if I can get a cab at all!!!) during peak times. During peak times, I now have choices. I can now choose to pay surge pricing to have an Uber right now, or I can pay less (though not that much less) to have a taxi within an hour (if I can actually get one). Choices!
Dear Dr. Chinn,
Thank you for your work. Another aspect to this “experiment” here in Wisconsin is that the current legislature have not been good stewards of the state budget leaving roads and local education in a much worse condition.
It is interesting to see how many local school districts are resorting to referendums at the local level that used to go toward fixing buildings or constructing new ones, but now a lot of that money goes just to run schools. https://wasblegupdate.wordpress.com/2016/03/29/school-referenda-scheduled-for-tuesday-april-5-2016/#more-5619
Also, you may be interested in this: http://www.bloombergview.com/articles/2016-03-29/kansas-tried-tax-cuts-its-neighbor-didn-t-guess-which-worked
Thank you.
What do you make of this? (I have wondered about the nature of these comparisons among states.)
http://onlinelibrary.wiley.com/doi/10.1111/jors.12261/abstract
Menzie,
All of these graphs and regressions are fine and dang but what is causing the variance?