Industrial production is down. Wisconsin nonfarm payroll employment is down. Global Temperatures hit records in 2014, 2015.
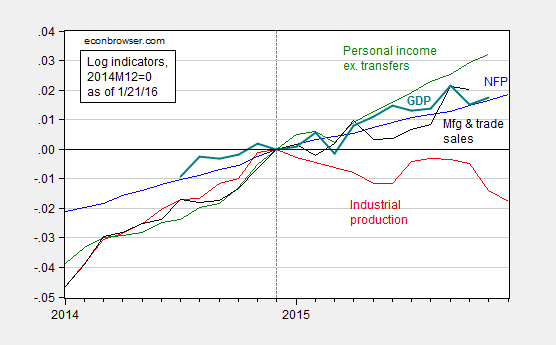
Figure 1: Log nonfarm payroll employment (blue), industrial production (red), personal income ex.-transfers in Ch.09$ (green), manufacturing and trade sales in Ch.09$ (black), and GDP in Ch.09$ (bold teal), all normalized to 2014M12 = 0, accessed 1/21/2016. Source: BLS, Federal Reserve Board, St. Louis Fed, and BEA via FRED, Macroeconomic Advisers January 20th release, and author’s calculations.
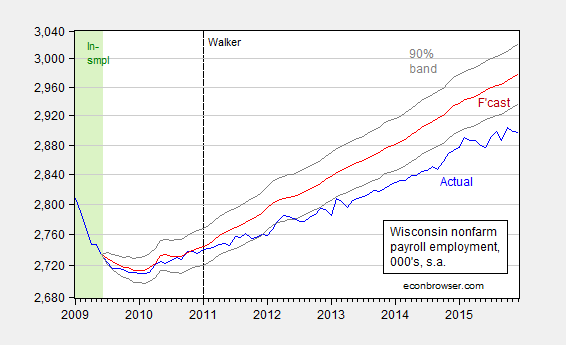
Figure 2: Wisconsin nonfarm payroll employment (blue), forecast from error correction model estimated over 1990M03-2009M06 (red), and 90% confidence band (gray lines), all on log scale. Dashed line at 2011M01 when Walker takes office, and light green denotes sample period. Source: BLS, author’s estimates.
The counterfactual forecast is based on a bivariate single equation error correction model involving national and Wisconsin nonfarm payroll employment, with one lag of first differences, and a contemporaneous first difference US NFP (hence, US NFP is weakly exogenous). Notice the sample used for estimation is up to 2009M06 (NBER defined trough), and the forecast tracks well until 2011M01.
Note that the gap between Governor Walker’s August 2013 recommittal to hit the 250,000 new private jobs target and measured employment is actually widening, from 87,200 in October to 95,400 in December.
Here’s what’s in the DWD release of 1/21.
“Under Governor Walker’s leadership, the number of employed Wisconsinites reached a record high in December 2015, meaning more people were employed in Wisconsin than ever before, “DWD Secretary Reggie Newson said. “Additionally, our state’s labor force participation rate grew to 68 percent, which is more than five percentage points higher than the national rate. As the Governor noted Tuesday during his State of the State address, the Wisconsin comeback is real.”
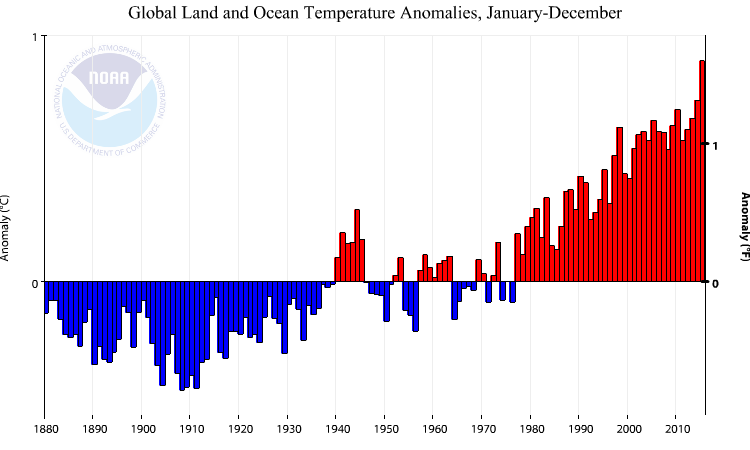
Figure 3: Global land/sea temperature anomaly, for 12 month periods. Source: NOAA.
From NOAA:
The January–December map of temperature anomalies shows that warmer-than-average temperatures occurred across the vast majority of the globe during 2015, combining to bring overall record warmth for 2015, at 0.90°C (1.62°F) above the 20th century average. This easily surpasses the previous record set just last year by 0.16°C (0.29°F). The global temperatures were strongly influenced by the strong El Niño conditions that developed during the year. The 2015 temperature also marks the largest margin by which an annual temperature record has been broken. Prior to this year, the largest margin occurred in 1998, when the annual temperature surpassed the record set in 1997 by 0.12°C (0.22°F). Incidentally, 1997 and 1998 were the last years in which a similarly strong El Niño was occurring. The annual temperature anomalies for 1997 and 1998 were 0.51°C (0.92°F) and 0.63°C (1.13°F), respectively, above the 20th century average, both much lower than the 2015 temperature.
In other words, it was hotter than the last El Niño years.
Plus one (Jan 25):
2015 was the year of smallest increase in Wisconsin private nonfarm payroll growth, in numbers, and percent.
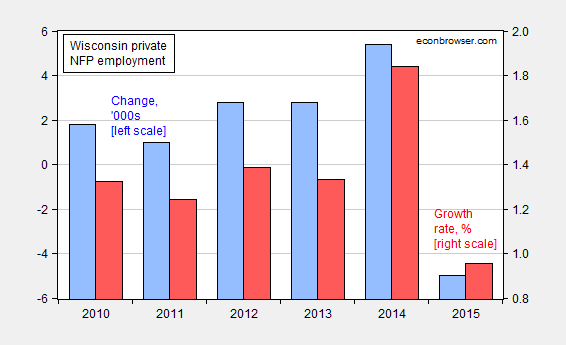
Figure 4: Wisconsin private NFP growth, in levels, 000’s (blue bar, left scale), and percent (red bar, right scale). Source: BLS, DWD, author’s calculations.
Regarding temperatures: Nothing to see here. Those spikes are just a temporary hiatus of the hiatus. Soon the hiatus of the hiatus will go on hiatus and we will be back to just the hiatus.
Joseph, you are actually correct. A year from now the hiatus of hiatus will have finished and the hiatus will probably have added the better part of the entire year. Then we can await the next hiatus of the hiatus which will almost sure coincide with the next El Nino. During the continued hiatus there will be many new data adjustments tot he surface data sets to remove the hiatus. Just as we saw with ERSSTv4. So we will be able to say the next hiatus of the hiatus will be man caused. 😉
NOAA says this in the SOTC https://www.ncdc.noaa.gov/sotc/ : “…2015 …surpassing the previous record set last year by 0.29°F (0.16°C)…” Or was it? This graph also shows uncertainty, which appears to be ~0.09C. https://www.ncdc.noaa.gov/sotc/service/global/global-land-ocean-mntp-anom/201501-201512.png We also know that the ERSSTv4 adjustment which was implemented in mid 2015 added another ~0.06C to the temperatures. Without that adjustment and applying the uncertainty we see the record may have been set by +/- 0.01C to 0.1C. An El Nino is expected to be followed by a La Nina, and these often drop annual temps by ~0.15 to 0.2C.
It should be interesting to see the dissembling if these temps drops appear. Can we expect ERSSTv5???
Worth showing why IP has slowed–oil prices and El Niño, with a minor contribution from manufacturing.
https://research.stlouisfed.org/fred2/graph/?g=3dU0
On Thursday January 21, 2016, the WI Legislative Fiscal Bureau’s updated revenue report showed that Wisconsin is expected to take in $158 million less in revenue due to a $158 million in estimated tax collections. http://docs.legis.wisconsin.gov/misc/lfb/revenue_estimates/140_january_21_2016.pdf
That should read “…expected to take in $158 million less in revenue due to a decrease in estimated tax collections.”
Next year when temperatures are lower than this year because of no El Nino can we confidently state…. “2016 global temperatures are higher than at nearly any other point in recorded history”?
Or will you throw a hissy fit about how that statement is inaccurate because you can point to 2015 temperatures > 2016 temperatures?
H-y-p-o-c-r-i-t-e
Jay: No. I think I’ll just quote some fella who wrote “Living is Syria is better than living in Wisconsin.”
CoRev: “Joseph, you are actually correct.”
Thank you for demonstrating that even the most ridiculous mockery is no match for the fervently held beliefs of the loons.
I find it curious that the deniers consider 2015 to be an El Nino outlier while clinging to 1998, another El Nino year, as the gold standard baseline for their hiatus. Even that tactic fails now if you choose to measure peak to peak.
Joseph, as always it depends upon which data set is used to feed your graph/beliefs. Remember loons have sources too! 😉
https://research.stlouisfed.org/fred2/graph/fredgraph.png?g=3e0I
https://research.stlouisfed.org/fred2/graph/fredgraph.png?g=3e0J
https://research.stlouisfed.org/fred2/graph/fredgraph.png?g=3e12
The US/world is in recession again, circa the late 1930s, early 1890s, late 1830s, and aligning with the Hegemonic Cycle with the period coinciding with the American and French Revolutions.
https://www.youtube.com/watch?v=Xk9wWj8Wh30
https://www.youtube.com/watch?v=6EWqTym2cQU
https://www.youtube.com/watch?v=NSTct2FFamw
https://www.youtube.com/watch?v=CNdOsL4Xe7Q
https://www.youtube.com/watch?v=W6TIwCGUvvU
Natural variation obviously plays a role in global temperatures. The largest drivers of natural variation are ENSO (El Nino/La Nina), variations in Total Solar Irradiance, and aerosols (volcanoes). After accounting for these effects the resulting graph of global temperatures is a clear indication of the trend. This of course has been down numerous times by climate scientists. E.g., Foster & Rahmstorf (2011): Here’s their Figure 3 Raw data versus exogenous data removed
ENSO does not explain the trend in global temperatures.
The sun does not explain the trend in global temperatures.
Anyone that relies on either of these two explanations is simply wrong.
Kevin claims: “The largest drivers of natural variation are ENSO (El Nino/La Nina), variations in Total Solar Irradiance, and aerosols (volcanoes).” I think they should be limited to short term variations of decades and less. There are several longer term drivers not even addressed.
CoRev – Really? What other drivers of natural variation over this period are of significance?
Outside the decadal range there are at least the AMO, PDO (both in the 50-70 year range), bond events in the ~1,000 -1,500 range, and the obvious glaciations. I thought we had discussed this.
The AMO? Wrong. And yes, we have discussed this. The AMO does not explain global warming. Simply looking at an AMO graph shows the lack of correlation to the trend in global warming.
Likewise the PDO; again, just look at a graph. These are unphysical ‘cycles’ arguments. Neither holds any scientific weight.
Your other arguments are ‘fairies’ arguments. I.e., you might as well argue that climate fairies control global temperatures.
Kevin, I’m not taking the bait.
CoRev – and let’s please not bring up the Tsonis, Curry, Wyatt ‘regime change’ or ‘stadium wave’ nonsense. That’s obviously been debunked already.
Curry made several predictions based on this climate networking mish-mash:
“Implications for the future: I. IPCC AR5 view
The hiatus will end soon, with the next El Nino
.
Implications for the future: II. View emphasizing natural internal variability
The ‘hiatus’ will continue at least another decade
Climate models are too sensitive to external forcing
Hiatus persistence beyond 20 years would support a firm declaration of problems with the climate models
Incorrect accounting for natural internal variability implies:
—Biased attribution of 20th century warming
—Climate models are not useful on decadal time scales”
The IPCC (consensus) view turned out to be correct. The ‘hiatus’ disappeared with the El Nino. Curry et al’s view was incorrect.
Observations now sit almost perfectly at the mean of climate models.
Assume for a moment Curry *is* correct (laughable, I know) and we are in a period of depressed temperatures due to the ‘stadium wave’ – then how high will global temperatures skyrocket when it reverses again? I.e., the (failed) hypothesis would be a reason for *more* alarm – not less.
Kevin, we can not say the el Nino is over quite yet, so it is premature to make predictions. The IPCC (consensus) view can not yet be correct. What will we be looking at when the la Nina is in full swing?
The el Nino did not end the hiatus in the surface data sets. Implementation of ERSSTv4 did. If you believe the NOAA presser it never existed. http://www.reportingclimatescience.com/news-stories/article/noaa-news-release-on-science-no-slowdown-paper.html Except, of course in the satellite data, where it is still evident
CoRev – do we really need to do this dance again? Explain Ocean Heat Content.
Kevin,
Baffled, my examples have always been for the temperature TRENDS of the TLT, satellites, or the surface data sets. I have never claimed temperature did not change in other regimes.
Is this your meaning?
glob·al warm·ing
[ˈɡlōbəl ˈwôrmiNG]
NOUN
a gradual increase in the overall temperature of the earth’s atmosphere generally attributed to the greenhouse effect caused by increased levels of carbon dioxide, chlorofluorocarbons, and other pollutants.”
Mate if you think there has been a hiatus when 2014 and 2015 are the two hottest years on record I have some shares in the Sydney Harbour Bridge to sell to you!
nottrampis, Baffled, and Kevin this hiatus: http://www.woodfortrees.org/plot/rss/from:1979/mean:12/offset:-0.1/plot/rss/from:1996.5/mean:12/offset:-0.1/trend/plot/hadcrut3gl/from:1997/mean:12/offset:-0.25/trend/plot/hadcrut3gl/from:1979/mean:12/offset:-0.25
Since this is the end of the year i used annual values and the offset needed to put them on the same baseline for the anomalies, The UK data, is used as it is one of the surface data sets still available on WFT that had not implemented the NOAA ERSTv4 adjustments.
If you guys do not believe the other surface datasets showed the hiatus prior to ERSSTv4, I have that graph also.
let’s clear something up corev. are you arguing for a hiatus in a single satellite data set? or are you arguing their is a hiatus in global warming? which is your position?
Baffled, my examples have always been for the temperature TRENDS of the TLT, satellites, or the surface data sets. I have never claimed temperature did not change in other regimes.
Is this your meaning?
glob·al warm·ing
[ˈɡlōbəl ˈwôrmiNG]
NOUN
a gradual increase in the overall temperature of the earth’s atmosphere generally attributed to the greenhouse effect caused by increased levels of carbon dioxide, chlorofluorocarbons, and other pollutants.”
corev, if you believe that there is continued global warming-from any source-then you should be concerned about how a “hiatus” fits into this phenomena. in that case, your continued focus on a hiatus makes no sense.
on the other hand, if you use the idea of a hiatus to reinforce a notion of a lack of continued global warming, you are in direct conflict with the vast majority of observations we have made in the last few decades.
so again i ask, does your view of a hiatus apply only to a satellite data set? or does is apply to global temperatures as a whole?
you really cannot embrace both the concept of a hiatus in a data set (in order to promote conspiracy theories) and at the same time embrace the notion that overall global warming is occurring (because to deny this marks one clearly as a fraud).
Baffled, now you have fallen to the level of name calling, fraud?
What part of this definition is too hard to understand? “glob·al warm·ing…NOUN
a gradual increase in the overall temperature of the earth’s atmosphere generally attributed to the greenhouse effect caused by increased levels of carbon dioxide, chlorofluorocarbons, and other pollutants.” There I highlighted the term. the importance of that term is because glob·al warm·ing, is a climate science term, and climate science is the study of climate: “cli·mate… the weather conditions prevailing in an area in general or over a long period”,
and most weather occurs in the troposphere, the lower part of the ATMOSPHERE.
The oceans are not the atmosphere, where scientist from the beginning have used temperature TRENDS to show climatic change since that is where most weather occurs.
There I went full circle to show how the focus on a hiatus in the atmospheric temperatures makes great sense.
Since nothing has changed in the science, I do not intend to pursue this any further.
ocean temperatures directly affect the “atmosphere”. to argue otherwise is fraud. ocean temperatures are a major driver of global climate. they have been included in the global warming discussion from the beginning. your attempt at a “distinction” between atmosphere and ocean is quite simply, foolish.
corev, you need to face up to the corner you have painted yourself into. a “hiatus” is inconsistent with what we know about the current state of global climate and heat content. it is a fool’s errand to continue to harp upon the importance of the “hiatus”, unless you are of the class of people who continue to promote the idea that global warming is not occurring. people in that case are conducting fraud. once one is educated on the topic, one should realize the “hiatus” argument has very little importance to what we are seeing in the world today.
Baffled, Since nothing has changed in the science, and you clearly can not keep straight the differences between OHC, surface temperatures (ocean and land), and the importance to climate of atmospheric temperatures (especially on lower and mid troposphere), I do not intend to pursue this any further.
corev, you should not pursue this any further. your position is foolish. your argument for the “hiatus” lacks any importance taken within the context of what we actually are observing. if global warming, irregardless of cause, is actually occurring, then the concept of a “hiatus” is inconsistent with how we are observing the world to change. therefore, placing any importance on the hiatus is contradictory to what we observe in the real world-it is simply a distraction from the real issues. it is a disingenuous argument.
on the other hand, if you use the hiatus to support the view that global warming is not occurring, then one is simply a fraud and ignoring reality. either way, support for the “hiatus” argument appears foolish.
Here’s a “random” graph that might put global warming in perspective. Yes, it’s a bit old, but the perspective is still valid. Conclusion: We’re all gonna die! (just not from global warming)
http://hallofrecord.blogspot.com/2007/02/global-warming-clearer-perspective.html
Menzie – when CoRev or some other pseuodskeptics starts his “models don’t match observations” meme, perhaps you’ll be kind enough to show this image.
Kevin, woulde you give the cite for that graph?
CoRev – Courtesy of Dr Gareth Jones of the UK Met Office
https://twitter.com/GarethSJones1/status/665178788683194368
Kevin, thanks & wow! Did you notice the hiatus in that observation data? Do you know what his smoothing factor is? Because the seasonal and annual data do not reflect his graph. Jones seems to have an issue with Zeke’s interpretation.
what hiatus???????