The sheer audacity (and vagueness) of Senator Sanders’ economic program means that there is a lot of uncertainty surrounding impacts: wholesale replacement of ACA, rapid increases in marginal tax rates, rapidly escalating infrastructure spending, among others. Here’s CRFB’s estimate of the impact on debt-to-GDP.
Frankly speaking, it’s pretty brave of of CRFB to try to score the Sanders plan, given the many imponderables.
Based on our estimates, Senator Sanders’s proposals would raise both spending and revenue to far beyond any previous levels in the United States over the last half century. Assuming lower health costs, spending (including net interest) will average 30 percent of Gross Domestic Product (GDP) over the decade, and assuming higher health costs, spending will average 35 percent. By comparison, the United States has spent an average of about 20 percent of GDP over the last half century and never more than 24.4 percent.
Senator Sanders would also increase revenue substantially, to about 25 percent of GDP over the decade, which is significantly higher than the historical average of 17.4 percent and well above the previous record of 20 percent of GDP set in the year 2000.
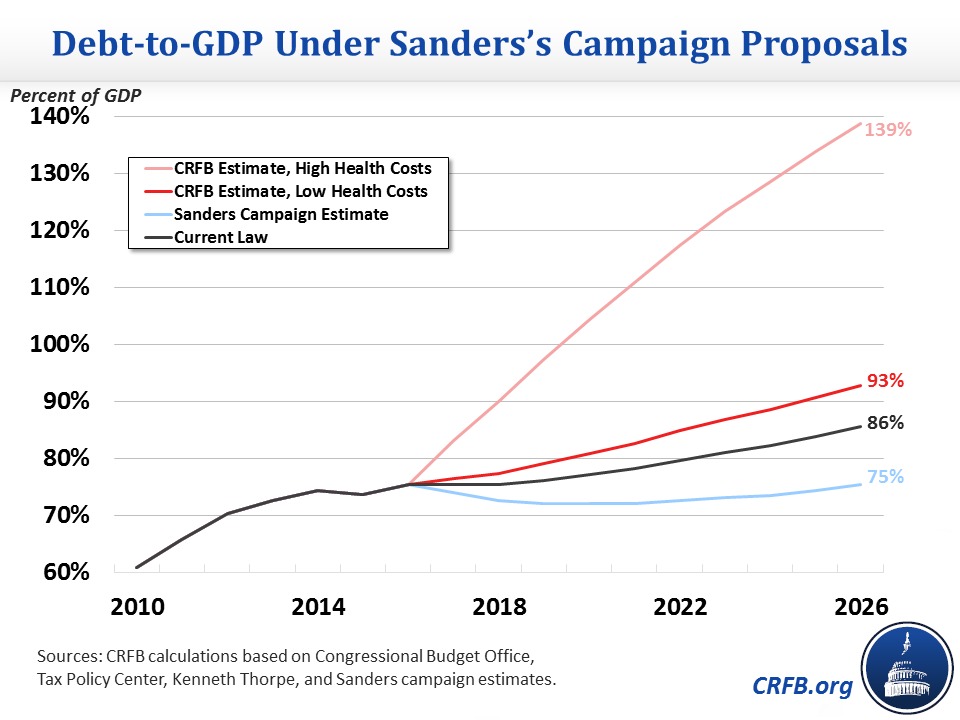
In dollar terms, we find that Senator Sanders’s major initiatives would cost over $17 trillion and up to $28 trillion (depending on health assumptions), while his tax increases – based largely on estimates from [Tax Policy Center] – would raise less than $16 trillion. Incorporating interest, the result would be $2 trillion to $15 trillion of additional debt, causing debt to rise from about 74 percent of GDP in 2015 (and 86 percent by 2026 under current law) to between 93 and 139 percent of GDP by 2026.
No dynamic scoring here — and it’s not clear which way the sum effect would go: Very high marginal tax rates vs. universal health care and other potentially labor supply enhancing policies.
Update, 4/15 3:30PM Pacific: An alternative way of assessing budgetary implications is to look at the Tax Policy Center assessment on revenues, and Gerald Friedman’s assessment of expenditures. They are, respectively, $15.3 trillion and $17.7 trillion respectively. That’s a $2.4 trillion gap, of 8.6% of potential GDP under baseline in 2026.
Nice exposition, clarifies previous post on this topic.
Of course, Congress would not vote for any of this. So a vote for Sanders comes down to
– tone of the Presidency
– Supreme Court picks
– foreign policy priorities
– use of executive orders / “prosecutorial discretion”
I would prefer Hillary in all but tone.
Liberals should care what deficit scolds say why?
jeff: Shouldn’t everybody care what might happen if various fiscal provisions are implemented? Now, if you are saying the assessments are incorrectly calculated, that is relevant, and I would welcome your comments regarding that aspect. Are you saying Tax Policy Center and/or CRFB are making problematic assumptions?
When Has Our Federal Debt Ever Hurt Us?
Since we abandoned the gold standard for our money in 1933, our debt has increased more than 800 fold. Were we better off at the bottom of the Great Depression? Industrial production has increased 2632% since 1933, although it is now falling due to the 74.5% reduction of the deficit since FY2009.
We had our highest debt-to-GDP ratio after WWII, then increased the debt 82% and federal spending 725% over the next quarter century from 1948, producing our greatest prosperity: a 168% increase in real GDP.
By 2015, federal spending was 454% higher and the national debt was 19 times greater than when Pres. Reagan took office in 1981. The result: Real GDP gained 153% and private sector jobs increased 60%.
The debt is 440 times higher than in 1940 when Pres. Franklin Roosevelt was re-elected to his third term.
https://www.whitehouse.gov/omb/budget/historicals Table 1.1
http://www.treasurydirect.gov/govt/reports/pd/histdebt/histdebt.htm
The consequences: real GDP has increased 1190% since 1940 and private sector jobs have more than quadrupled since 1940. Total employment today is at a record high over 142 million.
In World War II, Americans saved. After the war, there was a wall of money and pent-up demand.
There are consequences when federal debt reach the levels of Greece and Japan.
Debt/GDP is only half the story. Let’s not forget the enormous tax hike for everyone, especially those north of $70K.
http://www.vox.com/policy-and-politics/2016/3/25/11293258/tax-plan-calculator-2016
Well, there’s certainly plenty of things that are a bit fishy and unexplained in Sanders’ economic plan, but I wasn’t impressed with the CRFB paper. Then again, a quick scan of who is associated with the CRFB told me a lot of what I needed to know. Alan Simpson and Erskine Bowles? Really? Pete Peterson? Gimme a break.
Their makes several mistakes. For example, they pretend that the current healthcare mandate under Obamacare is not a tax. This is nonsense. Even the Supreme Court agrees that it’s a tax. So when Sanders shifts healthcare insurance costs from mandatory insurance premiums paid by the individual to his or her insurer and replaces it with single payer, that in itself does not represent a tax hike in any meaningful sense of the term. What’s the difference between the government telling me to pay an insurance company $XXX dollars who then take their cut before giving some portion to medical providers rather than having the government increase my income taxes by $XXX and giving it to medical providers? This folks, is called a distinction without a difference.
As to the higher income tax rate, I would agree that a 77% marginal rate is probably above the maximum revenue raising rate (but not by much). On the other hand, current tax rates are very far below the revenue maximizing rate. It is still quite likely that a 77% rate would generate a lot more revenue than the current top rate. Sanders also wants a stiff inheritance tax, which I didn’t see mentioned in their report. I even scanned the document looking for “inheritance” and didn’t get any hits. This would raise some revenue, but more importantly it would dampen inequality.
I’m sorry, but Thorpe’s analysis is a joke. It’s basically a worst case scenario packaged as the most likely outcome. I quit reading it after a while. And if you throw out the bogus Thorpe report, then the Sanders numbers don’t look quite so bad.
I’m skeptical of a lot of dynamic scoring analyses because they are based on some pretty implausible assumptions about labor’s response to tax cuts. And notice that the CRFB paper slips in some dynamic scoring of its own, only they use it to show how the Sanders plan would reduce the labor supply. Okay, that’s fine. But then they should also do him the courtesy of applying dynamic scoring to things that would very likely increase potential GDP…stuff like immigration reform, untethering people from employer provided healthcare, expanded higher education, brick and mortar infrastructure spending, etc. And if they think the Sanders carbon tax of $15 per ton is a crushing tax, then there is no hope for the planet anyway, so who the hell cares about the debt when the planet cooks!
As Brad DeLong might say, “Why or why can’t we have a better think tank?” There’s so much that’s wrong with the Sanders plan that should have been pointed out. Instead we got Reinhart & Rogoff Part Deux.
2slugbaits: As I read the document, CRFB did not incorporate the dynamic scoring of the Tax Foundation into the headline debt projection. It only referred to the Tax Foundation dynamic scoring when talking about debt sustainability (bottom page 7 of the document).
As I note in the addendum, an alternative way of assessing budgetary implications is to look at the Tax Policy Center assessment on revenues, and Gerald Friedman’s assessment of expenditures. They are, respectively, $15.3 trillion and $17.7 trillion respectively. That’s a $2.4 trillion gap, of 8.6% of potential GDP under baseline in 2026, roughly the same as the gap as that in baseline vs. low health cost option, shown in the graph.
Menzie Yes, they said that they didn’t do any dynamic scoring, but it looks to me like they slipped in some dynamic scoring through the back door. For example, they scored Sanders’ carbon tax as an increase in the deficit because they claimed it would “reduce income and payroll tax revenue.” They also charge his clean energy program with a $40B retraining cost for fossil fuel workers. Okay, that’s fine. But here they pull a kind of reverse dynamic scoring by not offsetting that cost with tax revenues. If the government spends $40B in training, those training dollars will show up as income for somebody, and those somebodies will pay taxes. This is willfully ignoring existing tax laws. There claim of a $350B increase in the debt due to his clean energy program is utterly implausible. Strangely, they don’t count the rebates from the carbon tax as cuts in the effective marginal tax rate shown in their table. It’s as though it all just disappears.
And while they say that they didn’t do any dynamic scoring, their narrative is liberally peppered with ominous implications right out of the dynamic scoring playbook. For example: “…higher tax rates Senator Sanders proposes on both labor and capital (nor his more generous entitlement spending), which would likely be above the revenue-maximizing levels for the highest earners and could lead to slower growth and an even higher debt-to-GDP ratio.”
Here’s another statement that sure sounds like dynamic scoring:
Senator Sanders’s policies, outside of immigration reform,7 would slow long-term economic growth as a result of huge increases in effective marginal tax rates on capital and labor as well as the expansion of various entitlement programs that are likely to discourage work and savings.
They also relied upon a “macroeconomic feedback analysis from the Tax Foundation” and concluded that the Sanders plan would reduce the size of the economy by 9.5% over ten years. Sure sounds like dynamic scoring to me.
The point is that their narrative is shot through with dynamic scoring despite their claim to the contrary.
When you look at their first table, the “low cost” increase in the debt is $2.0T. But look closer. Of that $2.0T, a full 97.5% of it is due to one category: $1.95T for “Medicare for All.” The casual reader will look at this table and think OH MY GOD, MY TAXES ARE GOING TO GO THROUGH THE ROOF! What the CRFB analysis doesn’t tell you is that the taxes mandated under Obamacare will virtually disappear. Much of the Sanders plan involves replacing one set of de facto taxes with another set of de jure taxes. I would agree that on balance “Medicare for All” will require some net increase in taxes, but nothing on the order of what the CRFB paper implies. They also focus on his proposed infrastructure spending; however, are we to assume from this that the other candidates do not plan to increase infrastructure spending? It’s not enough to just say that Sanders proposes “X” dollars on infrastructure spending without telling us how much this differs from the other candidates.
It’s all well and good to point out that the Sanders plan is probably overly optimistic. But what voters care most about, and what doesn’t get mentioned in these kinds of analyses, is whether the plan (warts, errors and all) is better than the status quo. The CRFB says the Sanders plan will increase the debt/GDP ratio from 86% to 93% by 2026. Suppose they are right and the Sanders camp has it all wrong. Does that mean we shouldn’t support something like the Sanders plan even if it does lead to a 93% debt/GDP ratio? If the CRFB is so concerned about the debt/GDP ratio, would they feel better if Sanders proposed even higher taxes in order to close the gap? Somehow I don’t think so. The real agenda of the CRFB is what it’s always been: Austerity Now. Austerity Tomorrow. Austerity Forever. The Sanders plan isn’t necessarily something that I would want if I were king and I have plenty of problems with it, but I would gladly accept a seven percentage point increase in the debt/GDP ratio if I thought Sanders had half a chance of actually getting those programs through Congress.
2slugbaits: My understanding of why the carbon tax rebates don’t show up in the marginal tax rates is because the plan as tabulated by Tax Policy Center is to rebate on per capita basis (p.16 Tax Policy Center assessment). That’s like a lump sum rebate, so doesn’t affect marginals.
In general, the tax side tabulations are based on TPC, which follow generally Joint Committee on Taxation (JCT) approaches. So maybe not always right, but consistent. (By the way, static analysis per JCT usually allows for behavioral responses, but not macro feedbacks).
It seems a rather odd analysis that would have us spending even more on healthcare by going to single-payer when every other country with single-payer spends less. Do we just ignore all the extant evidence on what single-payer actually means and just assume costs go up? The whole point of single-payer is that it’s more efficient, yet this analysis would seem to disagree.
What type of track records do CRFB and the Tax Policy Center have on recent budgetary and economic proposals? What type of interest rates are they projecting on the infrastructure spending? It would seem a no-brainer to do as much infrastructure right now as we possibly can – we should be building everything we need now and pushing as many projects forward as we can.
Kevin O’Neill: I’m sure the US health care system can be more efficient and less costly; but how fast can you squeeze out the rents built up over the past 30 years? It won’t happen overnight, is my guess…
Americans are in far worse health than “every other country.” The average American is a landbeast with 30+ BMI. Of course it’s going to cost more to keep those people alive.
There is economic theory and economic reality. Sometimes there is no correlation. A preview of Sanders’ “plan”?
http://money.cnn.com/2016/04/01/news/millionaires-fleeing-france/
http://www.theguardian.com/world/2014/dec/31/france-drops-75percent-supertax
Finance ministry studies showed that despite all the publicity, the sums obtained from the supertax were meagre, standing at €260m in 2013 and €160m in 2014, and affecting 1,000 staff in 470 companies. Over the same period, the budget deficit soared to €84.7bn.
There’s an old saying: if you want less of something, tax it. Apparently it holds true in this case.
Medicare provides health care cheaper than current insurance plans.
Imagine expanding Medicare at a modest rate, say dropping the age three years every year… As the system gets used to it maybe rate of change increases.
Logically the country’s overall health care costs decline as coverage steadily increases, in keeping with other countries’ experience. So just identify the individuals/companies that are saving from the change and charging them (a use tax) that amount.
We get an expansion in health care workers as coverage is extended and a decrease in insurance workers.
And an increase in average health.
If in fact we replicate other countries experience, I.e. Overall health care goes down, the use tax would have to decline to avoid a decline in the deficit.